33305 Investment Properties for Sale
Browse homes for sale and investment properties in 33305. Refine your search by price, property type, or more.
Best cash flowing properties in 33305
Active
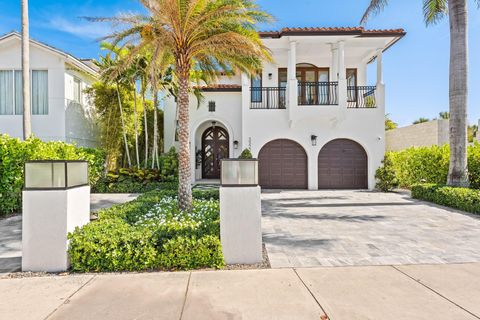
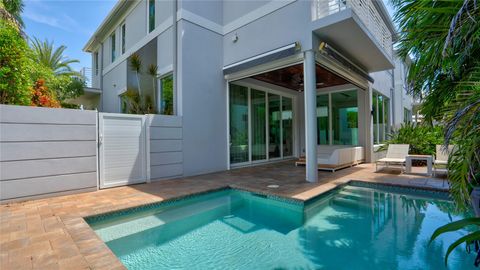
$430,000
4
bds
|
4
ba
|
3,039
sqft
|
built
2020
3400 NE 25th St, Fort Lauderdale, FL 33305
$3,720
Cash flow
45.1%
Cash-on-Cash Return
16.5%
Cap rate
2.3%
Rent to Value Ratio
Active
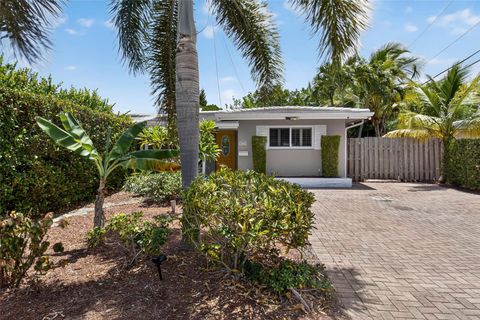
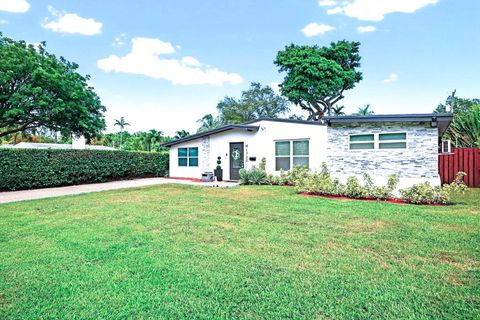
$145,000
1
bds
|
1
ba
|
750
sqft
|
built
1970
124 NE 19th Ct, Wilton Manors, FL 33305
$-482
Cash flow
-17.3%
Cash-on-Cash Return
2.2%
Cap rate
1.2%
Rent to Value Ratio
105 out of 129 properties for sale in 33305
Limited Results Shown
Create a free account, or log in to reveal all property listings and enjoy the complete experience.
Active
$2,450,000
4
bds
|
4
ba
|
3,056
sqft
|
built
2018
2516 NE 32nd Ave, Fort Lauderdale, FL 33305
$-8,161
Cash flow
-17.4%
Cash-on-Cash Return
2.1%
Cap rate
0.4%
Rent to Value Ratio
Active
$1,129,900
3
bds
|
4
ba
|
2,150
sqft
|
built
2009
2509 N Ocean Blvd, Fort Lauderdale, FL 33305
$-3,577
Cash flow
-16.5%
Cash-on-Cash Return
2.3%
Cap rate
0.7%
Rent to Value Ratio
Active
$234,000
1
bds
|
1
ba
|
722
sqft
|
built
1973
801 NE 18th Ct, Fort Lauderdale, FL 33305
$-865
Cash flow
-19.3%
Cash-on-Cash Return
1.7%
Cap rate
0.8%
Rent to Value Ratio
Active
$1,950,000
4
bds
|
4
ba
|
3,020
sqft
|
built
1957
2524 NE 26th Ter, Fort Lauderdale, FL 33305
$-4,406
Cash flow
-11.8%
Cash-on-Cash Return
3.4%
Cap rate
0.5%
Rent to Value Ratio
Active
$300,000
2
bds
|
2
ba
|
1,180
sqft
|
built
1973
1940 NE 2nd Ave, Wilton Manors, FL 33305
$-973
Cash flow
-16.9%
Cash-on-Cash Return
2.3%
Cap rate
0.8%
Rent to Value Ratio
Active
$1,799,000
3
bds
|
3
ba
|
2,332
sqft
|
built
1954
2425 NE 26th Ave, Fort Lauderdale, FL 33305
$-4,746
Cash flow
-13.8%
Cash-on-Cash Return
3.0%
Cap rate
0.6%
Rent to Value Ratio
Active
$3,875,000
3
bds
|
4
ba
|
2,623
sqft
|
built
2018
2200 N Ocean Blvd, Fort Lauderdale, FL 33305
$-23,267
Cash flow
-31.3%
Cash-on-Cash Return
-1.1%
Cap rate
0.2%
Rent to Value Ratio
Active
$1,400,000
3
bds
|
2
ba
|
1,404
sqft
|
built
1955
2417 NE 18th Ave, Wilton Manors, FL 33305
$-5,904
Cash flow
-22.0%
Cash-on-Cash Return
1.1%
Cap rate
0.3%
Rent to Value Ratio
Active
$799,999
3
bds
|
2
ba
|
1,703
sqft
|
built
1957
111 NE 16th Ct, Fort Lauderdale, FL 33305
$-1,835
Cash flow
-12.0%
Cash-on-Cash Return
3.4%
Cap rate
0.6%
Rent to Value Ratio
Active
$200,000
1
bds
|
1
ba
|
552
sqft
|
built
1971
1200 NE 17th Ct, Fort Lauderdale, FL 33305
$-508
Cash flow
-13.3%
Cash-on-Cash Return
3.1%
Cap rate
0.9%
Rent to Value Ratio
Active
$4,300,000
4
bds
|
4
ba
|
4,245
sqft
|
built
2009
3322 NE 16th Pl, Fort Lauderdale, FL 33305
$-17,824
Cash flow
-21.6%
Cash-on-Cash Return
1.2%
Cap rate
0.3%
Rent to Value Ratio
Active
$2,850,000
4
bds
|
4
ba
|
3,407
sqft
|
built
2017
3200 NE 26th St, Fort Lauderdale, FL 33305
$-8,259
Cash flow
-15.1%
Cash-on-Cash Return
2.7%
Cap rate
0.4%
Rent to Value Ratio
Active
$549,900
2
bds
|
2
ba
|
1,012
sqft
|
built
1960
2115 NE 15th Ave, Wilton Manors, FL 33305
$-1,562
Cash flow
-14.8%
Cash-on-Cash Return
2.7%
Cap rate
0.5%
Rent to Value Ratio
Active
$790,000
3
bds
|
2
ba
|
1,423
sqft
|
built
1950
1708 NE 16th Ter, Fort Lauderdale, FL 33305
$-1,491
Cash flow
-9.8%
Cash-on-Cash Return
3.9%
Cap rate
0.6%
Rent to Value Ratio
Active
$2,200,000
4
bds
|
2
ba
|
2,660
sqft
|
built
1970
2440 NE 25th Pl, Fort Lauderdale, FL 33305
$-5,558
Cash flow
-13.2%
Cash-on-Cash Return
3.1%
Cap rate
0.5%
Rent to Value Ratio
Active
$700,000
3
bds
|
2
ba
|
1,355
sqft
|
built
1957
1637 N Victoria Park Rd, Fort Lauderdale, FL 33305
$-1,824
Cash flow
-13.6%
Cash-on-Cash Return
3.0%
Cap rate
0.6%
Rent to Value Ratio
Active
$624,000
2
bds
|
1
ba
|
964
sqft
|
built
1959
2108 NE 11th Ave, Wilton Manors, FL 33305
$-1,895
Cash flow
-15.8%
Cash-on-Cash Return
2.5%
Cap rate
0.5%
Rent to Value Ratio
Active
$1,795,000
3
bds
|
3
ba
|
2,172
sqft
|
built
1999
2100 N Ocean Blvd, Fort Lauderdale, FL 33305
$-6,783
Cash flow
-19.7%
Cash-on-Cash Return
1.6%
Cap rate
0.6%
Rent to Value Ratio
Active
$2,430,000
3
bds
|
2
ba
|
4,184
sqft
|
built
1954
3321 NE 16th Ct, Fort Lauderdale, FL 33305
$-9,023
Cash flow
-19.4%
Cash-on-Cash Return
1.7%
Cap rate
0.4%
Rent to Value Ratio
Active
$848,800
2
bds
|
2
ba
|
1,362
sqft
|
built
1952
1625 NE 20th Ave, Fort Lauderdale, FL 33305
$-2,004
Cash flow
-12.3%
Cash-on-Cash Return
3.3%
Cap rate
0.5%
Rent to Value Ratio
Active
$545,000
2
bds
|
2
ba
|
1,100
sqft
|
built
1980
2029 N Ocean Blvd, Fort Lauderdale, FL 33305
$-1,954
Cash flow
-18.7%
Cash-on-Cash Return
1.8%
Cap rate
0.6%
Rent to Value Ratio
Active
$1,995,000
5
bds
|
4
ba
|
2,768
sqft
|
built
1955
2216 NE 18th Ave, Wilton Manors, FL 33305
$-6,388
Cash flow
-16.7%
Cash-on-Cash Return
2.3%
Cap rate
0.4%
Rent to Value Ratio
Active
$725,000
2
bds
|
0
ba
|
1,828
sqft
|
built
1959
1433 NE 22nd St, Wilton Manors, FL 33305
$-3,231
Cash flow
-23.3%
Cash-on-Cash Return
0.8%
Cap rate
0.3%
Rent to Value Ratio
Active
$300,000
1
bds
|
2
ba
|
740
sqft
|
built
1972
1839 Middle River Dr, Fort Lauderdale, FL 33305
$-946
Cash flow
-16.5%
Cash-on-Cash Return
2.4%
Cap rate
0.8%
Rent to Value Ratio
Active
$999,000
3
bds
|
3
ba
|
2,271
sqft
|
built
1999
810 NE 21st Dr, Wilton Manors, FL 33305
$-1,405
Cash flow
-7.3%
Cash-on-Cash Return
4.5%
Cap rate
0.7%
Rent to Value Ratio
Active
$675,000
3
bds
|
3
ba
|
1,730
sqft
|
built
1952
1912 NE 16th Ter, Fort Lauderdale, FL 33305
$-963
Cash flow
-7.4%
Cash-on-Cash Return
4.4%
Cap rate
0.7%
Rent to Value Ratio
Active
$1,475,000
2
bds
|
3
ba
|
1,608
sqft
|
built
1952
2020 NE 3rd Ter, Wilton Manors, FL 33305
$-5,073
Cash flow
-17.9%
Cash-on-Cash Return
2.0%
Cap rate
0.3%
Rent to Value Ratio
Active
$725,000
2
bds
|
2
ba
|
1,199
sqft
|
built
1957
901 NE 18th St, Fort Lauderdale, FL 33305
$-1,688
Cash flow
-12.1%
Cash-on-Cash Return
3.4%
Cap rate
0.5%
Rent to Value Ratio
Active
$719,000
3
bds
|
2
ba
|
1,160
sqft
|
built
1957
904 NE 18th St, Fort Lauderdale, FL 33305
$-1,513
Cash flow
-11.0%
Cash-on-Cash Return
3.6%
Cap rate
0.6%
Rent to Value Ratio
Active
$3,999,000
5
bds
|
7
ba
|
5,058
sqft
|
built
1990
2600 NE 21st St, Fort Lauderdale, FL 33305
$-17,193
Cash flow
-22.4%
Cash-on-Cash Return
1.0%
Cap rate
0.2%
Rent to Value Ratio
Active
$8,800,000
5
bds
|
6
ba
|
4,690
sqft
|
built
2009
2898 NE 26th St, Fort Lauderdale, FL 33305
$-44,516
Cash flow
-26.4%
Cash-on-Cash Return
0.1%
Cap rate
0.1%
Rent to Value Ratio
Active
$4,700,000
4
bds
|
5
ba
|
3,258
sqft
|
built
2023
2225 NE 19th St, Fort Lauderdale, FL 33305
$-24,237
Cash flow
-26.9%
Cash-on-Cash Return
0.0%
Cap rate
0.1%
Rent to Value Ratio
Active
$274,000
2
bds
|
1
ba
|
725
sqft
|
built
1972
1460 NE 18th St, Fort Lauderdale, FL 33305
$-921
Cash flow
-17.5%
Cash-on-Cash Return
2.1%
Cap rate
0.7%
Rent to Value Ratio
Active
$1,500,000
4
bds
|
3
ba
|
1,987
sqft
|
built
1970
1801 NE 23rd Ave, Fort Lauderdale, FL 33305
$-4,666
Cash flow
-16.2%
Cash-on-Cash Return
2.4%
Cap rate
0.5%
Rent to Value Ratio
Active
$1,500,000
2
bds
|
3
ba
|
2,172
sqft
|
built
1999
2100 N Ocean Blvd, Fort Lauderdale, FL 33305
$-6,083
Cash flow
-21.2%
Cash-on-Cash Return
1.3%
Cap rate
0.6%
Rent to Value Ratio
Active
$779,000
3
bds
|
2
ba
|
1,550
sqft
|
built
1964
1606 NE 15th Ave, Fort Lauderdale, FL 33305
$-1,894
Cash flow
-12.7%
Cash-on-Cash Return
3.2%
Cap rate
0.6%
Rent to Value Ratio
Active
$1,400,000
2
bds
|
2
ba
|
1,711
sqft
|
built
1952
1900 Bayview Dr, Fort Lauderdale, FL 33305
$-3,656
Cash flow
-13.6%
Cash-on-Cash Return
3.0%
Cap rate
0.5%
Rent to Value Ratio
Active
$530,000
2
bds
|
2
ba
|
1,100
sqft
|
built
1980
2029 N Ocean Blvd, Fort Lauderdale, FL 33305
$-1,464
Cash flow
-14.4%
Cash-on-Cash Return
2.8%
Cap rate
0.6%
Rent to Value Ratio