33305 Investment Properties for Sale
Browse homes for sale and investment properties in 33305. Refine your search by price, property type, or more.
Best cash flowing properties in 33305
Active
$199,000
1
bds
|
2
ba
|
728
sqft
|
built
1980
1826 N Dixie Hwy, Fort Lauderdale, FL 33305
$-443
Cash flow
-11.6%
Cash-on-Cash Return
3.5%
Cap rate
1.0%
Rent to Value Ratio
Active
$145,000
1
bds
|
1
ba
|
750
sqft
|
built
1970
124 NE 19th Ct, Wilton Manors, FL 33305
$-482
Cash flow
-17.3%
Cash-on-Cash Return
2.2%
Cap rate
1.2%
Rent to Value Ratio
118 out of 144 properties for sale in 33305
Limited Results Shown
Create a free account, or log in to reveal all property listings and enjoy the complete experience.
Active
$3,900,000
5
bds
|
4
ba
|
3,142
sqft
|
built
1956
2878 NE 26th St, Fort Lauderdale, FL 33305
$-18,188
Cash flow
-24.3%
Cash-on-Cash Return
0.6%
Cap rate
0.3%
Rent to Value Ratio
Active
$1,500,000
2
bds
|
3
ba
|
2,172
sqft
|
built
1999
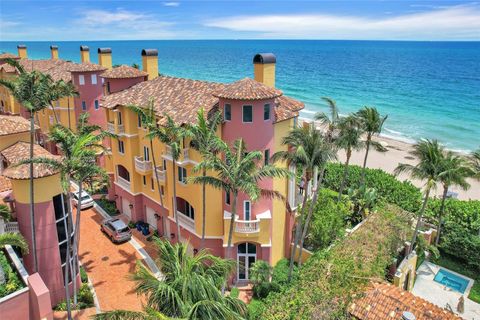
2100 N Ocean Blvd, Fort Lauderdale, FL 33305
$-6,083
Cash flow
-21.2%
Cash-on-Cash Return
1.3%
Cap rate
0.6%
Rent to Value Ratio
Active
$779,000
3
bds
|
2
ba
|
1,550
sqft
|
built
1964
1606 NE 15th Ave, Fort Lauderdale, FL 33305
$-1,894
Cash flow
-12.7%
Cash-on-Cash Return
3.2%
Cap rate
0.6%
Rent to Value Ratio
Active
$1,500,000
bds
|
0
ba
|
2,629
sqft
|
built
1958
2036 NE 21st Ave, Fort Lauderdale, FL 33305
$-6,860
Cash flow
-23.9%
Cash-on-Cash Return
0.7%
Cap rate
0.2%
Rent to Value Ratio
Active
$1,400,000
2
bds
|
2
ba
|
1,711
sqft
|
built
1952
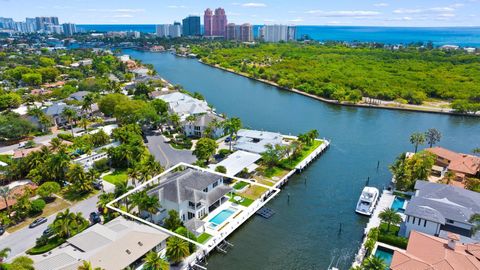
1900 Bayview Dr, Fort Lauderdale, FL 33305
$-3,656
Cash flow
-13.6%
Cash-on-Cash Return
3.0%
Cap rate
0.5%
Rent to Value Ratio
Active
$1,470,000
3
bds
|
2
ba
|
1,910
sqft
|
built
1957
2500 NE 17th Ter, Wilton Manors, FL 33305
$-4,812
Cash flow
-17.1%
Cash-on-Cash Return
2.2%
Cap rate
0.5%
Rent to Value Ratio
Active
$530,000
2
bds
|
2
ba
|
1,100
sqft
|
built
1980
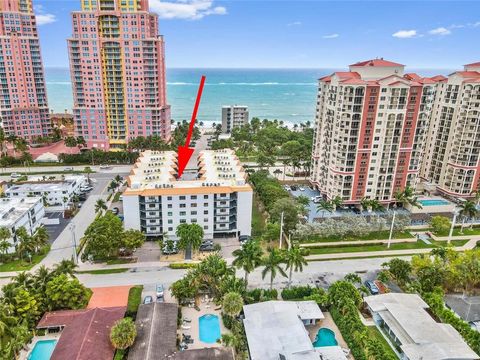
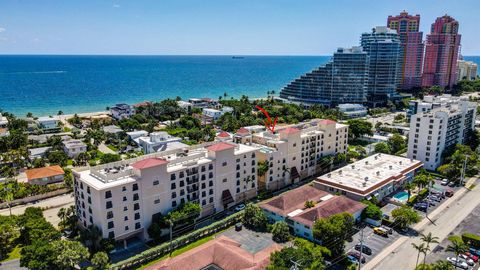
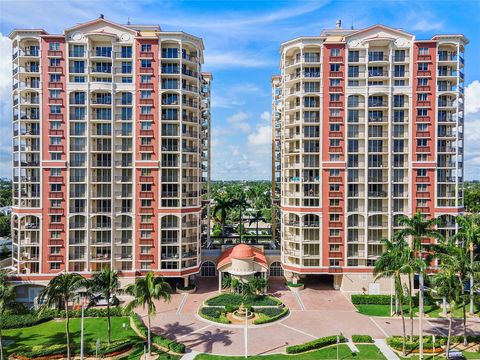
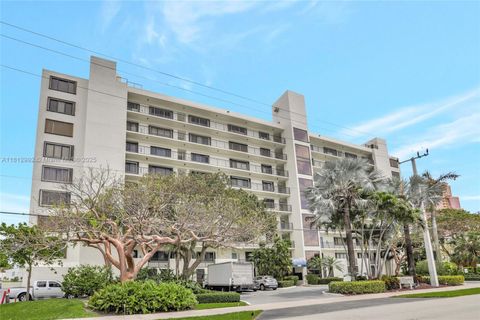
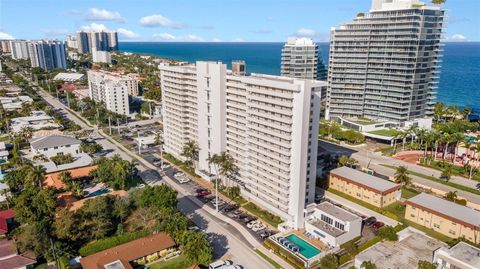
2029 N Ocean Blvd, Fort Lauderdale, FL 33305
$-1,464
Cash flow
-14.4%
Cash-on-Cash Return
2.8%
Cap rate
0.6%
Rent to Value Ratio
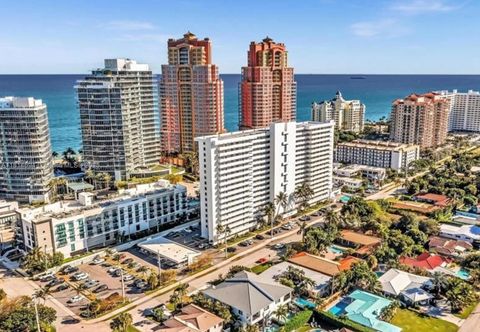
Active
$475,000
1
bds
|
2
ba
|
850
sqft
|
built
2008
2409 N Ocean Blvd, Fort Lauderdale, FL 33305
$-1,949
Cash flow
-21.4%
Cash-on-Cash Return
1.2%
Cap rate
0.7%
Rent to Value Ratio
Active
$2,600,000
3
bds
|
3
ba
|
2,824
sqft
|
built
1972
2108 NE 24th St, Wilton Manors, FL 33305
$-9,625
Cash flow
-19.3%
Cash-on-Cash Return
1.7%
Cap rate
0.2%
Rent to Value Ratio
Active
$998,700
3
bds
|
2
ba
|
1,630
sqft
|
built
1950
1508 NE 18th St, Fort Lauderdale, FL 33305
$-2,633
Cash flow
-13.8%
Cash-on-Cash Return
3.0%
Cap rate
0.5%
Rent to Value Ratio
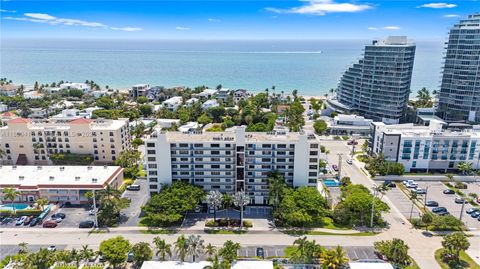
Active
$495,000
1
bds
|
1
ba
|
890
sqft
|
built
2005
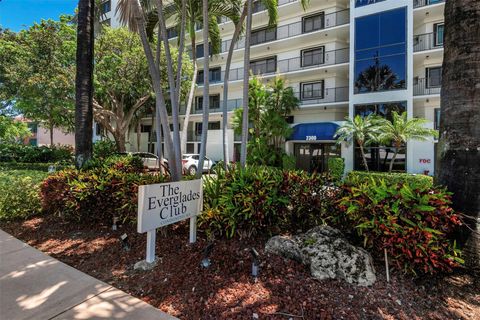
2011 N Ocean Blvd, Fort Lauderdale, FL 33305
$-1,210
Cash flow
-12.8%
Cash-on-Cash Return
3.2%
Cap rate
0.9%
Rent to Value Ratio
Active
$2,695,000
4
bds
|
5
ba
|
2,633
sqft
|
built
1956
2432 Bayview Dr, Fort Lauderdale, FL 33305
$-7,459
Cash flow
-14.4%
Cash-on-Cash Return
2.8%
Cap rate
0.4%
Rent to Value Ratio
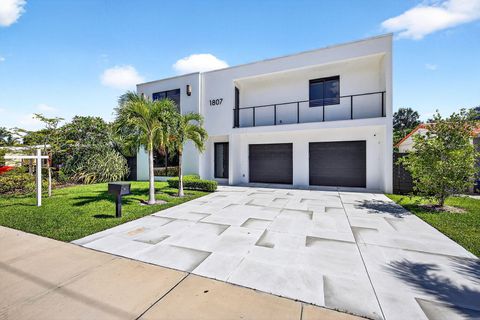
Active
$2,400,000
4
bds
|
5
ba
|
3,424
sqft
|
built
2022
1807 NE 18th St, Fort Lauderdale, FL 33305
$-8,273
Cash flow
-18.0%
Cash-on-Cash Return
2.0%
Cap rate
0.4%
Rent to Value Ratio
Active
$3,500,000
3
bds
|
4
ba
|
2,014
sqft
|
built
1951
2756 NE 18th St, Fort Lauderdale, FL 33305
$-17,362
Cash flow
-25.9%
Cash-on-Cash Return
0.2%
Cap rate
0.2%
Rent to Value Ratio
Active
$349,000
2
bds
|
2
ba
|
1,180
sqft
|
built
1973
1940 NE 2nd Ave, Wilton Manors, FL 33305
$-1,313
Cash flow
-19.6%
Cash-on-Cash Return
1.6%
Cap rate
0.7%
Rent to Value Ratio
Active
$2,750,000
5
bds
|
4
ba
|
0
sqft
|
built
2025
1700 NE 18th St, Fort Lauderdale, FL 33305
$-12,596
Cash flow
-23.9%
Cash-on-Cash Return
0.7%
Cap rate
0.1%
Rent to Value Ratio
Active
$699,000
3
bds
|
3
ba
|
1,295
sqft
|
built
1948
2506 NE 6th Ave, Wilton Manors, FL 33305
$-1,029
Cash flow
-7.7%
Cash-on-Cash Return
4.4%
Cap rate
0.7%
Rent to Value Ratio
Active
$165,000
1
bds
|
1
ba
|
750
sqft
|
built
1970
9 NE 19th Ct, Wilton Manors, FL 33305
$-604
Cash flow
-19.1%
Cash-on-Cash Return
1.8%
Cap rate
1.0%
Rent to Value Ratio
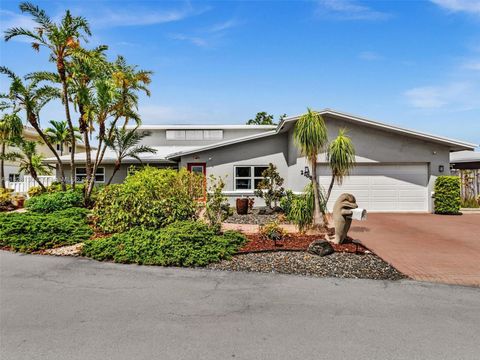
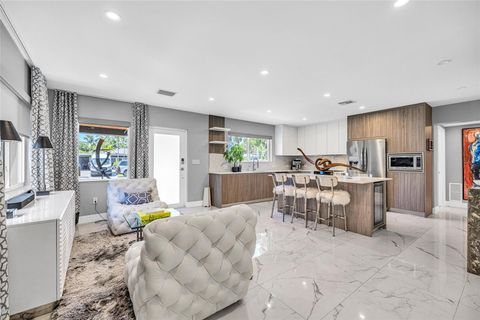
Active
$1,550,000
4
bds
|
3
ba
|
1,978
sqft
|
built
1954
1719 Poinsettia Dr, Fort Lauderdale, FL 33305
$-5,354
Cash flow
-18.0%
Cash-on-Cash Return
2.0%
Cap rate
0.4%
Rent to Value Ratio
Active
$1,240,000
3
bds
|
2
ba
|
1,958
sqft
|
built
1953
2508 NE 27th Ave, Fort Lauderdale, FL 33305
$-3,793
Cash flow
-16.0%
Cash-on-Cash Return
2.5%
Cap rate
0.4%
Rent to Value Ratio
Active
$4,999,000
4
bds
|
5
ba
|
3,500
sqft
|
built
2018
2200 N Ocean Blvd, Fort Lauderdale, FL 33305
$-31,340
Cash flow
-32.7%
Cash-on-Cash Return
-1.4%
Cap rate
0.2%
Rent to Value Ratio
Active
$988,500
3
bds
|
3
ba
|
1,686
sqft
|
built
2005
2001 N Ocean Blvd, Fort Lauderdale, FL 33305
$-4,815
Cash flow
-25.4%
Cash-on-Cash Return
0.3%
Cap rate
0.5%
Rent to Value Ratio
Active
$389,000
2
bds
|
3
ba
|
1,369
sqft
|
built
1986
2300 NE 33rd Ave, Fort Lauderdale, FL 33305
$-1,088
Cash flow
-14.6%
Cash-on-Cash Return
2.8%
Cap rate
0.9%
Rent to Value Ratio
Active
$299,000
1
bds
|
2
ba
|
1,103
sqft
|
built
1971
2200 NE 33rd Ave, Fort Lauderdale, FL 33305
$-944
Cash flow
-16.5%
Cash-on-Cash Return
2.4%
Cap rate
0.8%
Rent to Value Ratio
Active
$795,000
bds
|
0
ba
|
1,707
sqft
|
built
1957
1000 NE 17th Ct, Fort Lauderdale, FL 33305
$-3,448
Cash flow
-22.6%
Cash-on-Cash Return
0.9%
Cap rate
0.3%
Rent to Value Ratio
Active
$365,000
2
bds
|
3
ba
|
1,316
sqft
|
built
1986
2300 NE 33rd Ave, Fort Lauderdale, FL 33305
$-1,528
Cash flow
-21.8%
Cash-on-Cash Return
1.1%
Cap rate
0.8%
Rent to Value Ratio
Active
$265,000
1
bds
|
1
ba
|
600
sqft
|
built
1972
2404 NE 33rd Ave, Fort Lauderdale, FL 33305
$-1,116
Cash flow
-22.0%
Cash-on-Cash Return
1.1%
Cap rate
0.7%
Rent to Value Ratio
Active
$295,000
2
bds
|
2
ba
|
850
sqft
|
built
1968
2400 NE 33rd Ave, Fort Lauderdale, FL 33305
$-726
Cash flow
-12.8%
Cash-on-Cash Return
3.2%
Cap rate
0.8%
Rent to Value Ratio
Active
$330,000
2
bds
|
2
ba
|
1,180
sqft
|
built
1973
300 NE 19th Ct, Wilton Manors, FL 33305
$-1,061
Cash flow
-16.8%
Cash-on-Cash Return
2.3%
Cap rate
0.8%
Rent to Value Ratio
Active
$1,100,000
3
bds
|
3
ba
|
2,229
sqft
|
built
1957
2213 NE 17th Ave, Wilton Manors, FL 33305
$-2,138
Cash flow
-10.1%
Cash-on-Cash Return
3.8%
Cap rate
0.5%
Rent to Value Ratio
Active
$4,500,000
5
bds
|
7
ba
|
5,265
sqft
|
built
1999
2120 N Ocean Blvd, Fort Lauderdale, FL 33305
$-29,540
Cash flow
-34.2%
Cash-on-Cash Return
-1.7%
Cap rate
0.2%
Rent to Value Ratio
Active
$300,000
2
bds
|
2
ba
|
1,425
sqft
|
built
1971
2200 NE 33rd Ave, Fort Lauderdale, FL 33305
$-1,381
Cash flow
-24.0%
Cash-on-Cash Return
0.6%
Cap rate
0.8%
Rent to Value Ratio
Active
$429,990
2
bds
|
2
ba
|
1,350
sqft
|
built
1986
2300 NE 33rd Ave, Fort Lauderdale, FL 33305
$-1,879
Cash flow
-22.8%
Cash-on-Cash Return
0.9%
Cap rate
0.7%
Rent to Value Ratio
Active
$5,695,000
5
bds
|
6
ba
|
5,289
sqft
|
built
2019
2746 NE 18th St, Fort Lauderdale, FL 33305
$-27,567
Cash flow
-25.3%
Cash-on-Cash Return
0.3%
Cap rate
0.2%
Rent to Value Ratio
Active
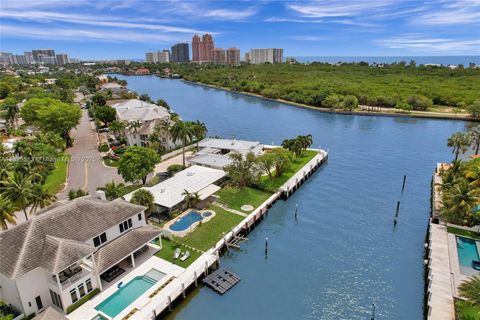
$3,650,000
3
bds
|
2
ba
|
0
sqft
|
built
1956
2019 NE 31st Ave, Fort Lauderdale, FL 33305
$-14,288
Cash flow
-20.4%
Cash-on-Cash Return
1.4%
Cap rate
0.2%
Rent to Value Ratio
Active
$1,600,000
3
bds
|
4
ba
|
2,450
sqft
|
built
2021
2514 NE 21st St, Fort Lauderdale, FL 33305
$-3,896
Cash flow
-12.7%
Cash-on-Cash Return
3.2%
Cap rate
0.6%
Rent to Value Ratio
Active
$399,000
2
bds
|
1
ba
|
824
sqft
|
built
1951
1602 NE 1st Ave, Fort Lauderdale, FL 33305
$-1,179
Cash flow
-15.4%
Cash-on-Cash Return
2.6%
Cap rate
0.5%
Rent to Value Ratio
Active
$775,000
3
bds
|
3
ba
|
1,580
sqft
|
built
2020
625 NE 22nd Dr, Wilton Manors, FL 33305
$-3,022
Cash flow
-20.3%
Cash-on-Cash Return
1.5%
Cap rate
0.5%
Rent to Value Ratio