33306 Investment Properties for Sale
Browse homes for sale and investment properties in 33306. Refine your search by price, property type, or more.
Best cash flowing properties in 33306
Active
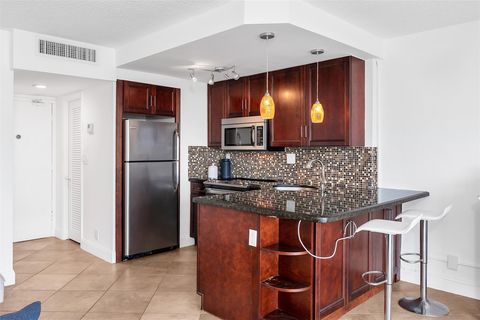
$199,700
0
bds
|
1
ba
|
440
sqft
|
built
1964
2900 NE 30th St, Fort Lauderdale, FL 33306
$-199
Cash flow
-5.2%
Cash-on-Cash Return
5.0%
Cap rate
1.1%
Rent to Value Ratio
Active
$185,000
1
bds
|
1
ba
|
588
sqft
|
built
1966
1812 E Oakland Park Blvd, Oakland Park, FL 33306
$-433
Cash flow
-12.2%
Cash-on-Cash Return
3.3%
Cap rate
0.8%
Rent to Value Ratio
34 out of 47 properties for sale in 33306
Limited Results Shown
Create a free account, or log in to reveal all property listings and enjoy the complete experience.
Active
$5,590,000
3
bds
|
3
ba
|
2,690
sqft
|
built
2017
2815 NE 26th Pl, Fort Lauderdale, FL 33306
$-26,770
Cash flow
-25.0%
Cash-on-Cash Return
0.4%
Cap rate
0.1%
Rent to Value Ratio
Active
$529,000
2
bds
|
2
ba
|
1,120
sqft
|
built
1960
2895 NE 32nd St, Fort Lauderdale, FL 33306
$-1,911
Cash flow
-18.8%
Cash-on-Cash Return
1.8%
Cap rate
0.6%
Rent to Value Ratio
Active
$1,249,000
2
bds
|
3
ba
|
2,429
sqft
|
built
1952
2740 NE 34th St, Fort Lauderdale, FL 33306
$-2,579
Cash flow
-10.8%
Cash-on-Cash Return
3.7%
Cap rate
0.5%
Rent to Value Ratio
Active
$1,299,000
bds
|
0
ba
|
2,903
sqft
|
built
1965
3200 NE 27th Ave, Fort Lauderdale, FL 33306
$-5,749
Cash flow
-23.1%
Cash-on-Cash Return
0.8%
Cap rate
0.2%
Rent to Value Ratio
Active
$549,000
1
bds
|
1
ba
|
747
sqft
|
built
1960
2895 NE 32nd St, Fort Lauderdale, FL 33306
$-699
Cash flow
-6.6%
Cash-on-Cash Return
4.6%
Cap rate
0.7%
Rent to Value Ratio
Active
$365,000
2
bds
|
2
ba
|
870
sqft
|
built
1978
2801 NE 33rd Ct, Fort Lauderdale, FL 33306
$-751
Cash flow
-10.7%
Cash-on-Cash Return
3.7%
Cap rate
0.8%
Rent to Value Ratio
Active
$460,000
1
bds
|
1
ba
|
747
sqft
|
built
1960
2881 NE 32nd St, Fort Lauderdale, FL 33306
$-1,753
Cash flow
-19.9%
Cash-on-Cash Return
1.6%
Cap rate
0.5%
Rent to Value Ratio
Active
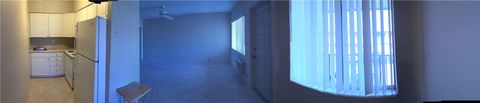
$295,000
1
bds
|
1
ba
|
730
sqft
|
built
1964
2900 NE 30th St, Fort Lauderdale, FL 33306
$-1,183
Cash flow
-20.9%
Cash-on-Cash Return
1.3%
Cap rate
0.8%
Rent to Value Ratio
Active
$276,000
1
bds
|
1
ba
|
750
sqft
|
built
1970
2881 NE 33rd Ct, Fort Lauderdale, FL 33306
$-1,048
Cash flow
-19.8%
Cash-on-Cash Return
1.6%
Cap rate
0.8%
Rent to Value Ratio
Active
$325,000
2
bds
|
2
ba
|
960
sqft
|
built
1963
2841 NE 33rd Ct, Fort Lauderdale, FL 33306
$-818
Cash flow
-13.1%
Cash-on-Cash Return
3.1%
Cap rate
0.8%
Rent to Value Ratio
Active
$397,000
2
bds
|
2
ba
|
848
sqft
|
built
1960
2824 NE 33rd Ct, Fort Lauderdale, FL 33306
$-1,230
Cash flow
-16.2%
Cash-on-Cash Return
2.4%
Cap rate
0.6%
Rent to Value Ratio
Active
$5,000,000
5
bds
|
5
ba
|
5,046
sqft
|
built
2000
2890 NE 27th St, Fort Lauderdale, FL 33306
$-20,731
Cash flow
-21.6%
Cash-on-Cash Return
1.2%
Cap rate
0.2%
Rent to Value Ratio
Active
$815,000
3
bds
|
2
ba
|
1,752
sqft
|
built
1957
1866 NE 33rd St, Oakland Park, FL 33306
$-1,975
Cash flow
-12.6%
Cash-on-Cash Return
3.2%
Cap rate
0.5%
Rent to Value Ratio
Active
$785,000
3
bds
|
2
ba
|
1,683
sqft
|
built
1955
3497 NE 19th Ave, Oakland Park, FL 33306
$-2,641
Cash flow
-17.6%
Cash-on-Cash Return
2.1%
Cap rate
0.5%
Rent to Value Ratio
Active
$1,045,000
2
bds
|
2
ba
|
1,189
sqft
|
built
1954
2807 Coral Shores Dr, Fort Lauderdale, FL 33306
$-2,489
Cash flow
-12.4%
Cash-on-Cash Return
3.3%
Cap rate
0.6%
Rent to Value Ratio
Active
$2,390,000
4
bds
|
4
ba
|
2,882
sqft
|
built
1957
2908 Bayview Dr, Fort Lauderdale, FL 33306
$-8,152
Cash flow
-17.8%
Cash-on-Cash Return
2.1%
Cap rate
0.4%
Rent to Value Ratio
Active
$333,000
1
bds
|
1
ba
|
747
sqft
|
built
1960
2881 NE 32nd St, Fort Lauderdale, FL 33306
$-1,172
Cash flow
-18.4%
Cash-on-Cash Return
1.9%
Cap rate
0.6%
Rent to Value Ratio
Active
$824,950
3
bds
|
2
ba
|
1,587
sqft
|
built
1956
3488 NE 19th Ave, Oakland Park, FL 33306
$-1,998
Cash flow
-12.6%
Cash-on-Cash Return
3.2%
Cap rate
0.6%
Rent to Value Ratio
Active
$879,950
3
bds
|
2
ba
|
1,473
sqft
|
built
1957
3464 NE 19th Ave, Oakland Park, FL 33306
$-1,880
Cash flow
-11.1%
Cash-on-Cash Return
3.6%
Cap rate
0.7%
Rent to Value Ratio
Active
$1,750,000
3
bds
|
3
ba
|
3,122
sqft
|
built
1960
2601 NE 27th Ter, Fort Lauderdale, FL 33306
$-4,291
Cash flow
-12.8%
Cash-on-Cash Return
3.2%
Cap rate
0.5%
Rent to Value Ratio
Active
$1,349,000
4
bds
|
3
ba
|
2,591
sqft
|
built
1955
2709 NE 30th St, Fort Lauderdale, FL 33306
$-2,947
Cash flow
-11.4%
Cash-on-Cash Return
3.5%
Cap rate
0.6%
Rent to Value Ratio
Active
$895,000
4
bds
|
3
ba
|
1,742
sqft
|
built
1954
3345 NE 20th Ave, Oakland Park, FL 33306
$-2,574
Cash flow
-15.0%
Cash-on-Cash Return
2.7%
Cap rate
0.5%
Rent to Value Ratio
Active
$979,000
3
bds
|
3
ba
|
1,727
sqft
|
built
1953
2000 NE 26th Dr, Wilton Manors, FL 33306
$-1,963
Cash flow
-10.5%
Cash-on-Cash Return
3.7%
Cap rate
0.6%
Rent to Value Ratio
Active
$425,000
2
bds
|
2
ba
|
1,250
sqft
|
built
1970
2881 NE 33rd Ct, Fort Lauderdale, FL 33306
$-1,826
Cash flow
-22.4%
Cash-on-Cash Return
1.0%
Cap rate
0.7%
Rent to Value Ratio
Active
$739,000
3
bds
|
2
ba
|
1,384
sqft
|
built
1955
2113 NE 29th Ct, Fort Lauderdale, FL 33306
$-1,359
Cash flow
-9.6%
Cash-on-Cash Return
3.9%
Cap rate
0.5%
Rent to Value Ratio
Active
$849,900
3
bds
|
2
ba
|
1,481
sqft
|
built
1954
2936 Coral Shores Dr, Fort Lauderdale, FL 33306
$-1,598
Cash flow
-9.8%
Cash-on-Cash Return
3.9%
Cap rate
0.5%
Rent to Value Ratio

Active
$250,000
2
bds
|
2
ba
|
916
sqft
|
built
1962
2864 NE 32nd St, Fort Lauderdale, FL 33306
$-521
Cash flow
-10.9%
Cash-on-Cash Return
3.6%
Cap rate
1.0%
Rent to Value Ratio
Active
$1,595,000
4
bds
|
2
ba
|
2,032
sqft
|
built
1957
1981 Coral Gardens Dr, Wilton Manors, FL 33306
$-6,215
Cash flow
-20.3%
Cash-on-Cash Return
1.5%
Cap rate
0.3%
Rent to Value Ratio

Active
$1,998,000
3
bds
|
4
ba
|
2,126
sqft
|
built
2018
2895 NE 33rd Ct, Fort Lauderdale, FL 33306
$-7,644
Cash flow
-20.0%
Cash-on-Cash Return
1.6%
Cap rate
0.5%
Rent to Value Ratio
Active
$249,000
1
bds
|
1
ba
|
530
sqft
|
built
1961
2841 NE 32nd St, Fort Lauderdale, FL 33306
$-499
Cash flow
-10.5%
Cash-on-Cash Return
3.7%
Cap rate
0.8%
Rent to Value Ratio
Active
$4,995,000
6
bds
|
8
ba
|
5,771
sqft
|
built
1957
2817 NE 26th Ct, Fort Lauderdale, FL 33306
$-23,108
Cash flow
-24.1%
Cash-on-Cash Return
0.6%
Cap rate
0.2%
Rent to Value Ratio

Active
$799,000
3
bds
|
2
ba
|
1,829
sqft
|
built
1953
2725 NE 21st Ave, Fort Lauderdale, FL 33306
$-2,202
Cash flow
-14.4%
Cash-on-Cash Return
2.8%
Cap rate
0.6%
Rent to Value Ratio