33313 Investment Properties for Sale
Browse homes for sale and investment properties in 33313. Refine your search by price, property type, or more.
Best cash flowing properties in 33313

Active
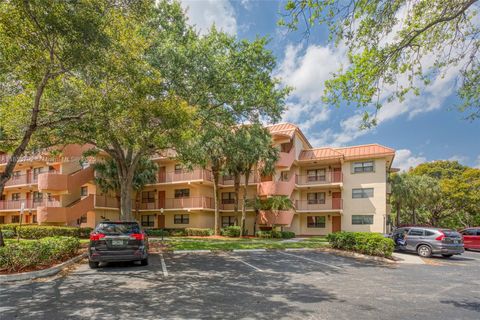
$100,000
2
bds
|
2
ba
|
975
sqft
|
built
1977
2401 NW 41st Ave, Lauderhill, FL 33313
$264
Cash flow
13.8%
Cash-on-Cash Return
9.3%
Cap rate
1.8%
Rent to Value Ratio
Active
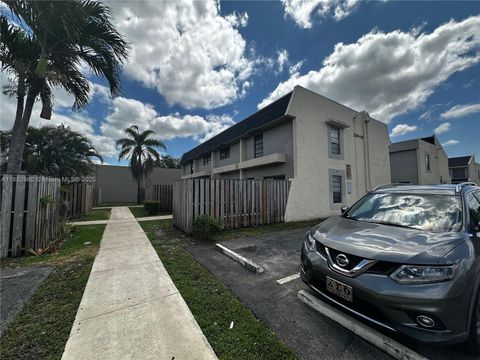
$132,000
2
bds
|
2
ba
|
1,150
sqft
|
built
1973
2075 NW 46th Ave, Lauderhill, FL 33313
$119
Cash flow
4.7%
Cash-on-Cash Return
7.2%
Cap rate
1.4%
Rent to Value Ratio
159 out of 179 properties for sale in 33313
Limited Results Shown
Create a free account, or log in to reveal all property listings and enjoy the complete experience.
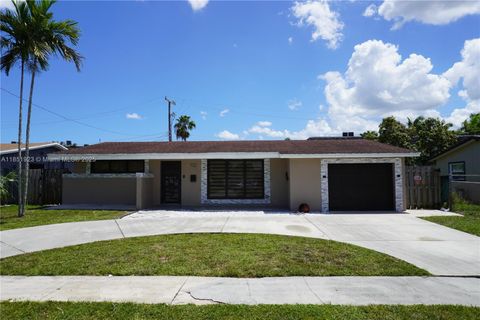
Active
$135,000
2
bds
|
2
ba
|
1,036
sqft
|
built
1969
5495 NW 10th Ct, Plantation, FL 33313
$10
Cash flow
0.4%
Cash-on-Cash Return
6.2%
Cap rate
1.5%
Rent to Value Ratio
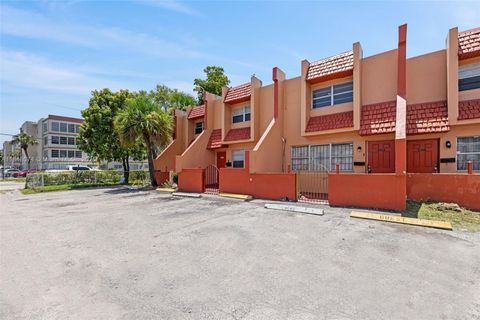
Active
$525,000
4
bds
|
4
ba
|
1,801
sqft
|
built
1970
4921 NW 23rd St, Lauderhill, FL 33313
$-1,970
Cash flow
-19.6%
Cash-on-Cash Return
1.6%
Cap rate
0.4%
Rent to Value Ratio
Active
$439,900
2
bds
|
2
ba
|
1,320
sqft
|
built
1999
7401 S Aragon Blvd, Sunrise, FL 33313
$-1,004
Cash flow
-11.9%
Cash-on-Cash Return
3.4%
Cap rate
0.6%
Rent to Value Ratio
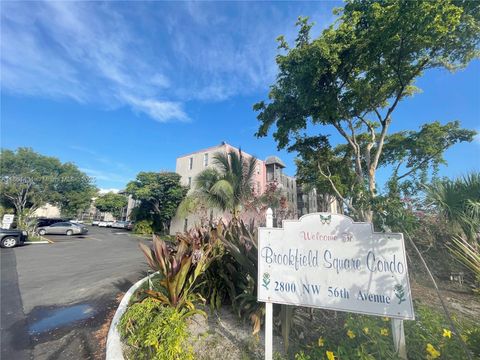
Active
$117,000
1
bds
|
1
ba
|
735
sqft
|
built
1973
2800 NW 56th Ave, Lauderhill, FL 33313
$-50
Cash flow
-2.2%
Cash-on-Cash Return
5.6%
Cap rate
1.4%
Rent to Value Ratio

Active
$649,000
4
bds
|
2
ba
|
1,724
sqft
|
built
1972
7410 NW 13th Ct, Plantation, FL 33313
$-1,340
Cash flow
-10.8%
Cash-on-Cash Return
3.7%
Cap rate
0.6%
Rent to Value Ratio

Active
$399,000
2
bds
|
2
ba
|
1,262
sqft
|
built
1964
2600 NW 43rd Ave, Lauderhill, FL 33313
$-827
Cash flow
-10.8%
Cash-on-Cash Return
3.7%
Cap rate
0.6%
Rent to Value Ratio

Active
$160,000
2
bds
|
2
ba
|
950
sqft
|
built
1973
2017 NW 46th Ave, Lauderhill, FL 33313
$-244
Cash flow
-8.0%
Cash-on-Cash Return
4.3%
Cap rate
1.3%
Rent to Value Ratio
Active
$495,000
5
bds
|
3
ba
|
2,180
sqft
|
built
1961
4900 NW 15th St, Lauderhill, FL 33313
$-1,104
Cash flow
-11.6%
Cash-on-Cash Return
3.5%
Cap rate
0.6%
Rent to Value Ratio

Active
$659,000
4
bds
|
2
ba
|
1,774
sqft
|
built
1967
7041 NW 11th Pl, Plantation, FL 33313
$-1,347
Cash flow
-10.7%
Cash-on-Cash Return
3.7%
Cap rate
0.5%
Rent to Value Ratio

Active
$175,000
2
bds
|
2
ba
|
1,070
sqft
|
built
1973
2922 NW 55th Ave, Lauderhill, FL 33313
$-578
Cash flow
-17.2%
Cash-on-Cash Return
2.2%
Cap rate
1.0%
Rent to Value Ratio
Active
$490,000
4
bds
|
2
ba
|
1,801
sqft
|
built
1965
2651 NW 42nd Ave, Lauderhill, FL 33313
$-544
Cash flow
-5.8%
Cash-on-Cash Return
4.8%
Cap rate
0.6%
Rent to Value Ratio
Active
$125,000
2
bds
|
2
ba
|
815
sqft
|
built
1969
4043 NW 16th St, Lauderhill, FL 33313
$69
Cash flow
2.9%
Cash-on-Cash Return
6.8%
Cap rate
1.4%
Rent to Value Ratio

Active
$150,000
2
bds
|
2
ba
|
975
sqft
|
built
1974
2251 NW 41st Ave, Lauderhill, FL 33313
$19
Cash flow
0.7%
Cash-on-Cash Return
6.3%
Cap rate
1.2%
Rent to Value Ratio
Active
$440,000
3
bds
|
2
ba
|
1,360
sqft
|
built
1969
7481 Sunset Strip, Sunrise, FL 33313
$-255
Cash flow
-3.0%
Cash-on-Cash Return
5.5%
Cap rate
0.7%
Rent to Value Ratio
Active
$209,900
3
bds
|
2
ba
|
1,080
sqft
|
built
1973
5978 NW 21st St, Lauderhill, FL 33313
$-410
Cash flow
-10.2%
Cash-on-Cash Return
3.8%
Cap rate
1.2%
Rent to Value Ratio
Active
$549,000
5
bds
|
2
ba
|
1,550
sqft
|
built
1966
6861 NW 24th St, Sunrise, FL 33313
$-1,371
Cash flow
-13.0%
Cash-on-Cash Return
3.1%
Cap rate
0.5%
Rent to Value Ratio
Active
$198,000
1
bds
|
2
ba
|
960
sqft
|
built
1975
7300 NW 17th St, Plantation, FL 33313
$-664
Cash flow
-17.5%
Cash-on-Cash Return
2.1%
Cap rate
0.8%
Rent to Value Ratio
Active
$150,000
1
bds
|
2
ba
|
760
sqft
|
built
1994
7401 NW 16th St, Plantation, FL 33313
$-121
Cash flow
-4.2%
Cash-on-Cash Return
5.2%
Cap rate
1.2%
Rent to Value Ratio

Active
$389,990
3
bds
|
2
ba
|
1,371
sqft
|
built
1967
4210 NW 23rd St, Lauderhill, FL 33313
$-714
Cash flow
-9.6%
Cash-on-Cash Return
4.0%
Cap rate
0.8%
Rent to Value Ratio
Active
$190,000
2
bds
|
2
ba
|
1,020
sqft
|
built
1980
2300 NW 52nd Ave, Lauderhill, FL 33313
$-506
Cash flow
-13.9%
Cash-on-Cash Return
2.9%
Cap rate
1.0%
Rent to Value Ratio
Active
$475,000
2
bds
|
2
ba
|
1,197
sqft
|
built
1967
7140 NW 24th St, Sunrise, FL 33313
$-1,151
Cash flow
-12.6%
Cash-on-Cash Return
3.2%
Cap rate
0.6%
Rent to Value Ratio

Active
$125,000
1
bds
|
1
ba
|
755
sqft
|
built
1980
2551 NW 41st Ave, Lauderhill, FL 33313
$-86
Cash flow
-3.6%
Cash-on-Cash Return
5.3%
Cap rate
1.3%
Rent to Value Ratio

Active
$115,000
1
bds
|
1
ba
|
735
sqft
|
built
1973
2800 NW 56th Ave, Lauderhill, FL 33313
$-182
Cash flow
-8.3%
Cash-on-Cash Return
4.2%
Cap rate
1.2%
Rent to Value Ratio

Active
$449,900
3
bds
|
2
ba
|
1,832
sqft
|
built
1968
1420 NW 56th Ave, Lauderhill, FL 33313
$-384
Cash flow
-4.5%
Cash-on-Cash Return
5.1%
Cap rate
0.8%
Rent to Value Ratio
Active
$149,000
2
bds
|
2
ba
|
1,096
sqft
|
built
1974
4045 NW 19th St, Lauderhill, FL 33313
$-21
Cash flow
-0.7%
Cash-on-Cash Return
6.0%
Cap rate
1.3%
Rent to Value Ratio
Active
$499,000
3
bds
|
2
ba
|
1,082
sqft
|
built
1969
2180 NW 74th Ave, Sunrise, FL 33313
$-942
Cash flow
-9.8%
Cash-on-Cash Return
3.9%
Cap rate
0.5%
Rent to Value Ratio
Active
$450,000
3
bds
|
2
ba
|
1,005
sqft
|
built
1960
6220 NW 12th Ct, Sunrise, FL 33313
$-902
Cash flow
-10.5%
Cash-on-Cash Return
3.7%
Cap rate
0.6%
Rent to Value Ratio

Active
$375,000
3
bds
|
2
ba
|
1,480
sqft
|
built
1961
6270 NW 12th Ct, Sunrise, FL 33313
$-452
Cash flow
-6.3%
Cash-on-Cash Return
4.7%
Cap rate
0.8%
Rent to Value Ratio

Active
$150,000
1
bds
|
1
ba
|
850
sqft
|
built
1974
4848 NW 24th Ct, Lauderdale Lakes, FL 33313
$-32
Cash flow
-1.1%
Cash-on-Cash Return
5.9%
Cap rate
1.1%
Rent to Value Ratio
Active
$139,900
2
bds
|
2
ba
|
870
sqft
|
built
1969
4441 NW 16th St, Lauderhill, FL 33313
$84
Cash flow
3.1%
Cash-on-Cash Return
6.9%
Cap rate
1.4%
Rent to Value Ratio
Active
$450,000
3
bds
|
2
ba
|
1,696
sqft
|
built
1968
7040 NW 21st Ct, Sunrise, FL 33313
$-436
Cash flow
-5.1%
Cash-on-Cash Return
5.0%
Cap rate
0.8%
Rent to Value Ratio
Active
$165,000
1
bds
|
2
ba
|
960
sqft
|
built
1975
7300 NW 17th St, Plantation, FL 33313
$-508
Cash flow
-16.1%
Cash-on-Cash Return
2.5%
Cap rate
1.0%
Rent to Value Ratio
Active
$89,999
1
bds
|
1
ba
|
735
sqft
|
built
1973
4042 NW 19th St, Lauderhill, FL 33313
$49
Cash flow
2.8%
Cash-on-Cash Return
6.8%
Cap rate
1.7%
Rent to Value Ratio
Active
$399,900
3
bds
|
2
ba
|
1,028
sqft
|
built
1968
4331 NW 27th St, Lauderhill, FL 33313
$-868
Cash flow
-11.3%
Cash-on-Cash Return
3.5%
Cap rate
0.6%
Rent to Value Ratio
Active
$170,000
1
bds
|
2
ba
|
800
sqft
|
built
1975
4240 NW 21st St, Lauderhill, FL 33313
$-353
Cash flow
-10.8%
Cash-on-Cash Return
3.7%
Cap rate
0.9%
Rent to Value Ratio
Active
$412,000
3
bds
|
3
ba
|
1,496
sqft
|
built
2020
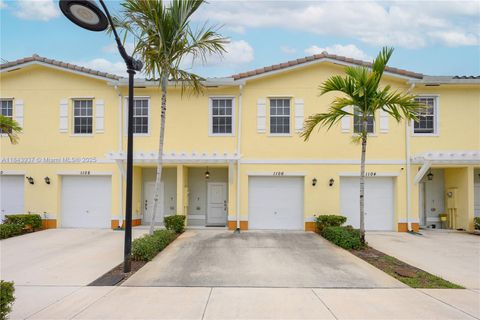
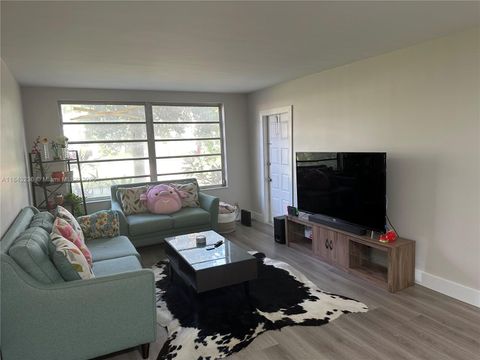
1106 NW 40th Ave, Lauderhill, FL 33313
$-726
Cash flow
-9.2%
Cash-on-Cash Return
4.0%
Cap rate
0.8%
Rent to Value Ratio

Active
$450,000
2
bds
|
1
ba
|
962
sqft
|
built
1963
6521 NW 21st St, Sunrise, FL 33313
$-1,056
Cash flow
-12.2%
Cash-on-Cash Return
3.3%
Cap rate
0.6%
Rent to Value Ratio
Active
$235,000
2
bds
|
2
ba
|
952
sqft
|
built
1978
7500 NW 17th St, Plantation, FL 33313
$-496
Cash flow
-11.0%
Cash-on-Cash Return
3.6%
Cap rate
0.8%
Rent to Value Ratio