33326 Investment Properties for Sale
Browse homes for sale and investment properties in 33326. Refine your search by price, property type, or more.
Best cash flowing properties in 33326
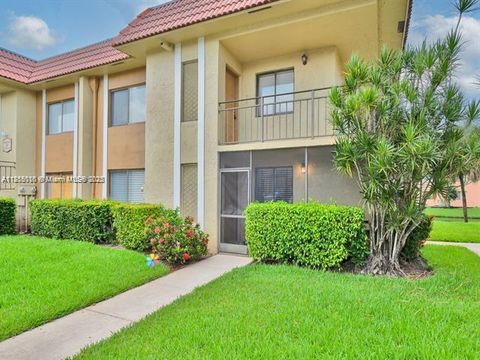
Active
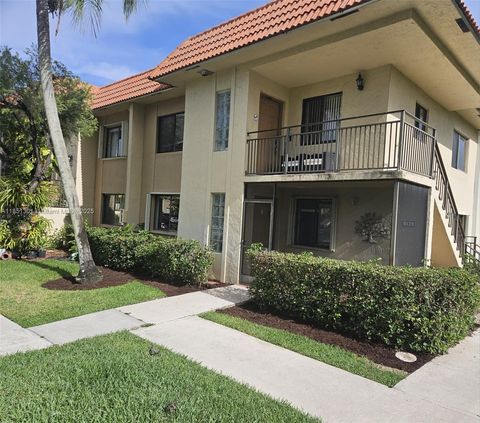
$298,000
2
bds
|
3
ba
|
1,235
sqft
|
built
1980
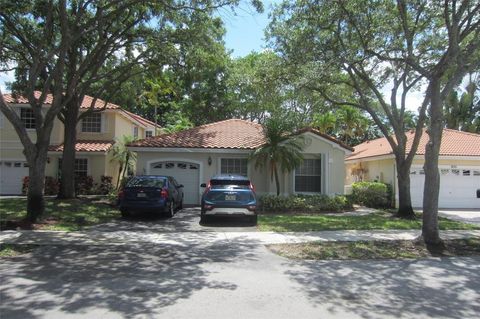
16325 Golf Club Rd, Weston, FL 33326
$-567
Cash flow
-9.9%
Cash-on-Cash Return
3.9%
Cap rate
0.8%
Rent to Value Ratio
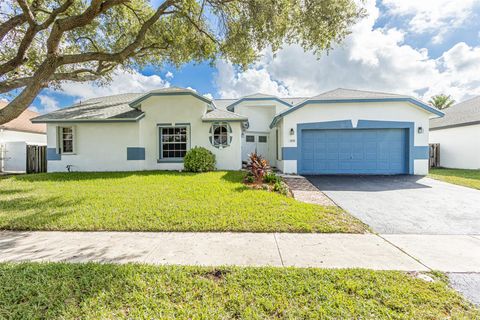
Active
$329,900
2
bds
|
2
ba
|
1,256
sqft
|
built
1980
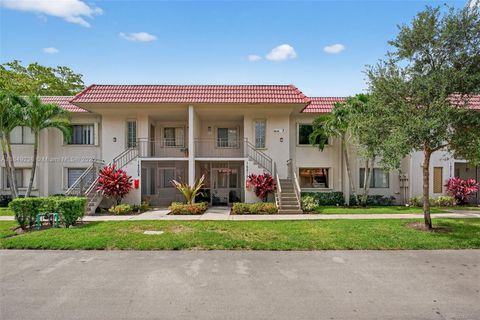
302 Lakeview Dr, Weston, FL 33326
$-659
Cash flow
-10.4%
Cash-on-Cash Return
3.8%
Cap rate
0.8%
Rent to Value Ratio
123 out of 138 properties for sale in 33326
Limited Results Shown
Create a free account, or log in to reveal all property listings and enjoy the complete experience.
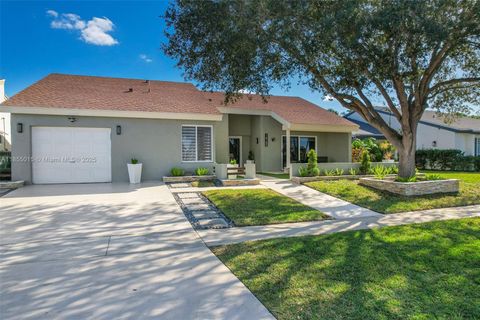
Active
$415,000
2
bds
|
2
ba
|
1,536
sqft
|
built
1981
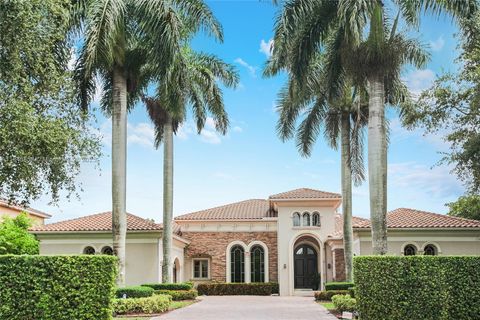
37 Lakeside Cir, Sunrise, FL 33326
$-818
Cash flow
-10.3%
Cash-on-Cash Return
3.8%
Cap rate
0.7%
Rent to Value Ratio
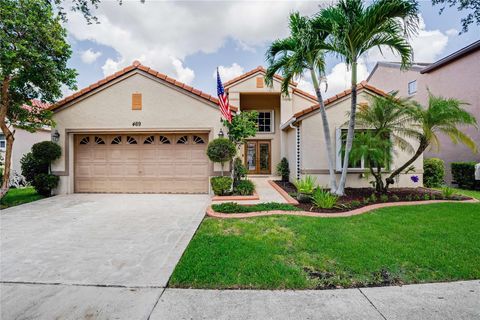
Active
$729,000
3
bds
|
3
ba
|
2,328
sqft
|
built
1982
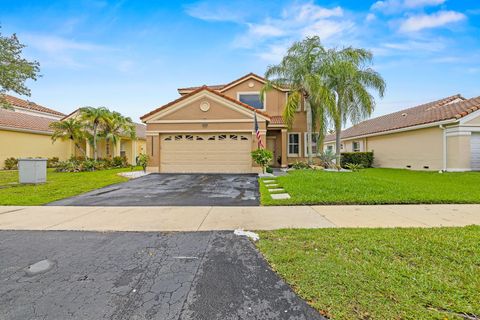
16796 Royal Poinciana Dr, Weston, FL 33326
$-1,002
Cash flow
-7.2%
Cash-on-Cash Return
4.5%
Cap rate
0.8%
Rent to Value Ratio
Active
$480,000
3
bds
|
2
ba
|
1,160
sqft
|
built
1989
15737 Woodgate Ct, Sunrise, FL 33326
$-1,157
Cash flow
-12.6%
Cash-on-Cash Return
3.3%
Cap rate
0.6%
Rent to Value Ratio
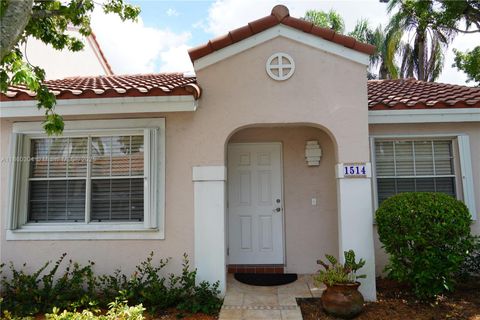
Active
$425,000
2
bds
|
2
ba
|
893
sqft
|
built
1987
1514 Springside Dr, Weston, FL 33326
$-1,071
Cash flow
-13.1%
Cash-on-Cash Return
3.1%
Cap rate
0.6%
Rent to Value Ratio

Active
$345,000
2
bds
|
2
ba
|
1,256
sqft
|
built
1979
195 Lakeview Dr, Weston, FL 33326
$-814
Cash flow
-12.3%
Cash-on-Cash Return
3.3%
Cap rate
0.7%
Rent to Value Ratio
Active
$324,999
2
bds
|
3
ba
|
1,235
sqft
|
built
1980
16475 Golf Club Rd, Weston, FL 33326
$-1,020
Cash flow
-16.4%
Cash-on-Cash Return
2.4%
Cap rate
0.8%
Rent to Value Ratio
Active
$1,200,000
4
bds
|
3
ba
|
2,394
sqft
|
built
1990
1154 Laguna Springs Dr, Weston, FL 33326
$-3,584
Cash flow
-15.6%
Cash-on-Cash Return
2.6%
Cap rate
0.4%
Rent to Value Ratio
Active
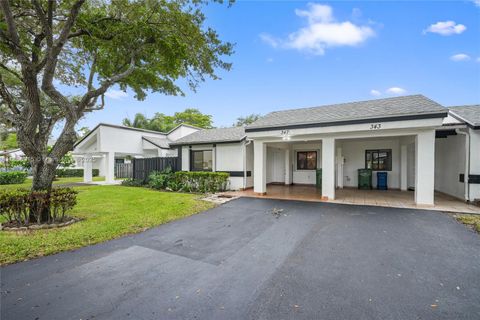
$425,000
3
bds
|
2
ba
|
1,500
sqft
|
built
1980
347 Fairway Cir, Weston, FL 33326
$-962
Cash flow
-11.8%
Cash-on-Cash Return
3.4%
Cap rate
0.8%
Rent to Value Ratio
Active
$975,000
4
bds
|
3
ba
|
2,476
sqft
|
built
1993
720 Verona Lake Dr, Weston, FL 33326
$-2,273
Cash flow
-12.2%
Cash-on-Cash Return
3.3%
Cap rate
0.5%
Rent to Value Ratio

Active
$425,000
2
bds
|
3
ba
|
1,110
sqft
|
built
1994
16731 Hemingway Dr, Weston, FL 33326
$-1,223
Cash flow
-15.0%
Cash-on-Cash Return
2.7%
Cap rate
0.6%
Rent to Value Ratio
Active
$819,999
5
bds
|
4
ba
|
2,466
sqft
|
built
1995
161 Granada Ave, Weston, FL 33326
$-1,698
Cash flow
-10.8%
Cash-on-Cash Return
3.7%
Cap rate
0.5%
Rent to Value Ratio
Active
$839,000
4
bds
|
3
ba
|
2,322
sqft
|
built
1992
372 Cameron Dr, Weston, FL 33326
$-1,865
Cash flow
-11.6%
Cash-on-Cash Return
3.5%
Cap rate
0.5%
Rent to Value Ratio
Active
$289,900
2
bds
|
2
ba
|
1,231
sqft
|
built
1979
305 Lakeview Dr, Weston, FL 33326
$-765
Cash flow
-13.8%
Cash-on-Cash Return
3.0%
Cap rate
0.9%
Rent to Value Ratio
Active
$735,000
4
bds
|
3
ba
|
2,007
sqft
|
built
1990
1020 SW 149th Ln, Sunrise, FL 33326
$-1,347
Cash flow
-9.6%
Cash-on-Cash Return
3.9%
Cap rate
0.5%
Rent to Value Ratio
Active
$768,000
4
bds
|
3
ba
|
2,071
sqft
|
built
1982
16780 Redwood Way, Weston, FL 33326
$-972
Cash flow
-6.6%
Cash-on-Cash Return
4.6%
Cap rate
0.7%
Rent to Value Ratio
Active
$845,000
3
bds
|
3
ba
|
2,246
sqft
|
built
1995
469 Cambridge Ln, Weston, FL 33326
$-2,076
Cash flow
-12.8%
Cash-on-Cash Return
3.2%
Cap rate
0.5%
Rent to Value Ratio
Active
$1,330,000
5
bds
|
4
ba
|
2,607
sqft
|
built
1991
765 Bayside Ln, Weston, FL 33326
$-2,323
Cash flow
-9.1%
Cash-on-Cash Return
4.1%
Cap rate
0.7%
Rent to Value Ratio
Active
$319,900
2
bds
|
2
ba
|
1,231
sqft
|
built
1980
302 Lakeview Dr, Weston, FL 33326
$-808
Cash flow
-13.2%
Cash-on-Cash Return
3.1%
Cap rate
0.8%
Rent to Value Ratio
Active
$325,000
2
bds
|
3
ba
|
1,235
sqft
|
built
1980
16251 Golf Club Rd, Weston, FL 33326
$-936
Cash flow
-15.0%
Cash-on-Cash Return
2.7%
Cap rate
0.8%
Rent to Value Ratio
Active
$830,000
3
bds
|
2
ba
|
1,894
sqft
|
built
1989
1075 San Luis Rey, Weston, FL 33326
$-2,517
Cash flow
-15.8%
Cash-on-Cash Return
2.5%
Cap rate
0.5%
Rent to Value Ratio
Active
$309,000
2
bds
|
2
ba
|
1,231
sqft
|
built
1980
366 Lakeview Dr, Weston, FL 33326
$-1,011
Cash flow
-17.1%
Cash-on-Cash Return
2.2%
Cap rate
0.8%
Rent to Value Ratio
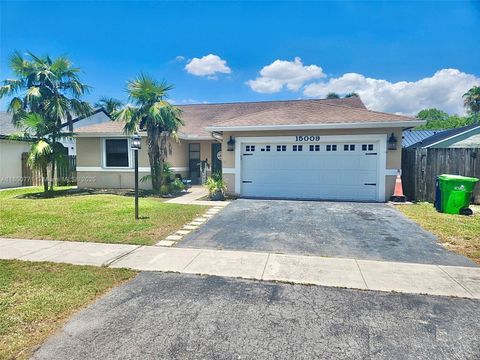
Active
$640,000
3
bds
|
2
ba
|
1,804
sqft
|
built
1988
15009 SW 13th Pl, Sunrise, FL 33326
$-1,428
Cash flow
-11.6%
Cash-on-Cash Return
3.5%
Cap rate
0.6%
Rent to Value Ratio
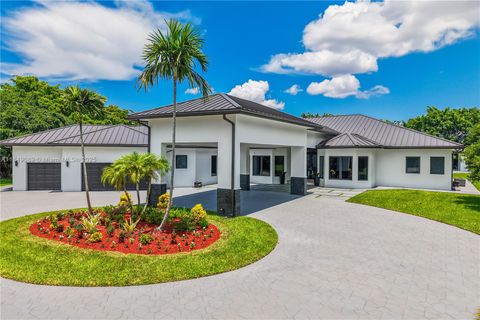
Active
$3,850,000
6
bds
|
7
ba
|
5,027
sqft
|
built
2001
601 Ranch Rd, Weston, FL 33326
$-16,685
Cash flow
-22.6%
Cash-on-Cash Return
0.9%
Cap rate
0.2%
Rent to Value Ratio
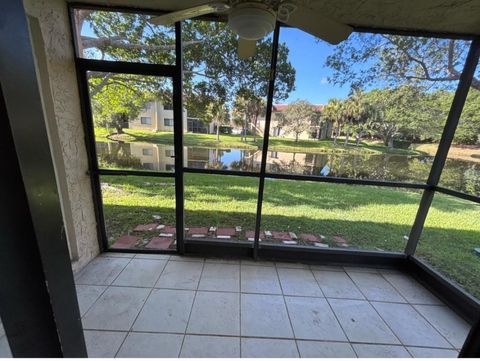
Active
$339,900
2
bds
|
2
ba
|
1,225
sqft
|
built
1979
235 Lakeview Dr, Weston, FL 33326
$-1,152
Cash flow
-17.7%
Cash-on-Cash Return
2.1%
Cap rate
0.7%
Rent to Value Ratio
Active
$665,000
4
bds
|
2
ba
|
1,572
sqft
|
built
1993
802 Garnet Cir, Weston, FL 33326
$-1,632
Cash flow
-12.8%
Cash-on-Cash Return
3.2%
Cap rate
0.5%
Rent to Value Ratio
Active
$315,500
2
bds
|
2
ba
|
1,235
sqft
|
built
1980
16210 Laurel Dr, Weston, FL 33326
$-952
Cash flow
-15.7%
Cash-on-Cash Return
2.5%
Cap rate
0.8%
Rent to Value Ratio
Active
$3,199,000
5
bds
|
6
ba
|
5,179
sqft
|
built
2007
741 Ranch Rd, Weston, FL 33326
$-12,469
Cash flow
-20.3%
Cash-on-Cash Return
1.5%
Cap rate
0.3%
Rent to Value Ratio
Active
$769,900
4
bds
|
3
ba
|
2,022
sqft
|
built
1993
695 Falling Water Rd, Weston, FL 33326
$-1,977
Cash flow
-13.4%
Cash-on-Cash Return
3.1%
Cap rate
0.6%
Rent to Value Ratio
Active
$415,000
2
bds
|
2
ba
|
1,110
sqft
|
built
1994
16679 Hemingway Dr, Weston, FL 33326
$-1,224
Cash flow
-15.4%
Cash-on-Cash Return
2.6%
Cap rate
0.6%
Rent to Value Ratio
Active
$775,000
4
bds
|
2
ba
|
2,186
sqft
|
built
1990
938 SW 149th Ter, Sunrise, FL 33326
$-1,264
Cash flow
-8.5%
Cash-on-Cash Return
4.2%
Cap rate
0.7%
Rent to Value Ratio
Active
$2,895,000
5
bds
|
7
ba
|
5,368
sqft
|
built
2023
16703 Botaniko Dr S, Weston, FL 33326
$-12,056
Cash flow
-21.7%
Cash-on-Cash Return
1.1%
Cap rate
0.4%
Rent to Value Ratio
Active
$370,000
2
bds
|
2
ba
|
1,048
sqft
|
built
1985
447 Lakeview Dr, Weston, FL 33326
$-929
Cash flow
-13.1%
Cash-on-Cash Return
3.1%
Cap rate
0.8%
Rent to Value Ratio
Active
$539,000
2
bds
|
3
ba
|
1,131
sqft
|
built
1995
1051 Sorrento Dr, Weston, FL 33326
$-1,668
Cash flow
-16.1%
Cash-on-Cash Return
2.4%
Cap rate
0.5%
Rent to Value Ratio
Active
$2,700,000
4
bds
|
6
ba
|
3,389
sqft
|
built
2019
16582 Botaniko Dr S, Weston, FL 33326
$-10,906
Cash flow
-21.1%
Cash-on-Cash Return
1.3%
Cap rate
0.4%
Rent to Value Ratio
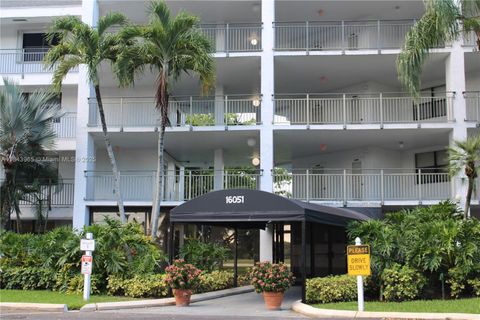
Active
$320,000
2
bds
|
2
ba
|
1,382
sqft
|
built
1981
16051 Blatt Blvd, Weston, FL 33326
$-888
Cash flow
-14.5%
Cash-on-Cash Return
2.8%
Cap rate
0.9%
Rent to Value Ratio
Active
$3,500,000
6
bds
|
8
ba
|
4,881
sqft
|
built
2020
16640 Sunset Way, Weston, FL 33326
$-15,864
Cash flow
-23.6%
Cash-on-Cash Return
0.7%
Cap rate
0.3%
Rent to Value Ratio
Active
$429,999
3
bds
|
2
ba
|
1,370
sqft
|
built
1988
601 Woodgate Ln, Sunrise, FL 33326
$-875
Cash flow
-10.6%
Cash-on-Cash Return
3.7%
Cap rate
0.7%
Rent to Value Ratio
Active
$705,533
3
bds
|
2
ba
|
1,724
sqft
|
built
1984
750 SW 158th Ter, Sunrise, FL 33326
$-1,513
Cash flow
-11.2%
Cash-on-Cash Return
3.6%
Cap rate
0.6%
Rent to Value Ratio