33326 Investment Properties for Sale
Browse homes for sale and investment properties in 33326. Refine your search by price, property type, or more.
Best cash flowing properties in 33326

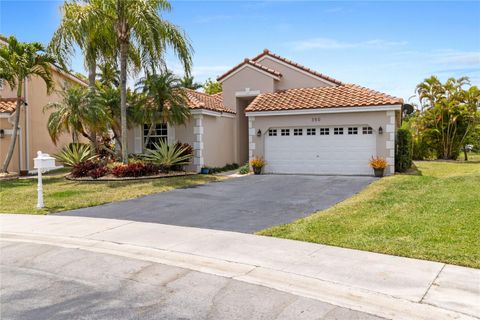
Active
$349,900
2
bds
|
2
ba
|
1,090
sqft
|
built
1978
230 Lakeview Dr, Weston, FL 33326
$-256
Cash flow
-3.8%
Cash-on-Cash Return
5.3%
Cap rate
0.7%
Rent to Value Ratio
Active
$265,000
2
bds
|
2
ba
|
800
sqft
|
built
1984
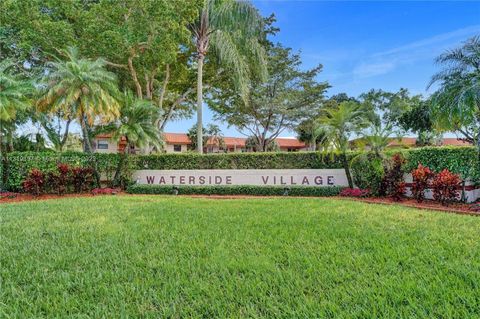
15701 W Waterside Cir, Sunrise, FL 33326
$-472
Cash flow
-9.3%
Cash-on-Cash Return
4.0%
Cap rate
0.8%
Rent to Value Ratio
173 out of 213 properties for sale in 33326
Limited Results Shown
Create a free account, or log in to reveal all property listings and enjoy the complete experience.
Active
$399,000
3
bds
|
2
ba
|
1,050
sqft
|
built
1989
15798 Woodgate Ct, Sunrise, FL 33326
$-1,009
Cash flow
-13.2%
Cash-on-Cash Return
3.1%
Cap rate
0.7%
Rent to Value Ratio

Active
$315,000
2
bds
|
2
ba
|
1,231
sqft
|
built
1980
374 Lakeview Dr, Weston, FL 33326
$-929
Cash flow
-15.4%
Cash-on-Cash Return
2.6%
Cap rate
0.8%
Rent to Value Ratio

Active
$975,000
4
bds
|
3
ba
|
2,254
sqft
|
built
1987
1589 Eastlake Way, Weston, FL 33326
$-2,101
Cash flow
-11.2%
Cash-on-Cash Return
3.6%
Cap rate
0.6%
Rent to Value Ratio

Active
$700,000
3
bds
|
2
ba
|
1,734
sqft
|
built
1996
98 Gables Blvd, Weston, FL 33326
$-1,501
Cash flow
-11.2%
Cash-on-Cash Return
3.6%
Cap rate
0.6%
Rent to Value Ratio

Active
$750,000
3
bds
|
3
ba
|
2,011
sqft
|
built
1988
2092 Island Cir, Weston, FL 33326
$-2,086
Cash flow
-14.5%
Cash-on-Cash Return
2.8%
Cap rate
0.6%
Rent to Value Ratio

Active
$539,000
2
bds
|
3
ba
|
1,131
sqft
|
built
1995
1051 Sorrento Dr, Weston, FL 33326
$-1,668
Cash flow
-16.1%
Cash-on-Cash Return
2.4%
Cap rate
0.5%
Rent to Value Ratio

Active
$790,000
4
bds
|
3
ba
|
2,562
sqft
|
built
1996
73 Gables Blvd, Weston, FL 33326
$-1,891
Cash flow
-12.5%
Cash-on-Cash Return
3.3%
Cap rate
0.6%
Rent to Value Ratio
Active
$819,000
4
bds
|
3
ba
|
2,316
sqft
|
built
1994
457 Cambridge Dr, Weston, FL 33326
$-1,591
Cash flow
-10.1%
Cash-on-Cash Return
3.8%
Cap rate
0.6%
Rent to Value Ratio
Active
$2,500,000
5
bds
|
6
ba
|
5,255
sqft
|
built
2006
1602 SW 150th Ter, Sunrise, FL 33326
$-9,853
Cash flow
-20.6%
Cash-on-Cash Return
1.4%
Cap rate
0.4%
Rent to Value Ratio
Active
$265,000
2
bds
|
2
ba
|
800
sqft
|
built
1984
15701 W Waterside Cir, Sunrise, FL 33326
$-472
Cash flow
-9.3%
Cash-on-Cash Return
4.0%
Cap rate
0.8%
Rent to Value Ratio

Active
$995,000
4
bds
|
3
ba
|
2,776
sqft
|
built
1993
1987 S Landing Way, Weston, FL 33326
$-2,174
Cash flow
-11.4%
Cash-on-Cash Return
3.5%
Cap rate
0.6%
Rent to Value Ratio

Active
$870,000
4
bds
|
3
ba
|
2,394
sqft
|
built
1989
1162 Laguna Springs Dr, Weston, FL 33326
$-2,012
Cash flow
-12.1%
Cash-on-Cash Return
3.4%
Cap rate
0.7%
Rent to Value Ratio

Active
$2,995,000
5
bds
|
7
ba
|
5,368
sqft
|
built
2023
16703 Botaniko Dr S, Weston, FL 33326
$-12,644
Cash flow
-22.0%
Cash-on-Cash Return
1.1%
Cap rate
0.4%
Rent to Value Ratio

Active
$1,850,000
5
bds
|
4
ba
|
4,264
sqft
|
built
1999
15546 SW 17th St, Weston, FL 33326
$-6,352
Cash flow
-17.9%
Cash-on-Cash Return
2.0%
Cap rate
0.3%
Rent to Value Ratio
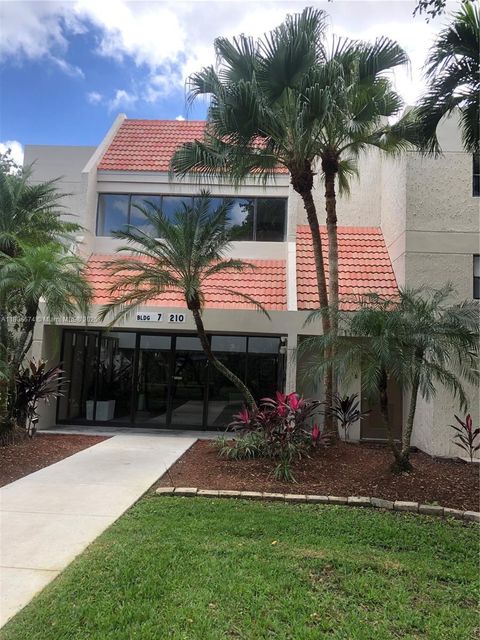
Active
$350,000
2
bds
|
2
ba
|
1,106
sqft
|
built
1978
210 Lakeview Dr, Weston, FL 33326
$-1,231
Cash flow
-18.4%
Cash-on-Cash Return
1.9%
Cap rate
0.7%
Rent to Value Ratio
Active
$285,000
2
bds
|
2
ba
|
800
sqft
|
built
1984
15805 W Waterside Cir, Sunrise, FL 33326
$-652
Cash flow
-11.9%
Cash-on-Cash Return
3.4%
Cap rate
0.8%
Rent to Value Ratio
Active
$950,000
5
bds
|
4
ba
|
2,767
sqft
|
built
1996
85 Gables Blvd, Weston, FL 33326
$-1,352
Cash flow
-7.4%
Cash-on-Cash Return
4.4%
Cap rate
0.7%
Rent to Value Ratio

Active
$1,200,000
4
bds
|
3
ba
|
2,626
sqft
|
built
1991
1119 Creekford Dr, Weston, FL 33326
$-3,292
Cash flow
-14.3%
Cash-on-Cash Return
2.9%
Cap rate
0.5%
Rent to Value Ratio

Active
$510,000
3
bds
|
3
ba
|
1,588
sqft
|
built
1988
513 Racquet Club Rd, Weston, FL 33326
$-1,563
Cash flow
-16.0%
Cash-on-Cash Return
2.5%
Cap rate
0.6%
Rent to Value Ratio
Active
$320,000
2
bds
|
2
ba
|
1,292
sqft
|
built
1981
16141 Blatt Blvd, Weston, FL 33326
$-527
Cash flow
-8.6%
Cash-on-Cash Return
4.2%
Cap rate
0.7%
Rent to Value Ratio

Active
$1,270,000
5
bds
|
4
ba
|
3,106
sqft
|
built
1994
515 Montclaire Dr, Weston, FL 33326
$-3,838
Cash flow
-15.8%
Cash-on-Cash Return
2.5%
Cap rate
0.4%
Rent to Value Ratio

Active
$410,000
2
bds
|
2
ba
|
1,048
sqft
|
built
1985
447 Lakeview Dr, Weston, FL 33326
$-1,124
Cash flow
-14.3%
Cash-on-Cash Return
2.9%
Cap rate
0.7%
Rent to Value Ratio

Active
$860,000
4
bds
|
3
ba
|
2,340
sqft
|
built
2002
1504 Passion Vine Cir, Weston, FL 33326
$-3,326
Cash flow
-20.2%
Cash-on-Cash Return
1.5%
Cap rate
0.5%
Rent to Value Ratio

Active
$658,000
3
bds
|
3
ba
|
1,502
sqft
|
built
1988
1388 Garden Rd, Weston, FL 33326
$-1,639
Cash flow
-13.0%
Cash-on-Cash Return
3.2%
Cap rate
0.6%
Rent to Value Ratio
Active
$349,900
2
bds
|
2
ba
|
1,090
sqft
|
built
1978
230 Lakeview Dr, Weston, FL 33326
$-256
Cash flow
-3.8%
Cash-on-Cash Return
5.3%
Cap rate
0.7%
Rent to Value Ratio

Active
$379,500
2
bds
|
2
ba
|
1,490
sqft
|
built
1980
16023 Fairway Ter, Weston, FL 33326
$-951
Cash flow
-13.1%
Cash-on-Cash Return
3.1%
Cap rate
0.8%
Rent to Value Ratio

Active
$929,000
5
bds
|
3
ba
|
2,556
sqft
|
built
1993
372 Carrington Dr, Weston, FL 33326
$-2,219
Cash flow
-12.5%
Cash-on-Cash Return
3.3%
Cap rate
0.5%
Rent to Value Ratio

Active
$1,429,000
4
bds
|
3
ba
|
3,892
sqft
|
built
1980
16686 Golfview Dr, Weston, FL 33326
$-3,888
Cash flow
-14.2%
Cash-on-Cash Return
2.9%
Cap rate
0.4%
Rent to Value Ratio

Active
$435,000
3
bds
|
2
ba
|
1,160
sqft
|
built
1989
15712 Woodgate Ct, Sunrise, FL 33326
$-922
Cash flow
-11.1%
Cash-on-Cash Return
3.6%
Cap rate
0.8%
Rent to Value Ratio

Active
$300,000
2
bds
|
2
ba
|
1,231
sqft
|
built
1980
398 Lakeview Dr, Weston, FL 33326
$-625
Cash flow
-10.9%
Cash-on-Cash Return
3.6%
Cap rate
0.8%
Rent to Value Ratio
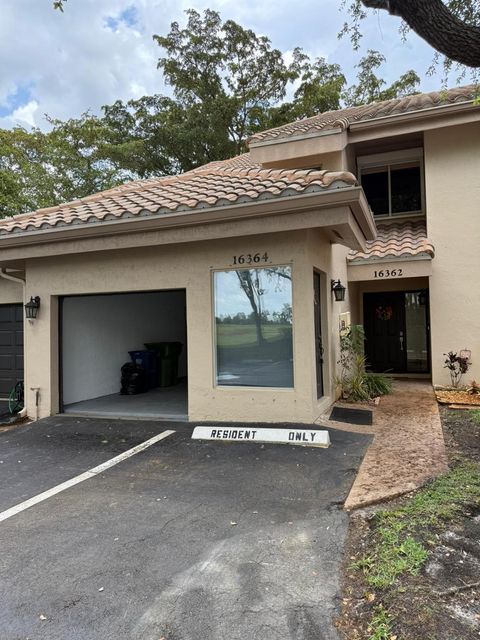
Active
$416,000
2
bds
|
2
ba
|
1,665
sqft
|
built
1994
16364 Malibu Dr, Weston, FL 33326
$-1,522
Cash flow
-19.1%
Cash-on-Cash Return
1.8%
Cap rate
0.7%
Rent to Value Ratio

Active
$729,000
3
bds
|
3
ba
|
1,825
sqft
|
built
1990
504 Bedford Ave, Weston, FL 33326
$-1,849
Cash flow
-13.2%
Cash-on-Cash Return
3.1%
Cap rate
0.5%
Rent to Value Ratio
Active
$670,000
3
bds
|
2
ba
|
1,734
sqft
|
built
1996
102 Gables Blvd, Weston, FL 33326
$-1,797
Cash flow
-14.0%
Cash-on-Cash Return
2.9%
Cap rate
0.6%
Rent to Value Ratio
Active
$335,000
2
bds
|
3
ba
|
1,273
sqft
|
built
1976
16300 Golf Club Rd, Weston, FL 33326
$-963
Cash flow
-15.0%
Cash-on-Cash Return
2.7%
Cap rate
0.9%
Rent to Value Ratio
Active
$699,900
3
bds
|
2
ba
|
1,669
sqft
|
built
1991
350 Somerset Way, Weston, FL 33326
$-1,814
Cash flow
-13.5%
Cash-on-Cash Return
3.0%
Cap rate
0.6%
Rent to Value Ratio

Active
$498,000
3
bds
|
2
ba
|
1,677
sqft
|
built
1986
256 Lakeside Cir, Sunrise, FL 33326
$-1,450
Cash flow
-15.2%
Cash-on-Cash Return
2.7%
Cap rate
0.6%
Rent to Value Ratio
Active
$645,000
3
bds
|
2
ba
|
1,353
sqft
|
built
1995
591 Talavera Rd, Weston, FL 33326
$-1,628
Cash flow
-13.2%
Cash-on-Cash Return
3.1%
Cap rate
0.6%
Rent to Value Ratio
Active
$470,000
2
bds
|
2
ba
|
1,490
sqft
|
built
1980
371 Fairway Cir, Weston, FL 33326
$-1,155
Cash flow
-12.8%
Cash-on-Cash Return
3.2%
Cap rate
0.7%
Rent to Value Ratio

Active
$460,000
3
bds
|
3
ba
|
1,670
sqft
|
built
1971
301 Bonaventure Blvd, Weston, FL 33326
$-1,134
Cash flow
-12.9%
Cash-on-Cash Return
3.2%
Cap rate
0.7%
Rent to Value Ratio

Active
$330,000
2
bds
|
2
ba
|
1,220
sqft
|
built
1981
16501 Blatt Blvd, Weston, FL 33326
$-1,033
Cash flow
-16.3%
Cash-on-Cash Return
2.4%
Cap rate
0.8%
Rent to Value Ratio