33436 Investment Properties for Sale
Browse homes for sale and investment properties in 33436. Refine your search by price, property type, or more.
Best cash flowing properties in 33436
Active
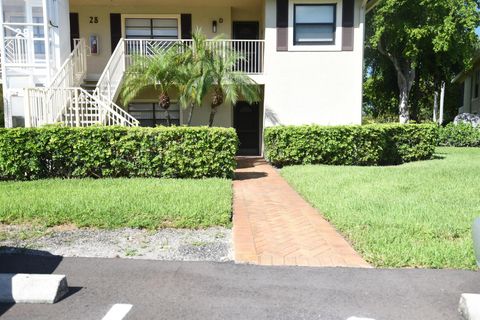
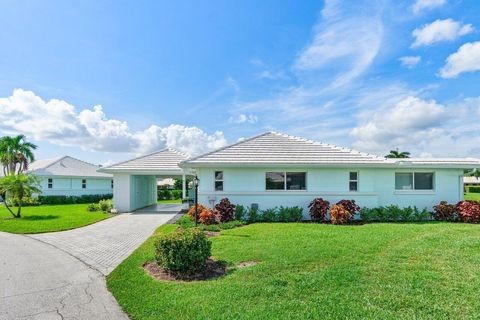
$79,000
2
bds
|
2
ba
|
1,429
sqft
|
built
1981
28 Stratford Ln W, Boynton Beach, FL 33436
$-401
Cash flow
-26.5%
Cash-on-Cash Return
0.1%
Cap rate
2.5%
Rent to Value Ratio
Active
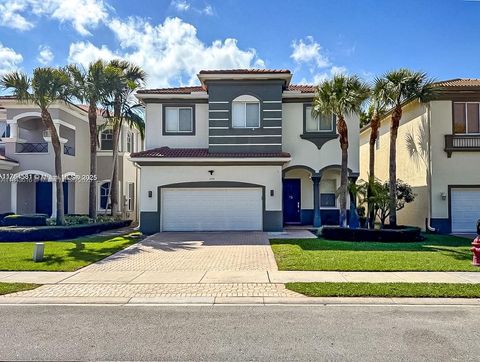
$368,940
3
bds
|
3
ba
|
1,628
sqft
|
built
2019
12864 Anthorne Ln, Boynton Beach, FL 33436
$-451
Cash flow
-6.4%
Cash-on-Cash Return
4.7%
Cap rate
0.8%
Rent to Value Ratio
159 out of 204 properties for sale in 33436
Limited Results Shown
Create a free account, or log in to reveal all property listings and enjoy the complete experience.
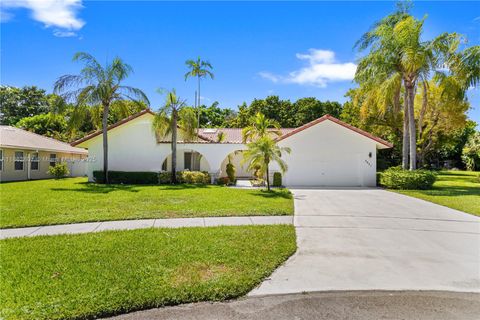
Active
$620,000
3
bds
|
3
ba
|
2,584
sqft
|
built
1983
2451 SW 23rd Cranbrook Dr, Boynton Beach, FL 33436
$-1,241
Cash flow
-10.4%
Cash-on-Cash Return
3.7%
Cap rate
0.6%
Rent to Value Ratio
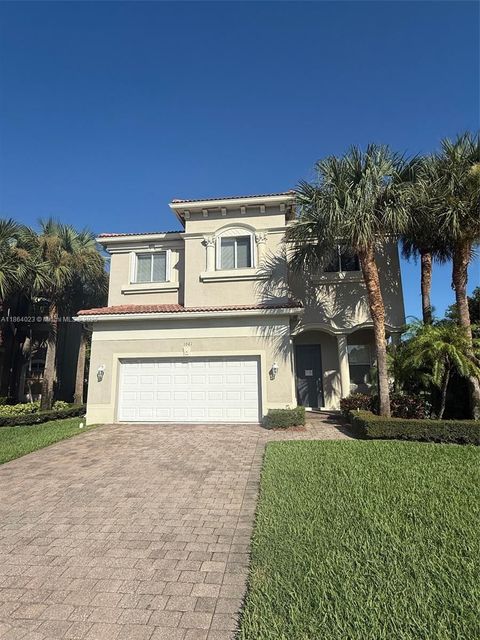
Active
$634,900
5
bds
|
4
ba
|
3,119
sqft
|
built
2005
1061 Grove Park Cir, Boynton Beach, FL 33436
$-1,688
Cash flow
-13.9%
Cash-on-Cash Return
3.0%
Cap rate
0.6%
Rent to Value Ratio
Active
$465,000
3
bds
|
2
ba
|
1,865
sqft
|
built
1987
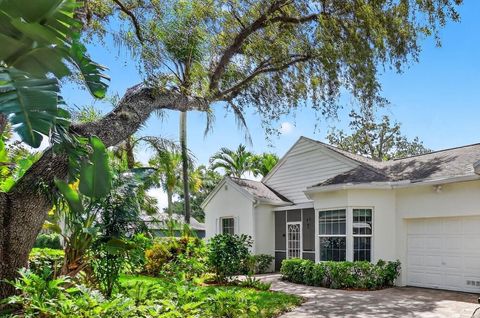
7632 Forest Green Ln, Boynton Beach, FL 33436
$-1,085
Cash flow
-12.2%
Cash-on-Cash Return
3.3%
Cap rate
0.6%
Rent to Value Ratio
Active
$1,750,000
4
bds
|
4
ba
|
3,336
sqft
|
built
1983
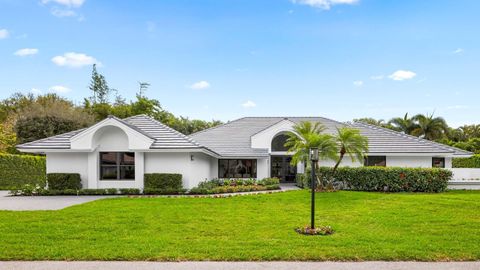
4606 Gleneagles Dr, Boynton Beach, FL 33436
$-5,352
Cash flow
-16.0%
Cash-on-Cash Return
2.5%
Cap rate
0.4%
Rent to Value Ratio
Active
$3,999,000
4
bds
|
5
ba
|
3,907
sqft
|
built
2026
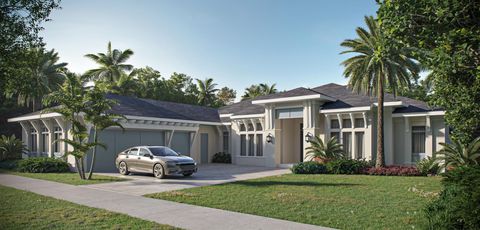
4915 King Palm Cir, Boynton Beach, FL 33436
$-16,510
Cash flow
-21.5%
Cash-on-Cash Return
1.2%
Cap rate
0.2%
Rent to Value Ratio
Active
$250,000
2
bds
|
2
ba
|
1,008
sqft
|
built
1984
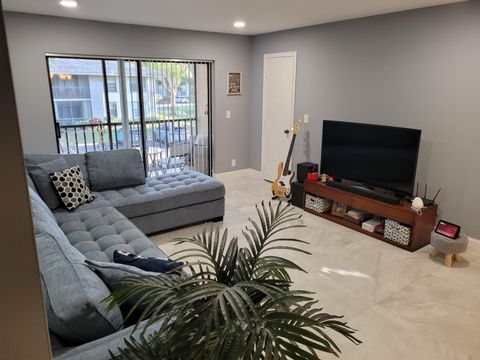
9780 Pineapple Tree Dr, Boynton Beach, FL 33436
$-620
Cash flow
-12.9%
Cash-on-Cash Return
3.2%
Cap rate
0.8%
Rent to Value Ratio
Active
$1,115,000
4
bds
|
3
ba
|
2,407
sqft
|
built
1999
9525 Cross Creek Dr, Boynton Beach, FL 33436
$-3,098
Cash flow
-14.5%
Cash-on-Cash Return
2.8%
Cap rate
0.4%
Rent to Value Ratio
Active
$559,000
3
bds
|
2
ba
|
1,296
sqft
|
built
1988
1812 Edgewater Dr, Boynton Beach, FL 33436
$-1,106
Cash flow
-10.3%
Cash-on-Cash Return
3.8%
Cap rate
0.6%
Rent to Value Ratio
Active
$220,000
2
bds
|
2
ba
|
921
sqft
|
built
1986
1104 Meadows Cir, Boynton Beach, FL 33436
$-702
Cash flow
-16.6%
Cash-on-Cash Return
2.3%
Cap rate
0.9%
Rent to Value Ratio
Active
$460,000
2
bds
|
2
ba
|
1,404
sqft
|
built
1986
22 Baytree Cir, Boynton Beach, FL 33436
$-841
Cash flow
-9.5%
Cash-on-Cash Return
4.0%
Cap rate
0.6%
Rent to Value Ratio
Active
$998,000
3
bds
|
4
ba
|
2,139
sqft
|
built
1970
11 Slash Pine Dr, Boynton Beach, FL 33436
$-3,865
Cash flow
-20.2%
Cash-on-Cash Return
1.5%
Cap rate
0.4%
Rent to Value Ratio
Active
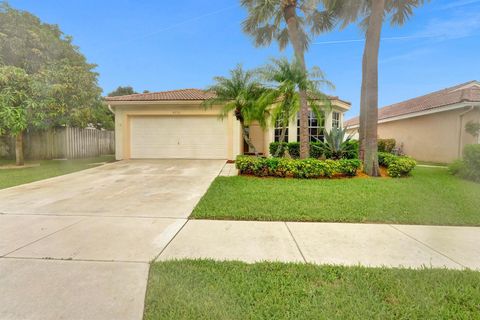
$410,000
3
bds
|
2
ba
|
1,407
sqft
|
built
1993
7467 Pinedale Dr, Boynton Beach, FL 33436
$-553
Cash flow
-7.0%
Cash-on-Cash Return
4.5%
Cap rate
0.7%
Rent to Value Ratio
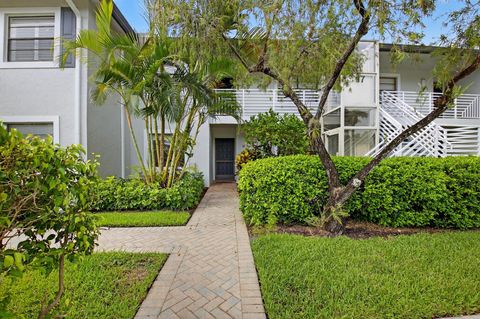
Active
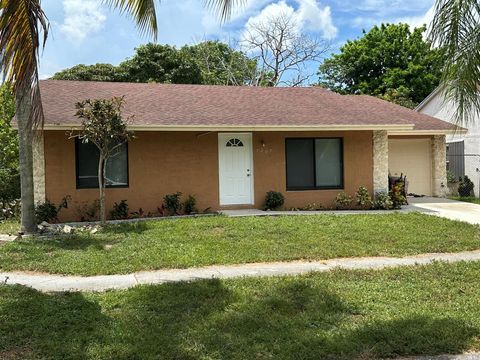
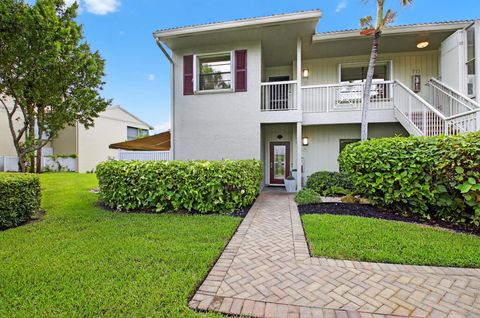
$99,000
2
bds
|
2
ba
|
1,479
sqft
|
built
1981
32 Stratford Ln W, Boynton Beach, FL 33436
$-476
Cash flow
-25.1%
Cash-on-Cash Return
0.4%
Cap rate
2.3%
Rent to Value Ratio
Active
$680,000
4
bds
|
3
ba
|
2,755
sqft
|
built
2002
1506 Siena Ln, Boynton Beach, FL 33436
$-1,069
Cash flow
-8.2%
Cash-on-Cash Return
4.3%
Cap rate
0.7%
Rent to Value Ratio
Active
$430,000
3
bds
|
3
ba
|
1,681
sqft
|
built
2001
1011 Arezzo Cir, Boynton Beach, FL 33436
$-858
Cash flow
-10.4%
Cash-on-Cash Return
3.8%
Cap rate
0.7%
Rent to Value Ratio
Active
$450,000
2
bds
|
2
ba
|
1,609
sqft
|
built
1988
7729 Forest Green Ln, Boynton Beach, FL 33436
$-1,131
Cash flow
-13.1%
Cash-on-Cash Return
3.1%
Cap rate
0.6%
Rent to Value Ratio
Active
$599,000
4
bds
|
3
ba
|
2,810
sqft
|
built
2006
1078 Grove Park Cir, Boynton Beach, FL 33436
$-1,132
Cash flow
-9.9%
Cash-on-Cash Return
3.9%
Cap rate
0.7%
Rent to Value Ratio

Active
$363,900
3
bds
|
2
ba
|
1,458
sqft
|
built
1989
9746 Nickels Blvd, Boynton Beach, FL 33436
$-956
Cash flow
-13.7%
Cash-on-Cash Return
3.0%
Cap rate
0.8%
Rent to Value Ratio
Active
$999,000
3
bds
|
2
ba
|
2,460
sqft
|
built
1972
4860 S Lake Dr, Boynton Beach, FL 33436
$-3,519
Cash flow
-18.4%
Cash-on-Cash Return
1.9%
Cap rate
0.4%
Rent to Value Ratio
Active
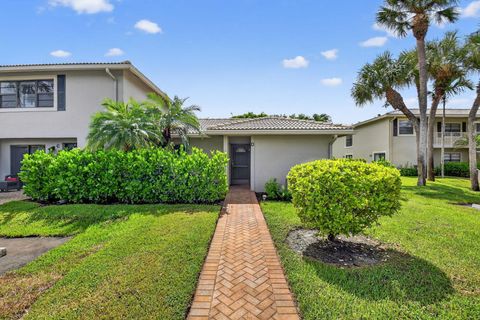
$99,900
2
bds
|
2
ba
|
1,383
sqft
|
built
1980
34 Southport Ln, Boynton Beach, FL 33436
$-647
Cash flow
-33.8%
Cash-on-Cash Return
-1.6%
Cap rate
2.5%
Rent to Value Ratio
Active
$615,000
4
bds
|
3
ba
|
2,192
sqft
|
built
1989
1103 Fairfax Cir W, Boynton Beach, FL 33436
$-1,360
Cash flow
-11.5%
Cash-on-Cash Return
3.5%
Cap rate
0.6%
Rent to Value Ratio
Active
$799,000
4
bds
|
3
ba
|
2,466
sqft
|
built
2022
2659 Country Lake Trl, Boynton Beach, FL 33436
$-2,408
Cash flow
-15.7%
Cash-on-Cash Return
2.5%
Cap rate
0.5%
Rent to Value Ratio
Active
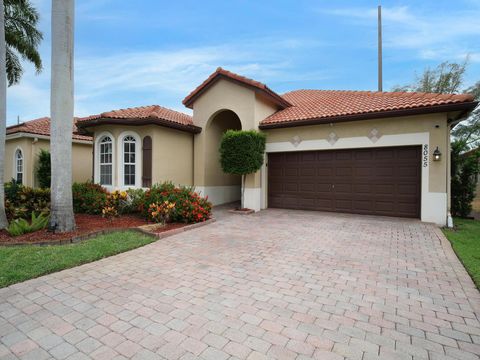
$585,000
3
bds
|
2
ba
|
1,761
sqft
|
built
1999
8055 Saw Palmetto Ln, Boynton Beach, FL 33436
$-1,261
Cash flow
-11.2%
Cash-on-Cash Return
3.6%
Cap rate
0.6%
Rent to Value Ratio
Active
$380,000
2
bds
|
3
ba
|
1,374
sqft
|
built
1988
3404 Hayden Ct, Boynton Beach, FL 33436
$-641
Cash flow
-8.8%
Cash-on-Cash Return
4.1%
Cap rate
0.8%
Rent to Value Ratio
Active
$499,900
4
bds
|
2
ba
|
1,543
sqft
|
built
1996
8082 Tortuga Ln, Boynton Beach, FL 33436
$-1,055
Cash flow
-11.0%
Cash-on-Cash Return
3.6%
Cap rate
0.6%
Rent to Value Ratio
Active
$599,999
3
bds
|
3
ba
|
1,693
sqft
|
built
1994
212 Citrus Trl, Boynton Beach, FL 33436
$-1,081
Cash flow
-9.4%
Cash-on-Cash Return
4.0%
Cap rate
0.7%
Rent to Value Ratio
Active
$339,900
2
bds
|
3
ba
|
1,902
sqft
|
built
1980
21 Stratford Dr E, Boynton Beach, FL 33436
$-1,148
Cash flow
-17.6%
Cash-on-Cash Return
2.1%
Cap rate
1.1%
Rent to Value Ratio
Active
$2,789,000
4
bds
|
4
ba
|
4,342
sqft
|
built
1985
10858 Spicewood Trl, Boynton Beach, FL 33436
$-12,705
Cash flow
-23.8%
Cash-on-Cash Return
0.7%
Cap rate
0.3%
Rent to Value Ratio
Active
$400,000
3
bds
|
3
ba
|
1,704
sqft
|
built
2001
1703 Arezzo Cir, Boynton Beach, FL 33436
$-738
Cash flow
-9.6%
Cash-on-Cash Return
3.9%
Cap rate
0.7%
Rent to Value Ratio
Active
$579,900
3
bds
|
3
ba
|
2,679
sqft
|
built
1981
56 Woods Ln, Boynton Beach, FL 33436
$-2,008
Cash flow
-18.1%
Cash-on-Cash Return
2.0%
Cap rate
0.8%
Rent to Value Ratio
Active
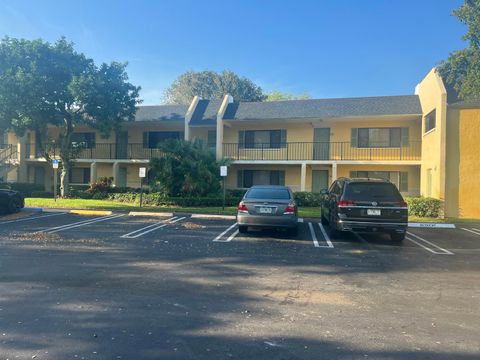
$519,900
3
bds
|
2
ba
|
2,285
sqft
|
built
1989
17 Clubhouse Ln, Boynton Beach, FL 33436
$-2,724
Cash flow
-27.3%
Cash-on-Cash Return
-0.1%
Cap rate
0.6%
Rent to Value Ratio
Active
$324,900
3
bds
|
2
ba
|
1,809
sqft
|
built
1986
70 Eastgate Dr, Boynton Beach, FL 33436
$-1,414
Cash flow
-22.7%
Cash-on-Cash Return
0.9%
Cap rate
1.0%
Rent to Value Ratio
Active
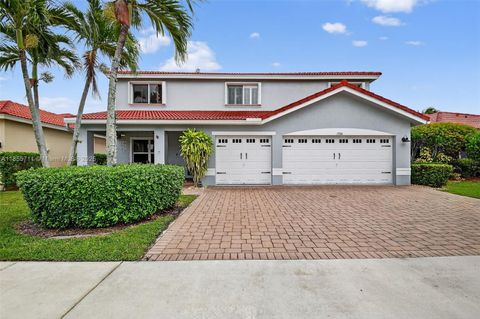
$124,000
2
bds
|
2
ba
|
1,383
sqft
|
built
1980
17 Southport Ln, Boynton Beach, FL 33436
$-592
Cash flow
-24.9%
Cash-on-Cash Return
0.4%
Cap rate
2.1%
Rent to Value Ratio
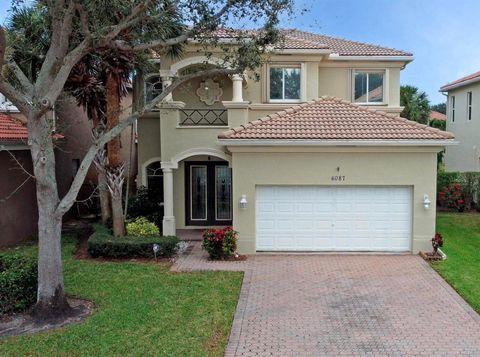
Active
$645,000
4
bds
|
3
ba
|
2,655
sqft
|
built
2004
4087 Woodhill Pl, Boynton Beach, FL 33436
$-1,573
Cash flow
-12.7%
Cash-on-Cash Return
3.2%
Cap rate
0.6%
Rent to Value Ratio
Active
$399,000
3
bds
|
2
ba
|
2,284
sqft
|
built
1983
37 Glens Dr W, Boynton Beach, FL 33436
$-1,993
Cash flow
-26.1%
Cash-on-Cash Return
0.2%
Cap rate
0.9%
Rent to Value Ratio
Active
$639,900
5
bds
|
5
ba
|
3,119
sqft
|
built
2006
1094 Grove Park Cir, Boynton Beach, FL 33436
$-1,693
Cash flow
-13.8%
Cash-on-Cash Return
3.0%
Cap rate
0.6%
Rent to Value Ratio
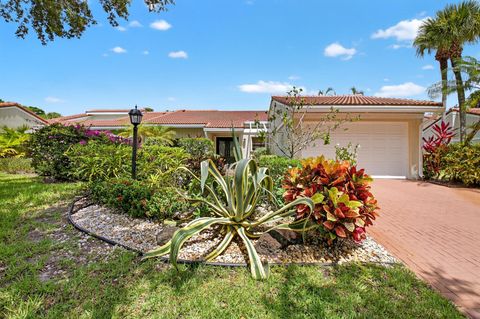
Active
$539,500
4
bds
|
2
ba
|
1,985
sqft
|
built
1996
8252 White Rock Cir, Boynton Beach, FL 33436
$-802
Cash flow
-7.8%
Cash-on-Cash Return
4.4%
Cap rate
0.6%
Rent to Value Ratio
Active
$230,000
2
bds
|
2
ba
|
921
sqft
|
built
1986
814 Meadows Cir, Boynton Beach, FL 33436
$-694
Cash flow
-15.7%
Cash-on-Cash Return
2.5%
Cap rate
0.9%
Rent to Value Ratio