33436 Investment Properties for Sale
Browse homes for sale and investment properties in 33436. Refine your search by price, property type, or more.
Best cash flowing properties in 33436

Active
$1,000
2
bds
|
2
ba
|
1,388
sqft
|
built
1980
7 Stratford Dr E, Boynton Beach, FL 33436
$-235
Cash flow
-273.8%
Cash-on-Cash Return
-282.0%
Cap rate
200.0%
Rent to Value Ratio
Active
$395,000
3
bds
|
2
ba
|
1,221
sqft
|
built
1997
7067 Chesapeake Cir, Boynton Beach, FL 33436
$-288
Cash flow
-3.8%
Cash-on-Cash Return
5.3%
Cap rate
0.8%
Rent to Value Ratio
130 out of 164 properties for sale in 33436
Limited Results Shown
Create a free account, or log in to reveal all property listings and enjoy the complete experience.

Active
$1,099,000
4
bds
|
3
ba
|
2,688
sqft
|
built
1973
18 Holly Dr, Boynton Beach, FL 33436
$-3,897
Cash flow
-18.5%
Cash-on-Cash Return
1.9%
Cap rate
0.4%
Rent to Value Ratio
Active
$635,000
4
bds
|
3
ba
|
2,810
sqft
|
built
2006
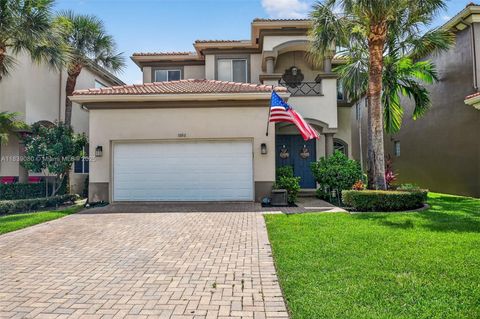
1086 Grove Park Cir, Boynton Beach, FL 33436
$-1,218
Cash flow
-10.0%
Cash-on-Cash Return
3.8%
Cap rate
0.7%
Rent to Value Ratio

Active
$244,999
2
bds
|
2
ba
|
1,008
sqft
|
built
1981
9930 Pineapple Tree Dr, Boynton Beach, FL 33436
$-802
Cash flow
-17.1%
Cash-on-Cash Return
2.2%
Cap rate
0.7%
Rent to Value Ratio

Active
$1,449,000
3
bds
|
3
ba
|
3,459
sqft
|
built
1989
10378 Saint Andrews Rd, Boynton Beach, FL 33436
$-4,487
Cash flow
-16.2%
Cash-on-Cash Return
2.4%
Cap rate
0.4%
Rent to Value Ratio

Active
$389,999
3
bds
|
2
ba
|
1,282
sqft
|
built
1988
1202 Copley Ct, Boynton Beach, FL 33436
$-897
Cash flow
-12.0%
Cash-on-Cash Return
3.4%
Cap rate
0.7%
Rent to Value Ratio

Active
$299,900
2
bds
|
3
ba
|
1,362
sqft
|
built
1988
6102 Wheatley Ct, Boynton Beach, FL 33436
$-803
Cash flow
-14.0%
Cash-on-Cash Return
2.9%
Cap rate
0.8%
Rent to Value Ratio

Active
$552,895
4
bds
|
3
ba
|
2,118
sqft
|
built
1994
8612 Binghamton Ave, Boynton Beach, FL 33436
$-743
Cash flow
-7.0%
Cash-on-Cash Return
4.5%
Cap rate
0.6%
Rent to Value Ratio
Active
$429,000
3
bds
|
2
ba
|
1,696
sqft
|
built
1987
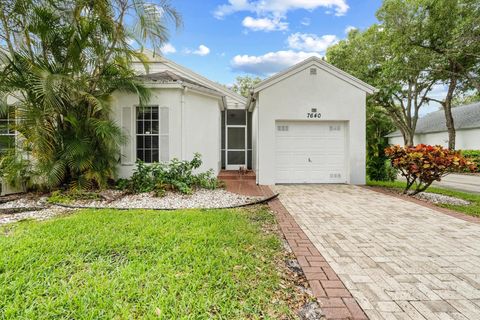
7640 Forest Green Ln, Boynton Beach, FL 33436
$-724
Cash flow
-8.8%
Cash-on-Cash Return
4.1%
Cap rate
0.7%
Rent to Value Ratio

Active
$825,000
3
bds
|
2
ba
|
2,314
sqft
|
built
1977
3655 Royal Tern Cir, Boynton Beach, FL 33436
$-3,240
Cash flow
-20.5%
Cash-on-Cash Return
1.4%
Cap rate
0.5%
Rent to Value Ratio

Active
$540,000
3
bds
|
2
ba
|
2,483
sqft
|
built
1997
4102 Manor Forest Trl, Boynton Beach, FL 33436
$-1,156
Cash flow
-11.2%
Cash-on-Cash Return
3.6%
Cap rate
0.6%
Rent to Value Ratio

Active
$225,000
3
bds
|
2
ba
|
1,300
sqft
|
built
1975
1906 Palmland Dr, Boynton Beach, FL 33436
$-355
Cash flow
-8.2%
Cash-on-Cash Return
4.3%
Cap rate
1.1%
Rent to Value Ratio

Active
$475,000
3
bds
|
2
ba
|
1,844
sqft
|
built
1999
8056 Palm Gate Dr, Boynton Beach, FL 33436
$-542
Cash flow
-6.0%
Cash-on-Cash Return
4.8%
Cap rate
0.7%
Rent to Value Ratio
Active
$675,000
3
bds
|
2
ba
|
2,061
sqft
|
built
1999
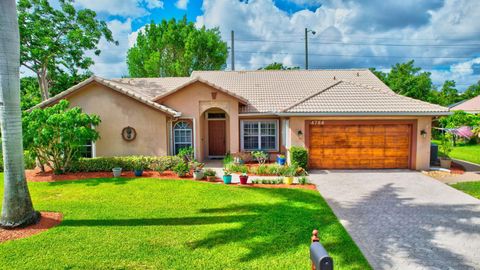
4788 Cypress Dr S, Boynton Beach, FL 33436
$-1,553
Cash flow
-12.0%
Cash-on-Cash Return
3.4%
Cap rate
0.5%
Rent to Value Ratio
Active
$799,000
3
bds
|
3
ba
|
3,017
sqft
|
built
1983
4378 Juniper Ter, Boynton Beach, FL 33436
$-1,485
Cash flow
-9.7%
Cash-on-Cash Return
3.9%
Cap rate
0.6%
Rent to Value Ratio

Active
$249,000
2
bds
|
3
ba
|
1,122
sqft
|
built
1996
9931 Kamena Cir, Boynton Beach, FL 33436
$-544
Cash flow
-11.4%
Cash-on-Cash Return
3.5%
Cap rate
1.0%
Rent to Value Ratio
Active
$290,000
2
bds
|
2
ba
|
1,054
sqft
|
built
1984
7507 Greenlake Way, Boynton Beach, FL 33436
$-776
Cash flow
-14.0%
Cash-on-Cash Return
2.9%
Cap rate
0.8%
Rent to Value Ratio
Active
$1,699,000
4
bds
|
3
ba
|
3,418
sqft
|
built
1974
4747 S Lake Dr, Boynton Beach, FL 33436
$-3,115
Cash flow
-9.6%
Cash-on-Cash Return
3.9%
Cap rate
0.6%
Rent to Value Ratio
Active
$154,900
3
bds
|
2
ba
|
1,622
sqft
|
built
1981
36 Stratford Ln W, Boynton Beach, FL 33436
$-476
Cash flow
-16.0%
Cash-on-Cash Return
2.5%
Cap rate
2.0%
Rent to Value Ratio

Active
$650,000
4
bds
|
3
ba
|
2,169
sqft
|
built
2001
1839 Magliano Dr, Boynton Beach, FL 33436
$-1,092
Cash flow
-8.8%
Cash-on-Cash Return
4.1%
Cap rate
0.6%
Rent to Value Ratio
Active
$479,000
3
bds
|
2
ba
|
1,405
sqft
|
built
1999
8140 Palm Gate Dr, Boynton Beach, FL 33436
$-719
Cash flow
-7.8%
Cash-on-Cash Return
4.3%
Cap rate
0.7%
Rent to Value Ratio
Active
$529,999
3
bds
|
2
ba
|
1,988
sqft
|
built
2004
4086 Woodhill Pl, Boynton Beach, FL 33436
$-854
Cash flow
-8.4%
Cash-on-Cash Return
4.2%
Cap rate
0.7%
Rent to Value Ratio
Active
$324,900
3
bds
|
3
ba
|
1,472
sqft
|
built
1982
3665 Silver Lace Ln, Boynton Beach, FL 33436
$-643
Cash flow
-10.3%
Cash-on-Cash Return
3.8%
Cap rate
0.8%
Rent to Value Ratio

Active
$749,900
2
bds
|
2
ba
|
2,053
sqft
|
built
1970
2 Fairway Dr, Boynton Beach, FL 33436
$-2,682
Cash flow
-18.7%
Cash-on-Cash Return
1.9%
Cap rate
0.4%
Rent to Value Ratio
Active
$295,000
2
bds
|
3
ba
|
1,264
sqft
|
built
1986
217 Live Oak Ln, Boynton Beach, FL 33436
$-728
Cash flow
-12.9%
Cash-on-Cash Return
3.2%
Cap rate
0.8%
Rent to Value Ratio

Active
$1,750,000
4
bds
|
4
ba
|
2,650
sqft
|
built
2018
4941 S Lake Dr, Boynton Beach, FL 33436
$-4,210
Cash flow
-12.6%
Cash-on-Cash Return
3.3%
Cap rate
0.6%
Rent to Value Ratio
Active
$499,500
3
bds
|
2
ba
|
1,894
sqft
|
built
1981
2600 SW 23rd Cranbrook Dr, Boynton Beach, FL 33436
$-961
Cash flow
-10.0%
Cash-on-Cash Return
3.8%
Cap rate
0.6%
Rent to Value Ratio

Active
$925,000
4
bds
|
3
ba
|
2,538
sqft
|
built
1971
11814 N Lake Dr, Boynton Beach, FL 33436
$-1,523
Cash flow
-8.6%
Cash-on-Cash Return
4.2%
Cap rate
0.6%
Rent to Value Ratio

Active
$79,000
2
bds
|
2
ba
|
1,383
sqft
|
built
1980
10 Southport Ln, Boynton Beach, FL 33436
$-586
Cash flow
-38.7%
Cash-on-Cash Return
-2.7%
Cap rate
2.9%
Rent to Value Ratio
Active
$609,900
4
bds
|
3
ba
|
2,060
sqft
|
built
2015
3809 Aspen Leaf Dr, Boynton Beach, FL 33436
$-1,447
Cash flow
-12.4%
Cash-on-Cash Return
3.3%
Cap rate
0.6%
Rent to Value Ratio
Active
$485,000
3
bds
|
2
ba
|
1,726
sqft
|
built
1986
4161 Grove Park Ln, Boynton Beach, FL 33436
$-485
Cash flow
-5.2%
Cash-on-Cash Return
4.9%
Cap rate
0.8%
Rent to Value Ratio

Active
$300,000
3
bds
|
2
ba
|
1,560
sqft
|
built
1980
3946 Quail Ridge Dr N, Boynton Beach, FL 33436
$-852
Cash flow
-14.8%
Cash-on-Cash Return
2.7%
Cap rate
1.0%
Rent to Value Ratio

Active
$474,900
3
bds
|
2
ba
|
1,531
sqft
|
built
1989
4227 Green Forest Way, Boynton Beach, FL 33436
$-471
Cash flow
-5.2%
Cash-on-Cash Return
5.0%
Cap rate
0.8%
Rent to Value Ratio

Active
$754,900
5
bds
|
4
ba
|
3,192
sqft
|
built
2014
3864 Aspen Leaf Dr, Boynton Beach, FL 33436
$-1,765
Cash flow
-12.2%
Cash-on-Cash Return
3.3%
Cap rate
0.6%
Rent to Value Ratio

Active
$338,000
2
bds
|
2
ba
|
1,350
sqft
|
built
1989
8912 Thumbwood Cir, Boynton Beach, FL 33436
$-800
Cash flow
-12.3%
Cash-on-Cash Return
3.3%
Cap rate
0.7%
Rent to Value Ratio

Active
$325,000
3
bds
|
2
ba
|
1,580
sqft
|
built
1990
9770 Nickels Blvd, Boynton Beach, FL 33436
$-810
Cash flow
-13.0%
Cash-on-Cash Return
3.2%
Cap rate
0.9%
Rent to Value Ratio
Active
$839,000
5
bds
|
3
ba
|
2,910
sqft
|
built
2005
12173 Colony Preserve Dr, Boynton Beach, FL 33436
$-2,665
Cash flow
-16.6%
Cash-on-Cash Return
2.3%
Cap rate
0.5%
Rent to Value Ratio
Active
$214,900
2
bds
|
2
ba
|
1,008
sqft
|
built
1981
9965 Pineapple Tree Dr, Boynton Beach, FL 33436
$-371
Cash flow
-9.0%
Cash-on-Cash Return
4.1%
Cap rate
1.0%
Rent to Value Ratio

Active
$469,900
3
bds
|
2
ba
|
1,584
sqft
|
built
1986
82 Baytree Cir, Boynton Beach, FL 33436
$-741
Cash flow
-8.2%
Cash-on-Cash Return
4.3%
Cap rate
0.7%
Rent to Value Ratio