33483 Investment Properties for Sale
Browse homes for sale and investment properties in 33483. Refine your search by price, property type, or more.
Best cash flowing properties in 33483
Active
$305,000
2
bds
|
2
ba
|
841
sqft
|
built
1973
207 Tropic Isle Dr, Delray Beach, FL 33483
$-982
Cash flow
-16.8%
Cash-on-Cash Return
2.3%
Cap rate
0.8%
Rent to Value Ratio
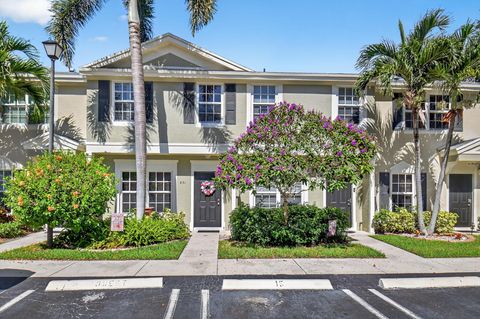
Active
$449,000
3
bds
|
3
ba
|
1,312
sqft
|
built
1997
925 Kokomo Key Ln, Delray Beach, FL 33483
$-1,165
Cash flow
-13.5%
Cash-on-Cash Return
3.0%
Cap rate
0.7%
Rent to Value Ratio
92 out of 116 properties for sale in 33483
Limited Results Shown
Create a free account, or log in to reveal all property listings and enjoy the complete experience.
Active
$1,250,000
3
bds
|
3
ba
|
2,103
sqft
|
built
2017
1015 Phillips Rd, Delray Beach, FL 33483
$-4,619
Cash flow
-19.3%
Cash-on-Cash Return
1.7%
Cap rate
0.4%
Rent to Value Ratio
Active
$529,000
2
bds
|
2
ba
|
1,092
sqft
|
built
1975
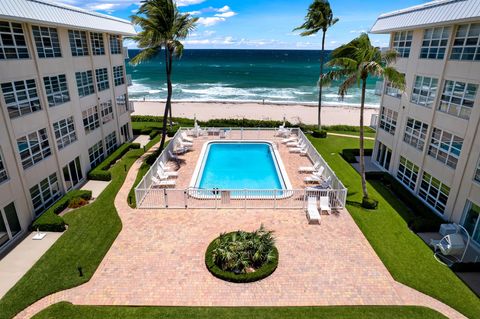
1 Harbourside Dr, Delray Beach, FL 33483
$-1,492
Cash flow
-14.7%
Cash-on-Cash Return
2.8%
Cap rate
0.7%
Rent to Value Ratio
Active
$489,000
3
bds
|
3
ba
|
1,440
sqft
|
built
1996
831 Kokomo Key Ln, Delray Beach, FL 33483
$-1,376
Cash flow
-14.7%
Cash-on-Cash Return
2.8%
Cap rate
0.7%
Rent to Value Ratio
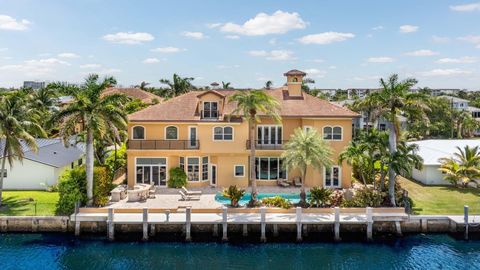
Active
$4,950,000
5
bds
|
7
ba
|
6,079
sqft
|
built
2007
929 Banyan Dr, Delray Beach, FL 33483
$-25,341
Cash flow
-26.7%
Cash-on-Cash Return
0.0%
Cap rate
0.2%
Rent to Value Ratio
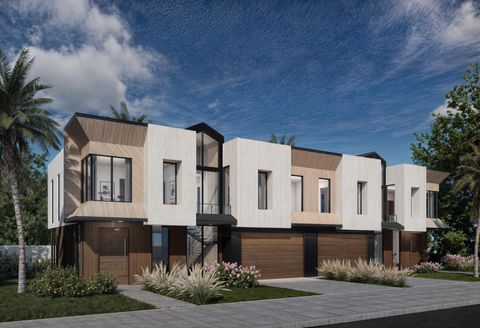
Active
$3,750,000
4
bds
|
5
ba
|
3,055
sqft
|
built
2026
801 Bond Way, Delray Beach, FL 33483
$-18,716
Cash flow
-26.0%
Cash-on-Cash Return
0.2%
Cap rate
0.1%
Rent to Value Ratio
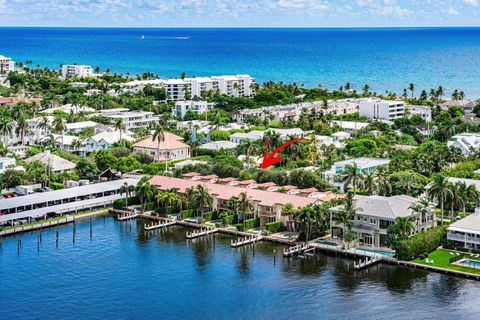
Active
$4,200,000
4
bds
|
3
ba
|
3,166
sqft
|
built
1998
256 Venetian Dr, Delray Beach, FL 33483
$-17,081
Cash flow
-21.2%
Cash-on-Cash Return
1.3%
Cap rate
0.2%
Rent to Value Ratio
Active
$485,000
2
bds
|
2
ba
|
1,092
sqft
|
built
1982
1 Harbourside Dr, Delray Beach, FL 33483
$-1,282
Cash flow
-13.8%
Cash-on-Cash Return
3.0%
Cap rate
0.7%
Rent to Value Ratio
Active
$4,275,000
5
bds
|
6
ba
|
3,813
sqft
|
built
1992
917 Iris Dr, Delray Beach, FL 33483
$-17,586
Cash flow
-21.5%
Cash-on-Cash Return
1.2%
Cap rate
0.2%
Rent to Value Ratio
Active
$3,750,000
3
bds
|
4
ba
|
2,711
sqft
|
built
2022
925 Allamanda Dr, Delray Beach, FL 33483
$-16,244
Cash flow
-22.6%
Cash-on-Cash Return
0.9%
Cap rate
0.2%
Rent to Value Ratio
Active
$499,900
2
bds
|
2
ba
|
1,400
sqft
|
built
1980
1010 NE 8th Ave, Delray Beach, FL 33483
$-1,753
Cash flow
-18.3%
Cash-on-Cash Return
1.9%
Cap rate
0.6%
Rent to Value Ratio
Active
$5,577,700
4
bds
|
3
ba
|
2,775
sqft
|
built
2009
400 S Ocean Blvd, Delray Beach, FL 33483
$-30,908
Cash flow
-28.9%
Cash-on-Cash Return
-0.5%
Cap rate
0.2%
Rent to Value Ratio
Active
$2,495,000
3
bds
|
3
ba
|
2,095
sqft
|
built
1982
800 Andrews Ave, Delray Beach, FL 33483
$-10,168
Cash flow
-21.3%
Cash-on-Cash Return
1.3%
Cap rate
0.4%
Rent to Value Ratio
Active
$2,800,000
3
bds
|
3
ba
|
2,257
sqft
|
built
1987
483 Pelican Way, Delray Beach, FL 33483
$-9,183
Cash flow
-17.1%
Cash-on-Cash Return
2.2%
Cap rate
0.4%
Rent to Value Ratio
Active
$34,000,000
7
bds
|
10
ba
|
9,761
sqft
|
built
1994
1171 S Ocean Blvd, Delray Beach, FL 33483
$-194,851
Cash flow
-29.9%
Cash-on-Cash Return
-0.7%
Cap rate
0.0%
Rent to Value Ratio
Active
$24,995,000
9
bds
|
10
ba
|
6,924
sqft
|
built
1928
1443 N Ocean Blvd, Delray Beach, FL 33483
$-125,766
Cash flow
-26.3%
Cash-on-Cash Return
0.1%
Cap rate
0.0%
Rent to Value Ratio
Active
$749,900
4
bds
|
4
ba
|
2,372
sqft
|
built
2008
217 N Latitude Cir, Delray Beach, FL 33483
$-1,545
Cash flow
-10.7%
Cash-on-Cash Return
3.7%
Cap rate
0.7%
Rent to Value Ratio
Active
$1,075,000
2
bds
|
3
ba
|
1,795
sqft
|
built
2005
185 NE 4th Ave, Delray Beach, FL 33483
$-2,965
Cash flow
-14.4%
Cash-on-Cash Return
2.8%
Cap rate
0.7%
Rent to Value Ratio
Active
$14,995,000
6
bds
|
9
ba
|
5,550
sqft
|
built
1978
201 Palm Trl, Delray Beach, FL 33483
$-74,798
Cash flow
-26.0%
Cash-on-Cash Return
0.2%
Cap rate
0.0%
Rent to Value Ratio
Active
$899,000
3
bds
|
3
ba
|
1,908
sqft
|
built
1986
3501 Harbor Cir, Delray Beach, FL 33483
$-1,855
Cash flow
-10.8%
Cash-on-Cash Return
3.7%
Cap rate
0.6%
Rent to Value Ratio
Active
$437,500
2
bds
|
2
ba
|
1,135
sqft
|
built
1985
100 Pelican Pointe Dr, Delray Beach, FL 33483
$-1,659
Cash flow
-19.8%
Cash-on-Cash Return
1.6%
Cap rate
0.6%
Rent to Value Ratio
Active
$479,000
2
bds
|
3
ba
|
1,184
sqft
|
built
1996
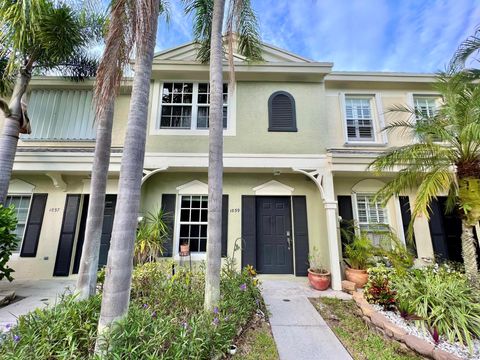
825 Kokomo Key Ln, Delray Beach, FL 33483
$-1,385
Cash flow
-15.1%
Cash-on-Cash Return
2.7%
Cap rate
0.6%
Rent to Value Ratio
Active
$1,749,999
3
bds
|
3
ba
|
2,204
sqft
|
built
1972
1060 S Ocean Blvd, Delray Beach, FL 33483
$-5,494
Cash flow
-16.4%
Cash-on-Cash Return
2.4%
Cap rate
0.5%
Rent to Value Ratio
Active
$599,900
1
bds
|
1
ba
|
800
sqft
|
built
1971
3851 N Ocean Blvd, Delray Beach, FL 33483
$-2,389
Cash flow
-20.8%
Cash-on-Cash Return
1.4%
Cap rate
0.6%
Rent to Value Ratio
Active
$499,000
2
bds
|
3
ba
|
1,300
sqft
|
built
1997
1039 Kokomo Key Ln, Delray Beach, FL 33483
$-1,510
Cash flow
-15.8%
Cash-on-Cash Return
2.5%
Cap rate
0.6%
Rent to Value Ratio
Active
$890,000
2
bds
|
3
ba
|
1,435
sqft
|
built
2005
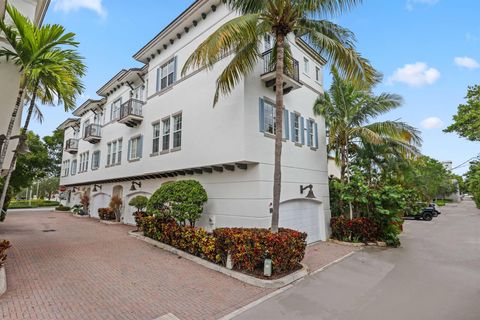
285 SE 6th Ave, Delray Beach, FL 33483
$-2,646
Cash flow
-15.5%
Cash-on-Cash Return
2.6%
Cap rate
0.6%
Rent to Value Ratio
Active
$6,500,000
3
bds
|
3
ba
|
2,317
sqft
|
built
1941
2 Fisher Ln, Delray Beach, FL 33483
$-33,505
Cash flow
-26.9%
Cash-on-Cash Return
0.0%
Cap rate
0.1%
Rent to Value Ratio
Active
$570,000
2
bds
|
2
ba
|
1,092
sqft
|
built
1979
1 Harbourside Dr, Delray Beach, FL 33483
$-1,560
Cash flow
-14.3%
Cash-on-Cash Return
2.9%
Cap rate
0.7%
Rent to Value Ratio
Active
$4,995,000
7
bds
|
9
ba
|
6,907
sqft
|
built
2008
932 Banyan Dr, Delray Beach, FL 33483
$-22,727
Cash flow
-23.7%
Cash-on-Cash Return
0.7%
Cap rate
0.2%
Rent to Value Ratio
Active
$1,950,000
3
bds
|
3
ba
|
1,764
sqft
|
built
1988
802 Andrews Ave, Delray Beach, FL 33483
$-5,235
Cash flow
-14.0%
Cash-on-Cash Return
2.9%
Cap rate
0.5%
Rent to Value Ratio
Active
$779,000
2
bds
|
2
ba
|
1,028
sqft
|
built
1957
100 N Ocean Blvd, Delray Beach, FL 33483
$-2,254
Cash flow
-15.1%
Cash-on-Cash Return
2.7%
Cap rate
0.7%
Rent to Value Ratio
Active
$1,025,000
4
bds
|
4
ba
|
2,594
sqft
|
built
2005
1028 E Heritage Club Cir, Delray Beach, FL 33483
$-3,567
Cash flow
-18.2%
Cash-on-Cash Return
2.0%
Cap rate
0.5%
Rent to Value Ratio
Active
$615,000
3
bds
|
2
ba
|
2,165
sqft
|
built
1973
2000 S Ocean Blvd, Delray Beach, FL 33483
$-2,289
Cash flow
-19.4%
Cash-on-Cash Return
1.7%
Cap rate
0.8%
Rent to Value Ratio
Active
$1,250,000
2
bds
|
2
ba
|
1,544
sqft
|
built
1964
1710 S Ocean Blvd, Delray Beach, FL 33483
$-3,347
Cash flow
-14.0%
Cash-on-Cash Return
2.9%
Cap rate
0.6%
Rent to Value Ratio
Active
$610,000
2
bds
|
2
ba
|
1,482
sqft
|
built
1970
2200 S Ocean Blvd, Delray Beach, FL 33483
$-1,629
Cash flow
-13.9%
Cash-on-Cash Return
2.9%
Cap rate
0.8%
Rent to Value Ratio
Active
$3,299,000
4
bds
|
4
ba
|
3,443
sqft
|
built
1999
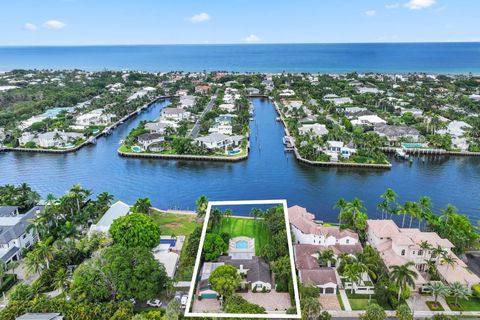
923 Hyacinth Dr, Delray Beach, FL 33483
$-11,637
Cash flow
-18.4%
Cash-on-Cash Return
1.9%
Cap rate
0.3%
Rent to Value Ratio
Active
$899,999
2
bds
|
2
ba
|
935
sqft
|
built
1948
826 SE 4th Ave, Delray Beach, FL 33483
$-2,278
Cash flow
-13.2%
Cash-on-Cash Return
3.1%
Cap rate
0.5%
Rent to Value Ratio
Active
$799,000
2
bds
|
2
ba
|
1,265
sqft
|
built
1965
1015 Ingraham Ave, Delray Beach, FL 33483
$-2,719
Cash flow
-17.8%
Cash-on-Cash Return
2.1%
Cap rate
0.6%
Rent to Value Ratio
Active
$765,000
2
bds
|
3
ba
|
1,512
sqft
|
built
1987
240 Captains Walk, Delray Beach, FL 33483
$-2,338
Cash flow
-15.9%
Cash-on-Cash Return
2.5%
Cap rate
0.7%
Rent to Value Ratio