33496 Investment Properties for Sale
Browse homes for sale and investment properties in 33496. Refine your search by price, property type, or more.
Best cash flowing properties in 33496
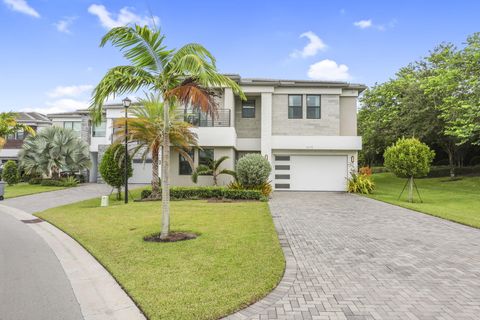
Active
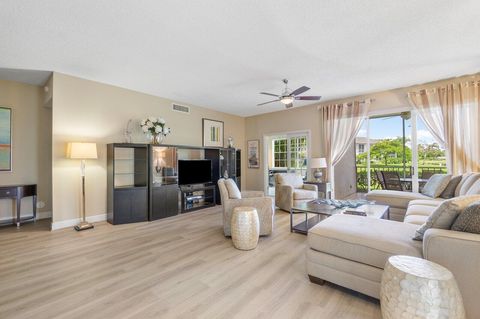
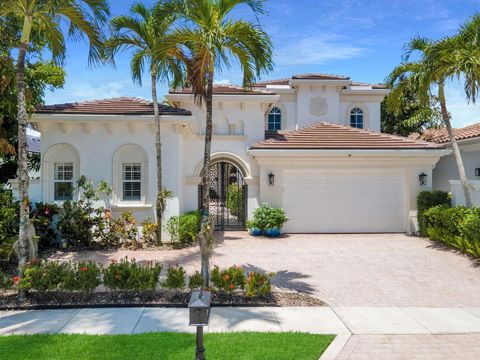
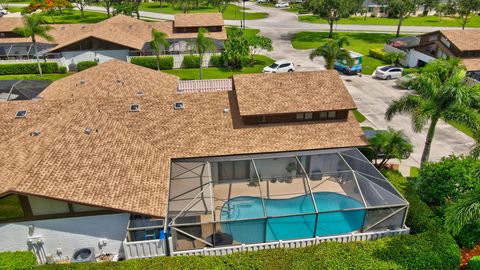
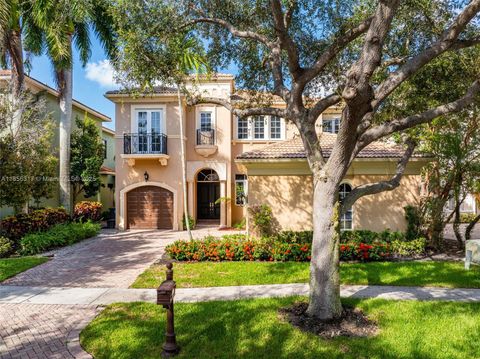
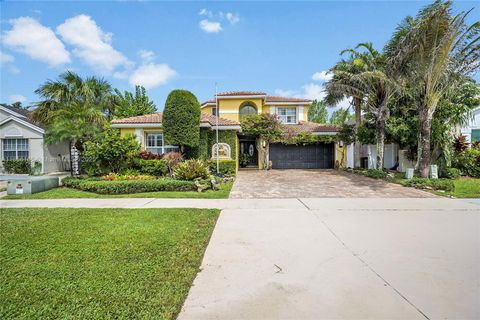
$599,000
3
bds
|
2
ba
|
1,751
sqft
|
built
1989
5070 Lake Catalina Dr, Boca Raton, FL 33496
$1,574
Cash flow
13.7%
Cash-on-Cash Return
9.3%
Cap rate
1.3%
Rent to Value Ratio
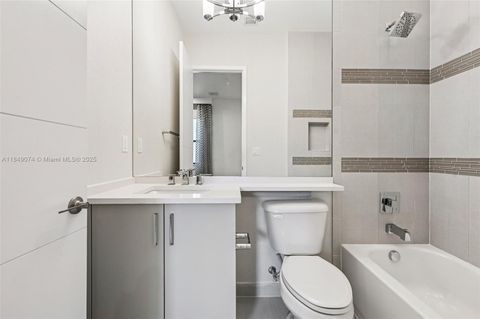
Active
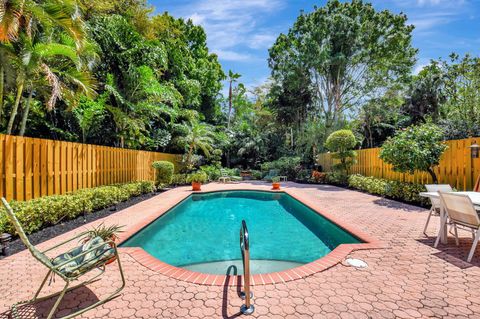
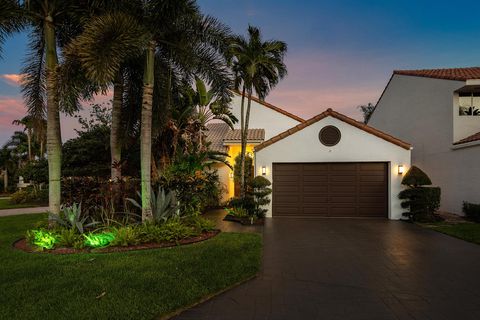
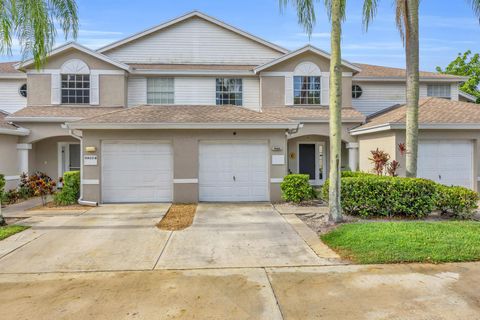
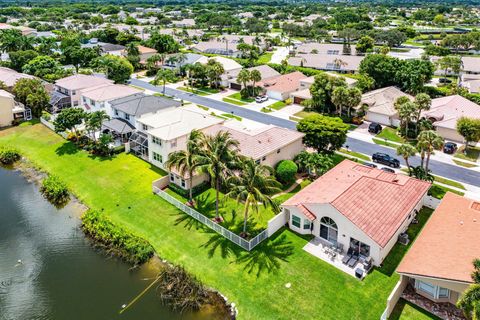
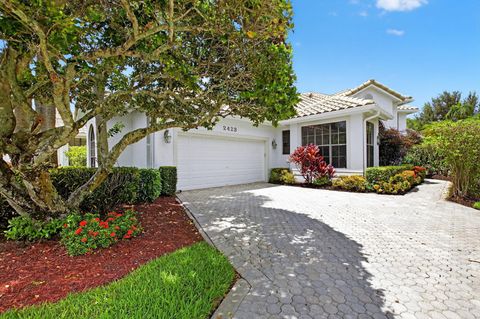
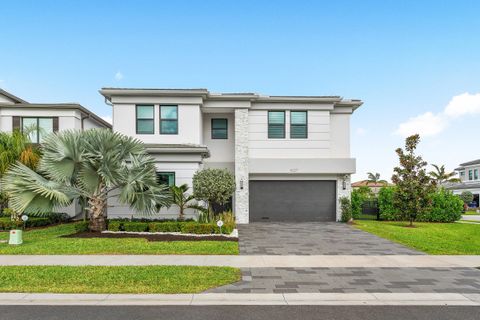
$419,000
3
bds
|
3
ba
|
2,429
sqft
|
built
1992
2462 NW 66th Dr, Boca Raton, FL 33496
$265
Cash flow
3.3%
Cash-on-Cash Return
6.9%
Cap rate
1.2%
Rent to Value Ratio
132 out of 137 properties for sale in 33496
Limited Results Shown
Create a free account, or log in to reveal all property listings and enjoy the complete experience.
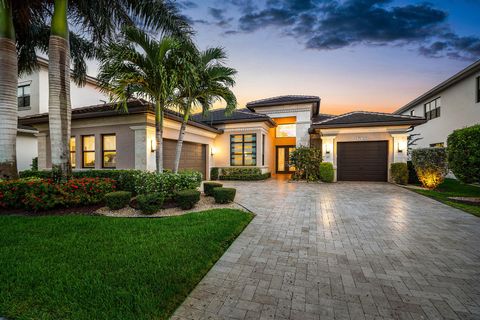
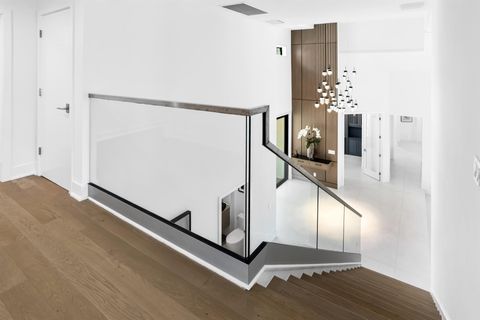
Active
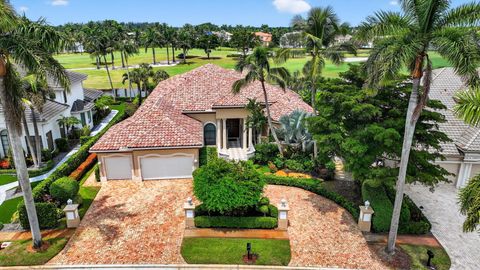
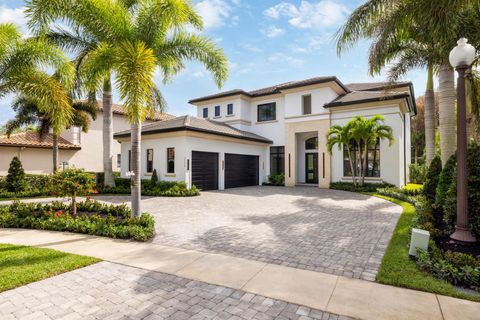
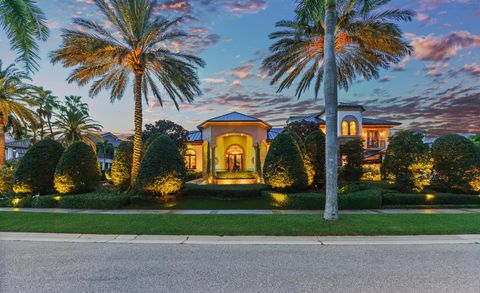
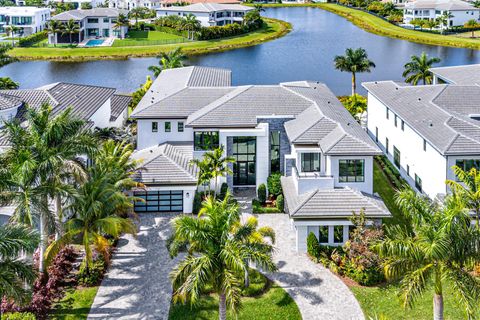
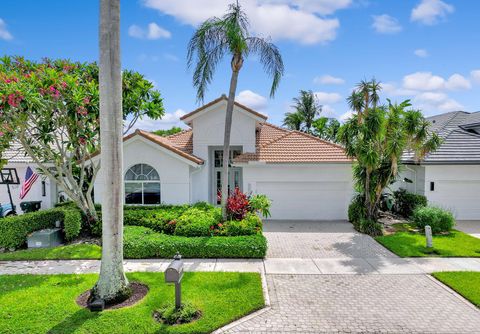
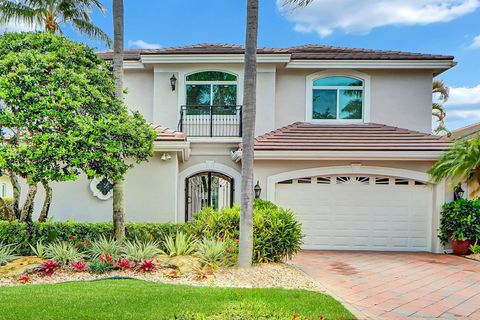
$3,925,000
3
bds
|
5
ba
|
4,266
sqft
|
built
1999
7625 Fenwick Pl, Boca Raton, FL 33496
$-17,193
Cash flow
-22.9%
Cash-on-Cash Return
0.9%
Cap rate
0.2%
Rent to Value Ratio
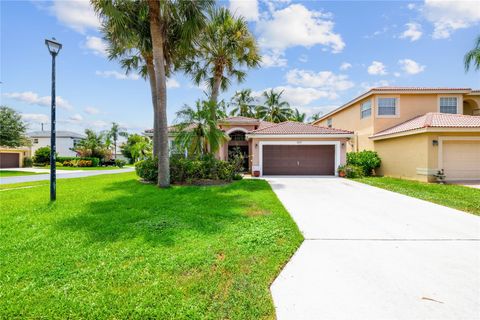
Active
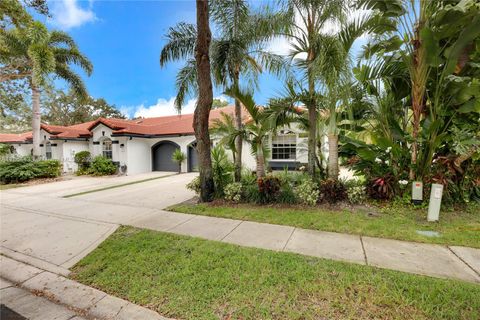
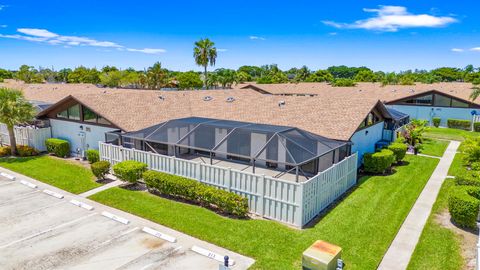
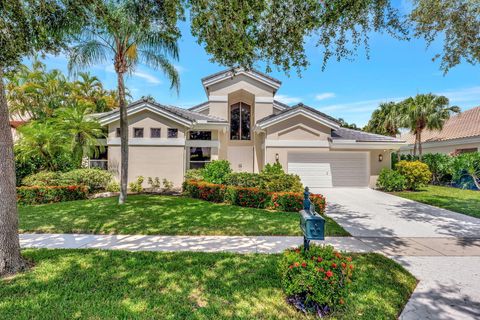
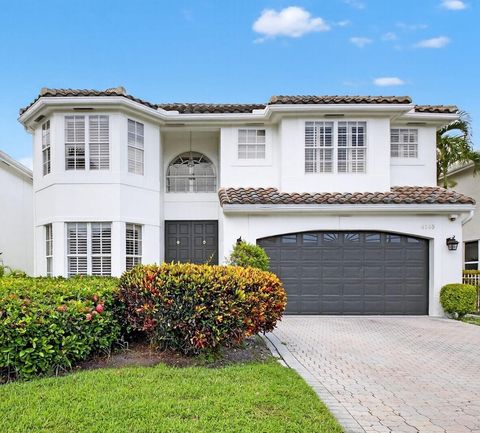
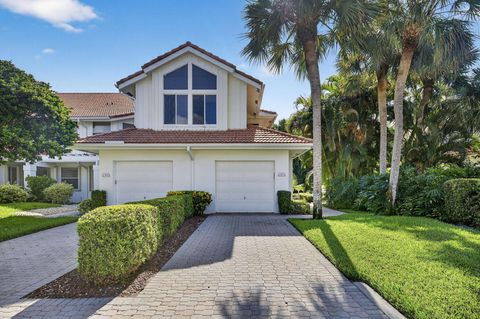
$555,000
3
bds
|
2
ba
|
1,728
sqft
|
built
1997
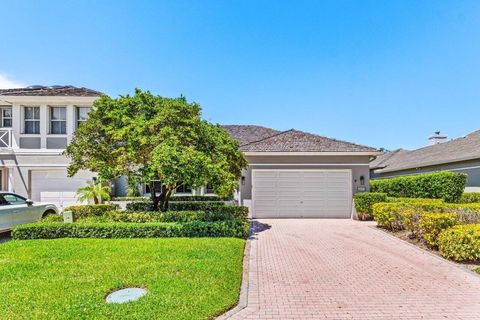
8273 Via Di Veneto, Boca Raton, FL 33496
$-1,049
Cash flow
-9.9%
Cash-on-Cash Return
3.9%
Cap rate
0.7%
Rent to Value Ratio
Active
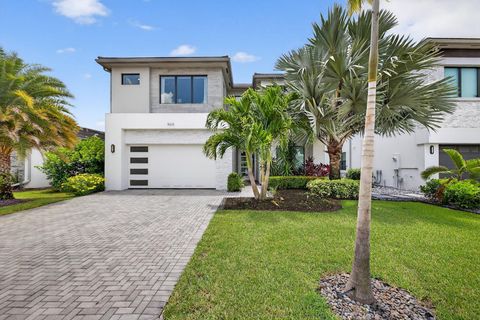
$950,000
3
bds
|
2
ba
|
1,965
sqft
|
built
1993
4023 NW 58th St, Boca Raton, FL 33496
$-993
Cash flow
-5.5%
Cash-on-Cash Return
4.9%
Cap rate
0.8%
Rent to Value Ratio
Active
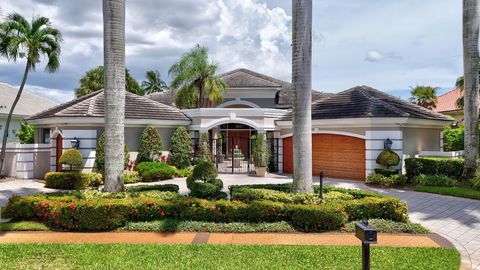
$699,000
3
bds
|
3
ba
|
2,709
sqft
|
built
2000
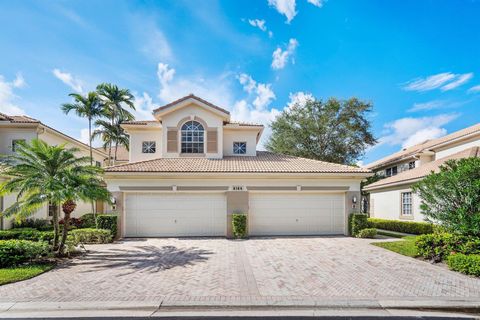
6184 Island Bnd, Boca Raton, FL 33496
$-1,528
Cash flow
-11.4%
Cash-on-Cash Return
3.5%
Cap rate
0.7%
Rent to Value Ratio
Active
$425,000
3
bds
|
3
ba
|
1,438
sqft
|
built
1991
3143 Clint Moore Rd, Boca Raton, FL 33496
$-1,415
Cash flow
-17.4%
Cash-on-Cash Return
2.2%
Cap rate
0.8%
Rent to Value Ratio
Active
$3,000,000
5
bds
|
6
ba
|
5,545
sqft
|
built
2004
17593 Middle Lake Dr, Boca Raton, FL 33496
$-11,763
Cash flow
-20.5%
Cash-on-Cash Return
1.4%
Cap rate
0.3%
Rent to Value Ratio
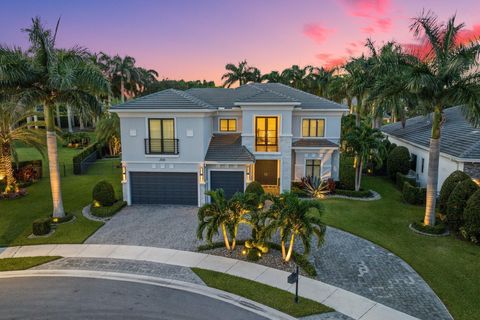
Active
$3,595,000
6
bds
|
7
ba
|
4,621
sqft
|
built
1999
6483 Enclave Way, Boca Raton, FL 33496
$-17,064
Cash flow
-24.8%
Cash-on-Cash Return
0.5%
Cap rate
0.2%
Rent to Value Ratio
Active
$1,079,000
3
bds
|
3
ba
|
2,150
sqft
|
built
1989
17128 Newport Club Dr, Boca Raton, FL 33496
$-3,243
Cash flow
-15.7%
Cash-on-Cash Return
2.5%
Cap rate
0.5%
Rent to Value Ratio
Active
$3,495,000
5
bds
|
6
ba
|
5,044
sqft
|
built
2017
17776 Key Vista Way, Boca Raton, FL 33496
$-13,924
Cash flow
-20.8%
Cash-on-Cash Return
1.4%
Cap rate
0.3%
Rent to Value Ratio
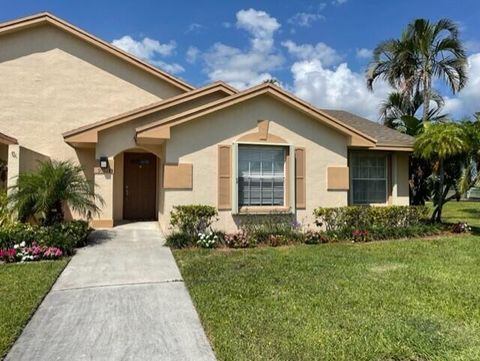
Active
$450,000
3
bds
|
2
ba
|
1,276
sqft
|
built
1985
9843 Boca Gardens Trl, Boca Raton, FL 33496
$-989
Cash flow
-11.5%
Cash-on-Cash Return
3.5%
Cap rate
0.7%
Rent to Value Ratio
Active
$6,950,000
5
bds
|
7
ba
|
6,904
sqft
|
built
2012
7131 Ayrshire Ln, Boca Raton, FL 33496
$-31,786
Cash flow
-23.9%
Cash-on-Cash Return
0.7%
Cap rate
0.1%
Rent to Value Ratio
Active
$1,795,000
4
bds
|
5
ba
|
2,996
sqft
|
built
1991
6039 NW 31st Ter, Boca Raton, FL 33496
$-5,431
Cash flow
-15.8%
Cash-on-Cash Return
2.5%
Cap rate
0.4%
Rent to Value Ratio
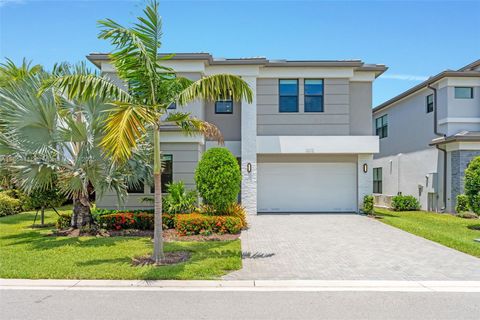
Active
$2,300,000
5
bds
|
6
ba
|
3,807
sqft
|
built
2020
8618 Tower Bridge Ct, Boca Raton, FL 33496
$-7,181
Cash flow
-16.3%
Cash-on-Cash Return
2.4%
Cap rate
0.4%
Rent to Value Ratio
Active
$3,675,000
3
bds
|
5
ba
|
4,504
sqft
|
built
1993
6981 Lions Head Ln, Boca Raton, FL 33496
$-15,948
Cash flow
-22.6%
Cash-on-Cash Return
0.9%
Cap rate
0.2%
Rent to Value Ratio
Active
$549,000
3
bds
|
3
ba
|
1,325
sqft
|
built
1986
9676 Boca Gardens Cir N, Boca Raton, FL 33496
$-767
Cash flow
-7.3%
Cash-on-Cash Return
4.5%
Cap rate
0.7%
Rent to Value Ratio
Active
$470,000
3
bds
|
3
ba
|
1,845
sqft
|
built
1991
9082 Boca Gardens Pkwy, Boca Raton, FL 33496
$-1,242
Cash flow
-13.8%
Cash-on-Cash Return
3.0%
Cap rate
0.7%
Rent to Value Ratio
Active
$6,650,000
6
bds
|
9
ba
|
8,125
sqft
|
built
2021
17151 Brulee Breeze Way, Boca Raton, FL 33496
$-32,787
Cash flow
-25.7%
Cash-on-Cash Return
0.2%
Cap rate
0.2%
Rent to Value Ratio
Active
$895,000
4
bds
|
3
ba
|
2,139
sqft
|
built
1994
4145 NW 58th Ln, Boca Raton, FL 33496
$-995
Cash flow
-5.8%
Cash-on-Cash Return
4.8%
Cap rate
0.9%
Rent to Value Ratio
Active
$1,849,999
5
bds
|
6
ba
|
4,185
sqft
|
built
2005
17771 Lake Azure Way, Boca Raton, FL 33496
$-4,908
Cash flow
-13.8%
Cash-on-Cash Return
3.0%
Cap rate
0.6%
Rent to Value Ratio
Active
$899,995
4
bds
|
4
ba
|
2,533
sqft
|
built
1995
9511 Fox Trot Ln, Boca Raton, FL 33496
$-965
Cash flow
-5.6%
Cash-on-Cash Return
4.9%
Cap rate
0.7%
Rent to Value Ratio
Active
$879,999
2
bds
|
3
ba
|
1,910
sqft
|
built
1988
2423 NW 63rd St, Boca Raton, FL 33496
$-2,339
Cash flow
-13.9%
Cash-on-Cash Return
3.0%
Cap rate
0.6%
Rent to Value Ratio
Active
$1,849,000
3
bds
|
3
ba
|
2,321
sqft
|
built
1995
4158 NW 53rd St, Boca Raton, FL 33496
$-6,666
Cash flow
-18.8%
Cash-on-Cash Return
1.8%
Cap rate
0.3%
Rent to Value Ratio
Active
$860,000
4
bds
|
4
ba
|
2,133
sqft
|
built
1989
9398 Aegean Dr, Boca Raton, FL 33496
$-626
Cash flow
-3.8%
Cash-on-Cash Return
5.3%
Cap rate
0.7%
Rent to Value Ratio
Active
$2,450,000
5
bds
|
7
ba
|
4,484
sqft
|
built
2021
8227 Oceanus Dr, Boca Raton, FL 33496
$-8,041
Cash flow
-17.1%
Cash-on-Cash Return
2.2%
Cap rate
0.4%
Rent to Value Ratio

Active
$620,000
3
bds
|
2
ba
|
1,577
sqft
|
built
1986
9978 Moss Pond Dr, Boca Raton, FL 33496
$-1,253
Cash flow
-10.5%
Cash-on-Cash Return
3.7%
Cap rate
0.6%
Rent to Value Ratio
Active
$2,199,000
6
bds
|
5
ba
|
4,314
sqft
|
built
1996
6521 NW 39th Ter, Boca Raton, FL 33496
$-9,019
Cash flow
-21.4%
Cash-on-Cash Return
1.2%
Cap rate
0.3%
Rent to Value Ratio
Active
$675,000
3
bds
|
4
ba
|
2,079
sqft
|
built
1990
5800 NW 24th Ave, Boca Raton, FL 33496
$-2,351
Cash flow
-18.2%
Cash-on-Cash Return
2.0%
Cap rate
0.6%
Rent to Value Ratio
Active
$3,195,000
3
bds
|
4
ba
|
3,787
sqft
|
built
2019
17442 Rosella Rd, Boca Raton, FL 33496
$-14,331
Cash flow
-23.4%
Cash-on-Cash Return
0.8%
Cap rate
0.2%
Rent to Value Ratio
Active
$3,695,000
5
bds
|
6
ba
|
4,665
sqft
|
built
2019
2741 NW 70th Blvd, Boca Raton, FL 33496
$-15,856
Cash flow
-22.4%
Cash-on-Cash Return
1.0%
Cap rate
0.2%
Rent to Value Ratio
Active
$450,000
3
bds
|
2
ba
|
1,459
sqft
|
built
1987
9511 Boca Gardens Cir S, Boca Raton, FL 33496
$-885
Cash flow
-10.3%
Cash-on-Cash Return
3.8%
Cap rate
0.8%
Rent to Value Ratio
Active
$2,049,000
5
bds
|
7
ba
|
4,609
sqft
|
built
2023
17117 Teton River Rd, Boca Raton, FL 33496
$-5,747
Cash flow
-14.6%
Cash-on-Cash Return
2.8%
Cap rate
0.5%
Rent to Value Ratio
Active
$7,745,000
6
bds
|
7
ba
|
6,869
sqft
|
built
1986
18743 Long Lake Dr, Boca Raton, FL 33496
$-37,736
Cash flow
-25.4%
Cash-on-Cash Return
0.3%
Cap rate
0.1%
Rent to Value Ratio
Active
$2,075,000
5
bds
|
7
ba
|
4,609
sqft
|
built
2022
8115 Laurel Falls Dr, Boca Raton, FL 33496
$-8,857
Cash flow
-22.3%
Cash-on-Cash Return
1.0%
Cap rate
0.3%
Rent to Value Ratio
Active
$2,999,000
5
bds
|
7
ba
|
5,330
sqft
|
built
2021
8597 Dream Falls St, Boca Raton, FL 33496
$-13,396
Cash flow
-23.3%
Cash-on-Cash Return
0.8%
Cap rate
0.2%
Rent to Value Ratio
Active
$595,000
3
bds
|
2
ba
|
1,794
sqft
|
built
1996
18055 Mambo Dr, Boca Raton, FL 33496
$-1,280
Cash flow
-11.2%
Cash-on-Cash Return
3.6%
Cap rate
0.7%
Rent to Value Ratio
Active
$4,399,900
5
bds
|
7
ba
|
5,798
sqft
|
built
2022
2707 NW 75th St, Boca Raton, FL 33496
$-20,624
Cash flow
-24.5%
Cash-on-Cash Return
0.5%
Cap rate
0.2%
Rent to Value Ratio
Active
$949,000
3
bds
|
2
ba
|
1,838
sqft
|
built
1987
5326 NW 21st Ave, Boca Raton, FL 33496
$-3,250
Cash flow
-17.9%
Cash-on-Cash Return
2.0%
Cap rate
0.4%
Rent to Value Ratio
Active
$2,210,000
6
bds
|
6
ba
|
5,007
sqft
|
built
2016
6464 Bellamalfi St, Boca Raton, FL 33496
$-9,290
Cash flow
-21.9%
Cash-on-Cash Return
1.1%
Cap rate
0.4%
Rent to Value Ratio