33566 Investment Properties for Sale
Browse homes for sale and investment properties in 33566. Refine your search by price, property type, or more.
Best cash flowing properties in 33566
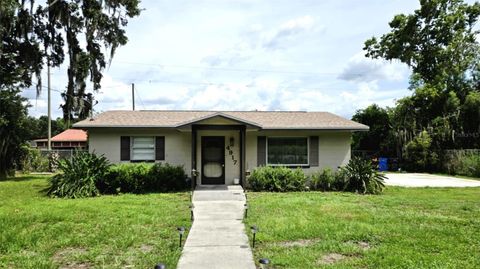
Active
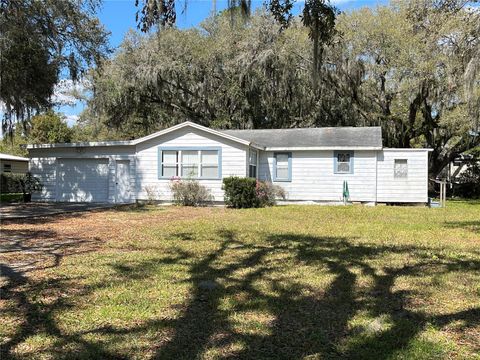
$229,900
2
bds
|
1
ba
|
1,076
sqft
|
built
1956
1502 S Wiggins Rd, Plant City, FL 33566
$88
Cash flow
2.0%
Cash-on-Cash Return
6.6%
Cap rate
0.8%
Rent to Value Ratio
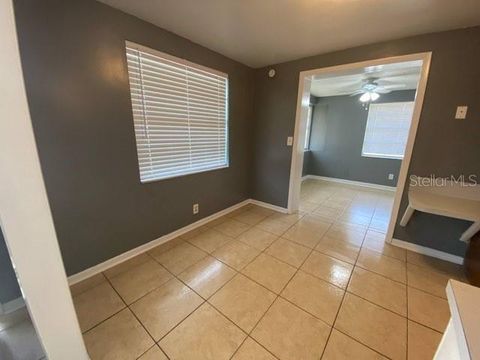
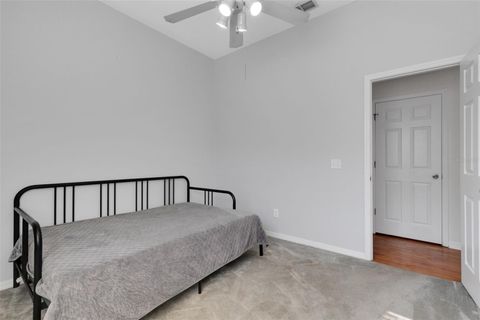
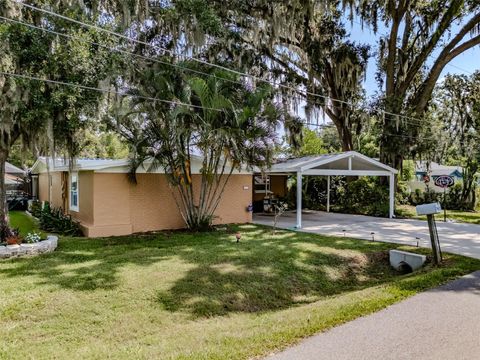
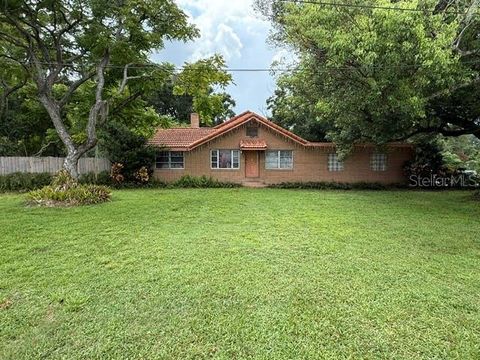
Active
$245,000
3
bds
|
2
ba
|
1,124
sqft
|
built
1969
300 Midwood Dr, Plant City, FL 33566
$-264
Cash flow
-5.6%
Cash-on-Cash Return
4.9%
Cap rate
0.7%
Rent to Value Ratio
21 out of 21 properties for sale in 33566
Limited Results Shown
Create a free account, or log in to reveal all property listings and enjoy the complete experience.
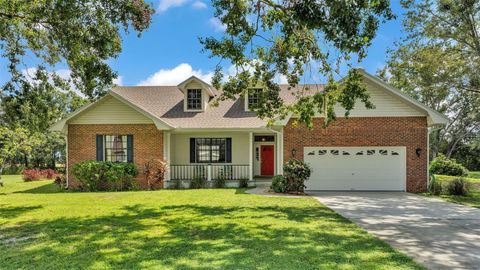
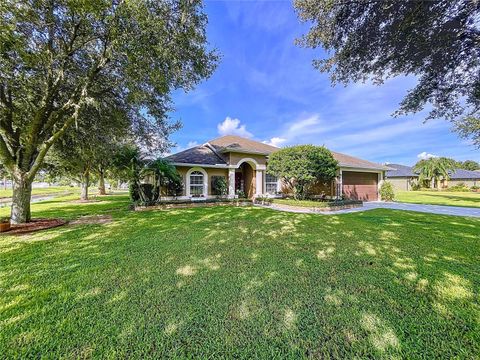
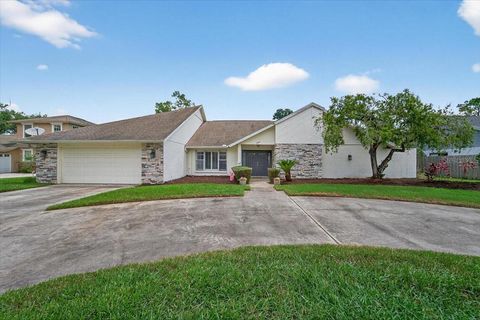
Active
$379,000
3
bds
|
2
ba
|
2,012
sqft
|
built
1990
4218 Kipling Ave, Plant City, FL 33566
$-332
Cash flow
-4.6%
Cash-on-Cash Return
5.1%
Cap rate
0.7%
Rent to Value Ratio
Active
$715,000
3
bds
|
2
ba
|
2,288
sqft
|
built
1998
3414 Futch Rd, Plant City, FL 33566
$-2,018
Cash flow
-14.7%
Cash-on-Cash Return
2.8%
Cap rate
0.5%
Rent to Value Ratio
Active
$599,900
4
bds
|
3
ba
|
2,822
sqft
|
built
1973
1219 Lindsey Rd, Plant City, FL 33566
$-1,386
Cash flow
-12.1%
Cash-on-Cash Return
3.4%
Cap rate
0.5%
Rent to Value Ratio
Active
$499,500
3
bds
|
2
ba
|
1,851
sqft
|
built
2011
3329 Little Acre Ln, Plant City, FL 33566
$-920
Cash flow
-9.6%
Cash-on-Cash Return
3.9%
Cap rate
0.6%
Rent to Value Ratio
Active
$284,900
2
bds
|
1
ba
|
936
sqft
|
built
1968
4917 Sydney Rd, Plant City, FL 33566
$-378
Cash flow
-6.9%
Cash-on-Cash Return
4.6%
Cap rate
0.6%
Rent to Value Ratio
Active
$415,000
3
bds
|
2
ba
|
1,898
sqft
|
built
1963
3812 Pennsylvania Ave, Plant City, FL 33566
$-358
Cash flow
-4.5%
Cash-on-Cash Return
5.1%
Cap rate
0.7%
Rent to Value Ratio
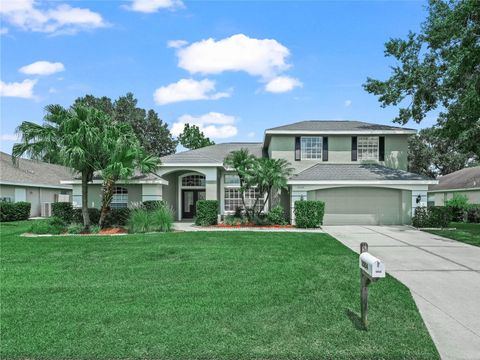
Active
$589,000
4
bds
|
4
ba
|
3,010
sqft
|
built
1981
2004 N Golfview Dr, Plant City, FL 33566
$-1,141
Cash flow
-10.1%
Cash-on-Cash Return
3.8%
Cap rate
0.5%
Rent to Value Ratio
Active
$550,000
5
bds
|
3
ba
|
3,044
sqft
|
built
1997
3504 Kilmer Dr, Plant City, FL 33566
$-796
Cash flow
-7.6%
Cash-on-Cash Return
4.4%
Cap rate
0.7%
Rent to Value Ratio
Active
$399,900
4
bds
|
2
ba
|
2,163
sqft
|
built
1933
3011 S Wiggins Rd, Plant City, FL 33566
$-671
Cash flow
-8.8%
Cash-on-Cash Return
4.1%
Cap rate
0.6%
Rent to Value Ratio
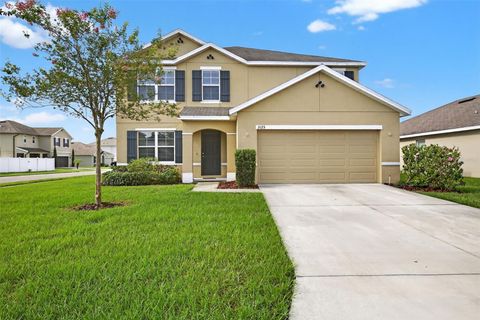
Active
$395,000
5
bds
|
3
ba
|
2,905
sqft
|
built
2018
3125 S Northview Rd, Plant City, FL 33566
$-440
Cash flow
-5.8%
Cash-on-Cash Return
4.8%
Cap rate
0.8%
Rent to Value Ratio
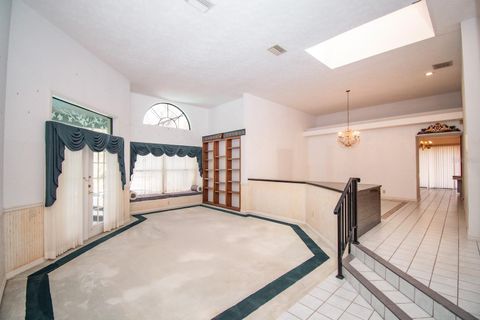
Active
$529,900
3
bds
|
2
ba
|
2,682
sqft
|
built
1986
2900 Hammock Dr, Plant City, FL 33566
$-1,329
Cash flow
-13.1%
Cash-on-Cash Return
3.1%
Cap rate
0.5%
Rent to Value Ratio
Active
$699,000
4
bds
|
4
ba
|
3,861
sqft
|
built
1983
2103 N Golfview Dr, Plant City, FL 33566
$-1,056
Cash flow
-7.9%
Cash-on-Cash Return
4.3%
Cap rate
0.6%
Rent to Value Ratio
Active
$515,000
3
bds
|
2
ba
|
2,132
sqft
|
built
2013
3411 Knoxville Pl, Plant City, FL 33566
$-1,033
Cash flow
-10.5%
Cash-on-Cash Return
3.7%
Cap rate
0.6%
Rent to Value Ratio
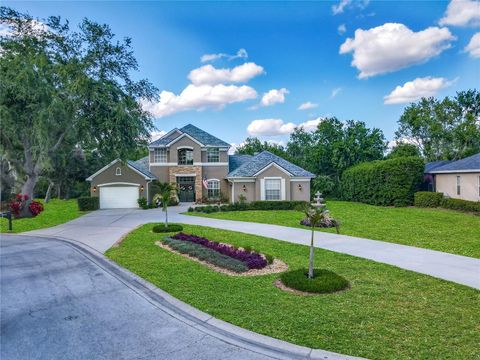
Active
$540,000
4
bds
|
3
ba
|
2,909
sqft
|
built
2010
2721 Walden Woods Dr, Plant City, FL 33566
$-1,176
Cash flow
-11.4%
Cash-on-Cash Return
3.5%
Cap rate
0.5%
Rent to Value Ratio
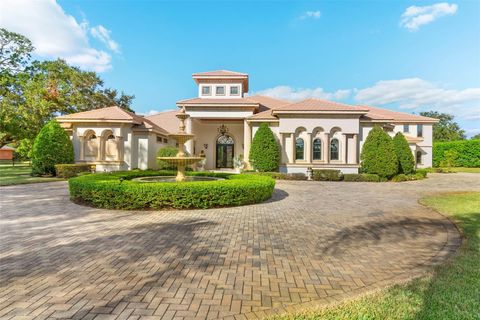
Active
$998,000
4
bds
|
4
ba
|
2,940
sqft
|
built
2000
3008 Sutton Woods Dr, Plant City, FL 33566
$-2,854
Cash flow
-14.9%
Cash-on-Cash Return
2.7%
Cap rate
0.5%
Rent to Value Ratio
Active
$539,000
4
bds
|
3
ba
|
3,119
sqft
|
built
1989
2910 Pine Club Dr, Plant City, FL 33566
$-660
Cash flow
-6.4%
Cash-on-Cash Return
4.7%
Cap rate
0.6%
Rent to Value Ratio
Active
$469,900
4
bds
|
3
ba
|
2,455
sqft
|
built
1993
2823 Clubhouse Dr, Plant City, FL 33566
$-535
Cash flow
-5.9%
Cash-on-Cash Return
4.8%
Cap rate
0.7%
Rent to Value Ratio
Active
$3,999,999
5
bds
|
8
ba
|
8,937
sqft
|
built
2009
3409 Carpel St, Plant City, FL 33566
$-17,484
Cash flow
-22.8%
Cash-on-Cash Return
0.9%
Cap rate
0.2%
Rent to Value Ratio

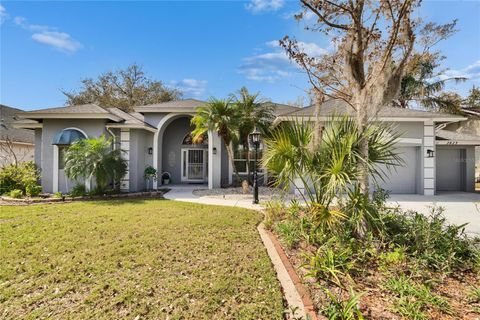
Active
$699,900
3
bds
|
2
ba
|
2,093
sqft
|
built
1982
2407 Medulla Rd, Plant City, FL 33566
$-1,539
Cash flow
-11.5%
Cash-on-Cash Return
3.5%
Cap rate
0.5%
Rent to Value Ratio