33837 Investment Properties for Sale
Browse homes for sale and investment properties in 33837. Refine your search by price, property type, or more.
Best cash flowing properties in 33837
Active
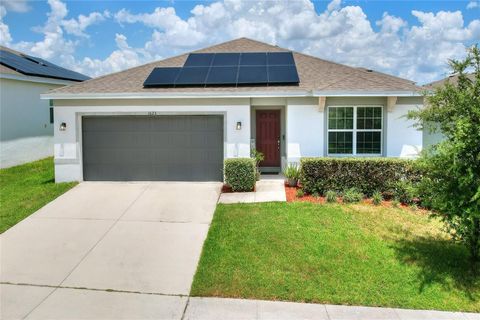
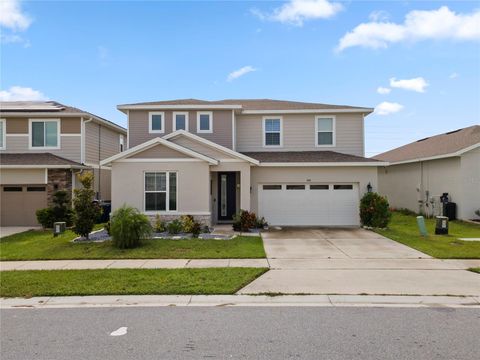
$359,000
4
bds
|
2
ba
|
1,865
sqft
|
built
2021
1623 Aspen Ave, Davenport, FL 33837
$-130
Cash flow
-1.9%
Cash-on-Cash Return
5.7%
Cap rate
0.7%
Rent to Value Ratio
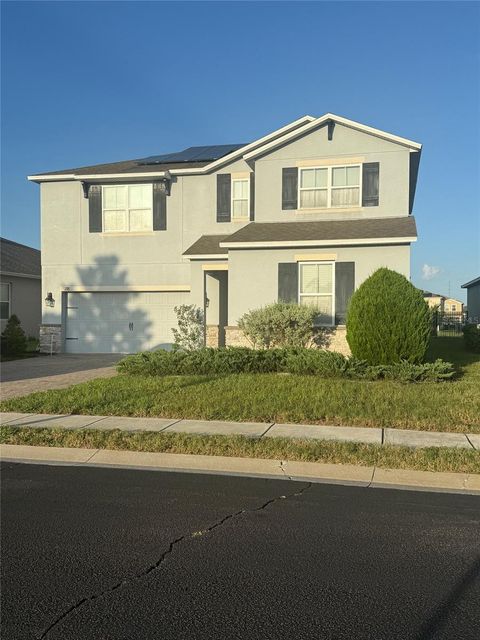
Active
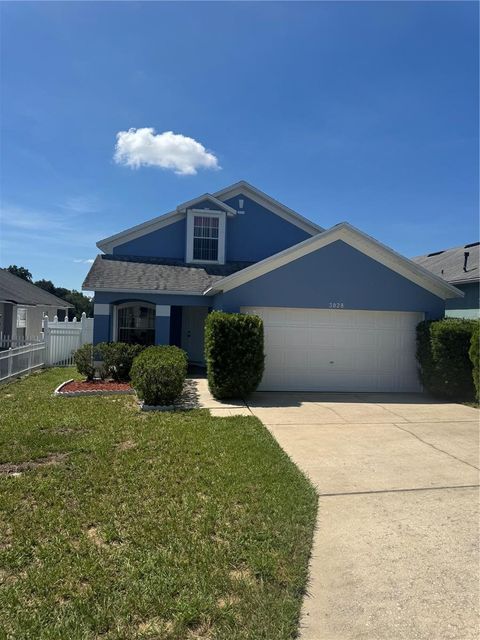
$329,999
4
bds
|
3
ba
|
1,551
sqft
|
built
2003
3028 Huntwicke Blvd, Davenport, FL 33837
$-301
Cash flow
-4.8%
Cash-on-Cash Return
5.1%
Cap rate
0.7%
Rent to Value Ratio
142 out of 226 properties for sale in 33837
Limited Results Shown
Create a free account, or log in to reveal all property listings and enjoy the complete experience.
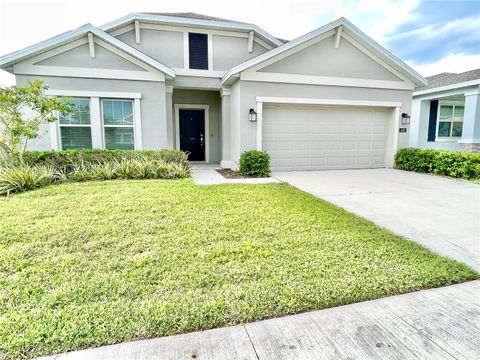
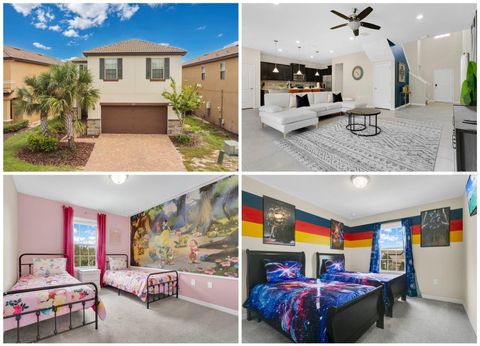
Active
$595,900
6
bds
|
6
ba
|
0
sqft
|
built
2016
381 Cabello Dr, Davenport, FL 33837
$-1,434
Cash flow
-12.6%
Cash-on-Cash Return
3.3%
Cap rate
0.6%
Rent to Value Ratio
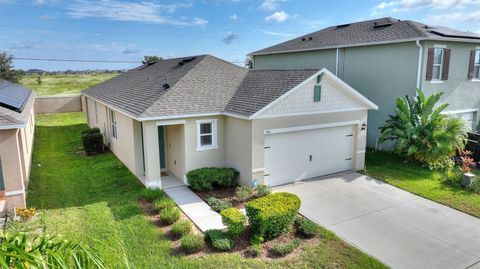
Active
$355,000
4
bds
|
2
ba
|
1,848
sqft
|
built
2023
648 Daring Dr, Davenport, FL 33837
$-635
Cash flow
-9.3%
Cash-on-Cash Return
4.0%
Cap rate
0.7%
Rent to Value Ratio
Active
$800,000
4
bds
|
5
ba
|
4,307
sqft
|
built
2006
488 Chelsea Ave, Davenport, FL 33837
$-2,447
Cash flow
-16.0%
Cash-on-Cash Return
2.5%
Cap rate
0.4%
Rent to Value Ratio
Active
$499,990
4
bds
|
3
ba
|
2,582
sqft
|
built
2004
518 Grand Reserve Dr, Davenport, FL 33837
$-714
Cash flow
-7.5%
Cash-on-Cash Return
4.4%
Cap rate
0.6%
Rent to Value Ratio
Active
$295,000
3
bds
|
2
ba
|
1,185
sqft
|
built
1999
212 Eckerd St, Davenport, FL 33837
$-470
Cash flow
-8.3%
Cash-on-Cash Return
4.2%
Cap rate
0.7%
Rent to Value Ratio
Active
$328,000
5
bds
|
4
ba
|
1,825
sqft
|
built
2005
504 Sunset View Dr, Davenport, FL 33837
$-569
Cash flow
-9.1%
Cash-on-Cash Return
4.1%
Cap rate
0.7%
Rent to Value Ratio
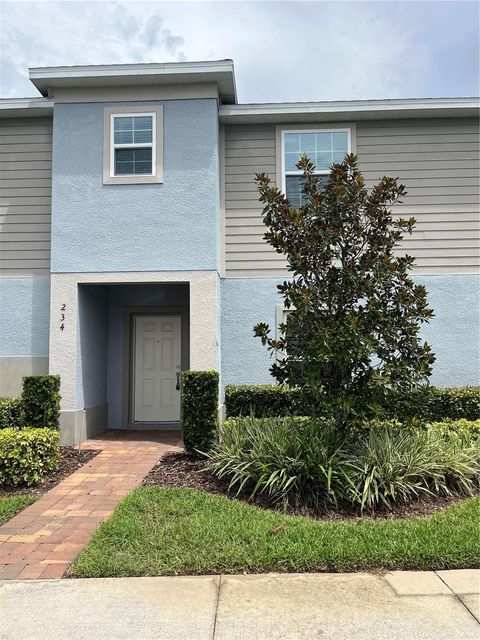
Active
$265,000
3
bds
|
3
ba
|
1,621
sqft
|
built
2019
234 Annabelle Way, Davenport, FL 33837
$-506
Cash flow
-10.0%
Cash-on-Cash Return
3.9%
Cap rate
0.8%
Rent to Value Ratio
Active
$295,000
3
bds
|
3
ba
|
1,758
sqft
|
built
2020
141 Feltrim Reserve Blvd, Davenport, FL 33837
$-305
Cash flow
-5.4%
Cash-on-Cash Return
4.9%
Cap rate
0.8%
Rent to Value Ratio
Active
$489,990
4
bds
|
3
ba
|
2,522
sqft
|
built
2017
4628 Cortland Dr, Davenport, FL 33837
$-1,135
Cash flow
-12.1%
Cash-on-Cash Return
3.4%
Cap rate
0.6%
Rent to Value Ratio
Active
$435,000
4
bds
|
2
ba
|
1,931
sqft
|
built
2023
223 Brave Rd, Davenport, FL 33837
$-1,034
Cash flow
-12.4%
Cash-on-Cash Return
3.3%
Cap rate
0.6%
Rent to Value Ratio
Active
$355,000
3
bds
|
2
ba
|
1,684
sqft
|
built
2014
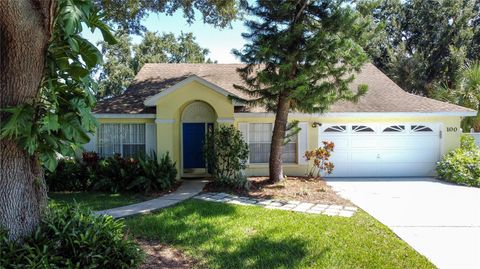
100 Bridgeford Crossing Blvd, Davenport, FL 33837
$-670
Cash flow
-9.8%
Cash-on-Cash Return
3.9%
Cap rate
0.6%
Rent to Value Ratio
Active
$315,000
3
bds
|
2
ba
|
1,403
sqft
|
built
2004
330 Graystone Blvd, Davenport, FL 33837
$-598
Cash flow
-9.9%
Cash-on-Cash Return
3.9%
Cap rate
0.6%
Rent to Value Ratio
Active
$445,000
4
bds
|
3
ba
|
1,922
sqft
|
built
2009
698 Brookeshire Dr, Davenport, FL 33837
$-1,076
Cash flow
-12.6%
Cash-on-Cash Return
3.2%
Cap rate
0.6%
Rent to Value Ratio
Active
$350,000
3
bds
|
2
ba
|
1,608
sqft
|
built
1990
177 Tortuga Ct, Davenport, FL 33837
$-658
Cash flow
-9.8%
Cash-on-Cash Return
3.9%
Cap rate
0.6%
Rent to Value Ratio
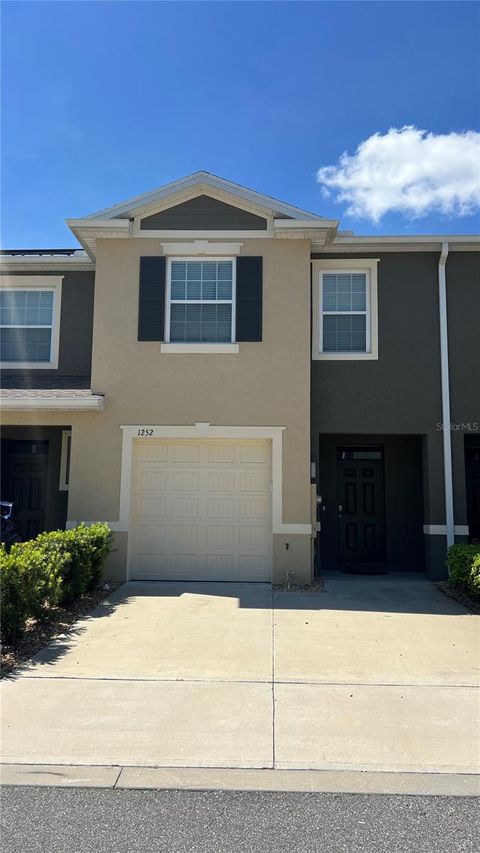
Active
$279,990
3
bds
|
3
ba
|
1,673
sqft
|
built
2024
1252 Yellow Finch Dr, Davenport, FL 33837
$-671
Cash flow
-12.5%
Cash-on-Cash Return
3.3%
Cap rate
0.6%
Rent to Value Ratio
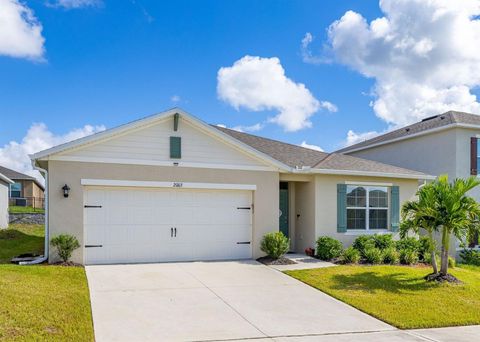
Active
$354,900
4
bds
|
2
ba
|
1,867
sqft
|
built
2022
2003 Chickasaw Blvd, Davenport, FL 33837
$-785
Cash flow
-11.5%
Cash-on-Cash Return
3.5%
Cap rate
0.7%
Rent to Value Ratio
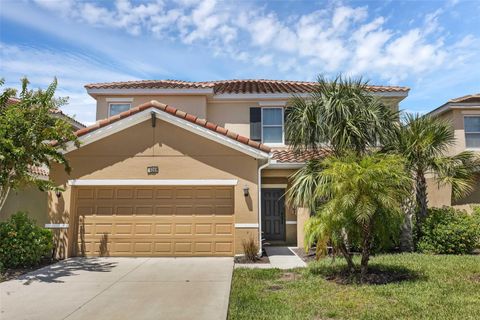
Active
$360,000
5
bds
|
3
ba
|
1,825
sqft
|
built
2005
238 Sunset View Dr, Davenport, FL 33837
$-494
Cash flow
-7.2%
Cash-on-Cash Return
4.5%
Cap rate
0.7%
Rent to Value Ratio
Active
$599,000
5
bds
|
5
ba
|
2,784
sqft
|
built
2018
5269 Oakbourne Ave, Davenport, FL 33837
$-1,732
Cash flow
-15.1%
Cash-on-Cash Return
2.7%
Cap rate
0.6%
Rent to Value Ratio
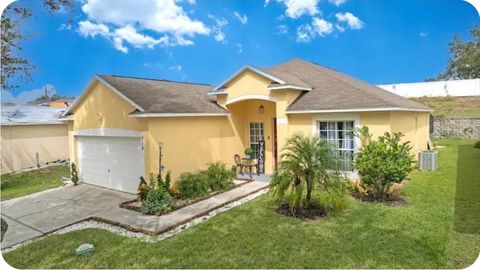
Active
$355,000
3
bds
|
2
ba
|
1,344
sqft
|
built
1993
100 Sunridge Woods Ct, Davenport, FL 33837
$-512
Cash flow
-7.5%
Cash-on-Cash Return
4.4%
Cap rate
0.7%
Rent to Value Ratio
Active
$309,000
3
bds
|
3
ba
|
1,810
sqft
|
built
2023
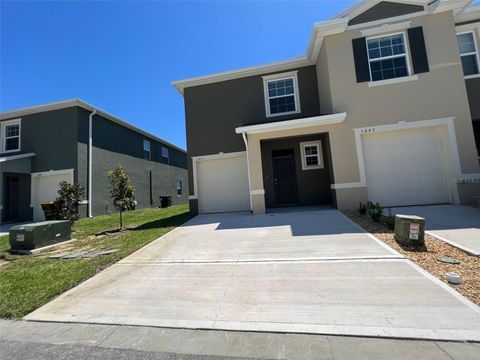
1041 Blue Jay Dr, Davenport, FL 33837
$-578
Cash flow
-9.8%
Cash-on-Cash Return
3.9%
Cap rate
0.7%
Rent to Value Ratio
Active
$519,000
3
bds
|
3
ba
|
2,261
sqft
|
built
2012
3590 Cortland Dr, Davenport, FL 33837
$-715
Cash flow
-7.2%
Cash-on-Cash Return
4.5%
Cap rate
0.6%
Rent to Value Ratio

Active
$459,900
5
bds
|
3
ba
|
0
sqft
|
built
2023
1292 Cascades Ave, Davenport, FL 33837
$-946
Cash flow
-10.7%
Cash-on-Cash Return
3.7%
Cap rate
0.7%
Rent to Value Ratio
Active
$709,900
6
bds
|
6
ba
|
3,270
sqft
|
built
2022
7656 Oakmoss Loop, Davenport, FL 33837
$-2,130
Cash flow
-15.7%
Cash-on-Cash Return
2.5%
Cap rate
0.6%
Rent to Value Ratio
Active
$419,000
5
bds
|
3
ba
|
2,244
sqft
|
built
2006
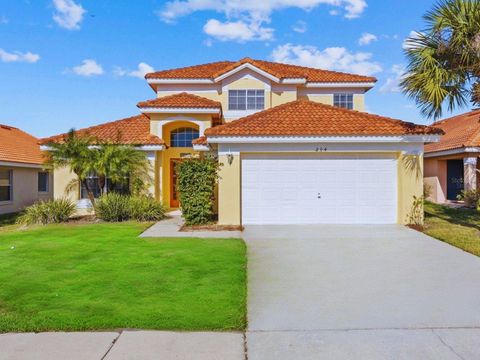
204 Paloma Dr, Davenport, FL 33837
$-827
Cash flow
-10.3%
Cash-on-Cash Return
3.8%
Cap rate
0.7%
Rent to Value Ratio

Active
$459,000
5
bds
|
5
ba
|
0
sqft
|
built
2010
148 Miro Dr, Davenport, FL 33837
$-937
Cash flow
-10.7%
Cash-on-Cash Return
3.7%
Cap rate
0.7%
Rent to Value Ratio

Active
$409,900
4
bds
|
4
ba
|
2,184
sqft
|
built
2017
4682 Terrasonesta Dr, Davenport, FL 33837
$-1,333
Cash flow
-17.0%
Cash-on-Cash Return
2.2%
Cap rate
0.6%
Rent to Value Ratio
Active
$410,000
5
bds
|
5
ba
|
2,076
sqft
|
built
2018
4651 Terrasonesta Dr, Davenport, FL 33837
$-1,117
Cash flow
-14.2%
Cash-on-Cash Return
2.9%
Cap rate
0.8%
Rent to Value Ratio

Active
$409,900
4
bds
|
3
ba
|
2,440
sqft
|
built
2022
824 Scrub Oak Hammock Rd, Davenport, FL 33837
$-599
Cash flow
-7.6%
Cash-on-Cash Return
4.4%
Cap rate
0.7%
Rent to Value Ratio
Active
$294,999
3
bds
|
2
ba
|
1,720
sqft
|
built
2022
1366 Yellow Finch Dr, Davenport, FL 33837
$-610
Cash flow
-10.8%
Cash-on-Cash Return
3.7%
Cap rate
0.7%
Rent to Value Ratio
Active
$350,000
3
bds
|
2
ba
|
912
sqft
|
built
1993
221 1st St, Davenport, FL 33837
$-663
Cash flow
-9.9%
Cash-on-Cash Return
3.9%
Cap rate
0.5%
Rent to Value Ratio
Active
$440,000
5
bds
|
4
ba
|
3,106
sqft
|
built
2022
1076 Sugarwood St, Davenport, FL 33837
$-1,025
Cash flow
-12.2%
Cash-on-Cash Return
3.4%
Cap rate
0.7%
Rent to Value Ratio
Active
$590,000
4
bds
|
3
ba
|
2,928
sqft
|
built
2018
276 Drayton Ave, Davenport, FL 33837
$-1,562
Cash flow
-13.8%
Cash-on-Cash Return
3.0%
Cap rate
0.5%
Rent to Value Ratio
Active
$509,000
5
bds
|
5
ba
|
2,492
sqft
|
built
2019
5481 Misty Oak Cir, Davenport, FL 33837
$-1,690
Cash flow
-17.3%
Cash-on-Cash Return
2.2%
Cap rate
0.6%
Rent to Value Ratio
Active
$300,000
3
bds
|
2
ba
|
1,529
sqft
|
built
2020
156 Eagleview Loop, Davenport, FL 33837
$-810
Cash flow
-14.1%
Cash-on-Cash Return
2.9%
Cap rate
0.7%
Rent to Value Ratio
Active
$269,500
3
bds
|
2
ba
|
1,170
sqft
|
built
1996
250 Belvoir Dr, Davenport, FL 33837
$-439
Cash flow
-8.5%
Cash-on-Cash Return
4.2%
Cap rate
0.7%
Rent to Value Ratio
Active
$301,000
4
bds
|
3
ba
|
1,930
sqft
|
built
2018
200 Primrose Dr, Davenport, FL 33837
$-625
Cash flow
-10.8%
Cash-on-Cash Return
3.7%
Cap rate
0.8%
Rent to Value Ratio
Active
$325,000
3
bds
|
2
ba
|
1,419
sqft
|
built
2014
1156 Mystery Cir, Davenport, FL 33837
$-580
Cash flow
-9.3%
Cash-on-Cash Return
4.0%
Cap rate
0.7%
Rent to Value Ratio
Active
$699,000
6
bds
|
5
ba
|
3,462
sqft
|
built
2014
4352 Acorn Ct, Davenport, FL 33837
$-1,961
Cash flow
-14.6%
Cash-on-Cash Return
2.8%
Cap rate
0.6%
Rent to Value Ratio