33837 Investment Properties for Sale
Browse homes for sale and investment properties in 33837. Refine your search by price, property type, or more.
Best cash flowing properties in 33837
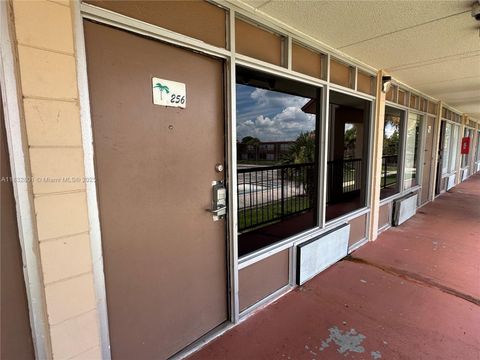
Active
$66,500
1
bds
|
1
ba
|
300
sqft
|
built
1999
43420 Highway 27, Davenport, FL 33837
$401
Cash flow
7.0%
Cash-on-Cash Return
7.2%
Cap rate
1.5%
Rent to Value Ratio
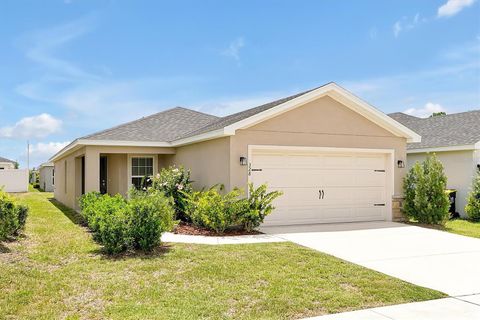
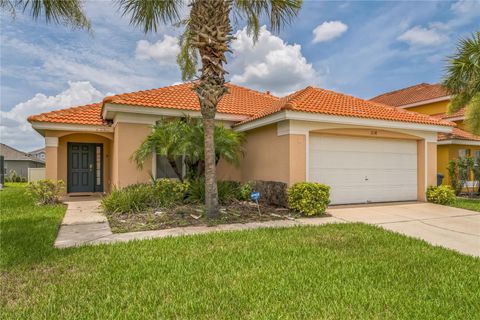
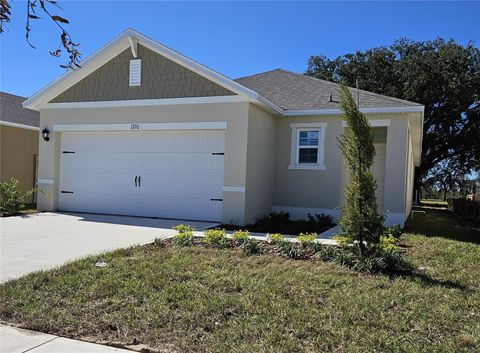
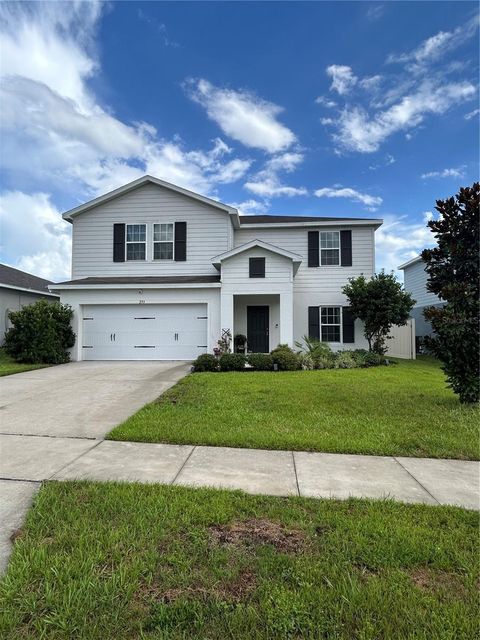
Active
$330,000
3
bds
|
2
ba
|
1,509
sqft
|
built
2022
328 Lake Davenport Cir, Davenport, FL 33837
$48
Cash flow
0.8%
Cash-on-Cash Return
6.3%
Cap rate
1.0%
Rent to Value Ratio
189 out of 292 properties for sale in 33837
Limited Results Shown
Create a free account, or log in to reveal all property listings and enjoy the complete experience.
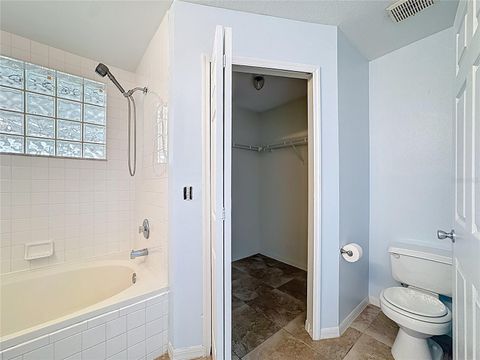
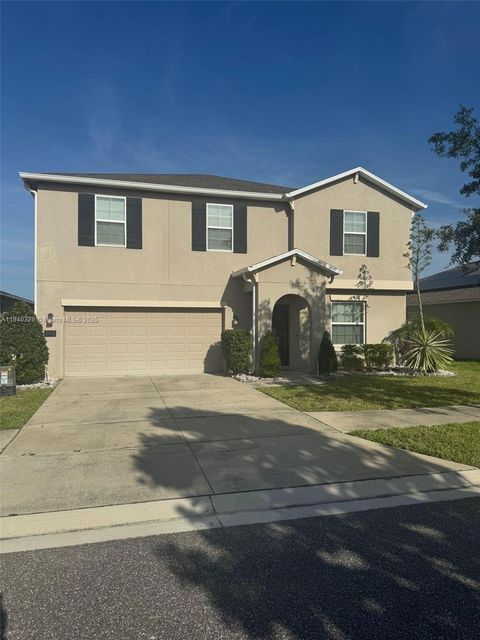
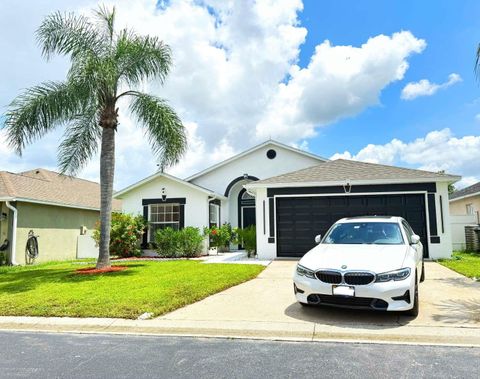
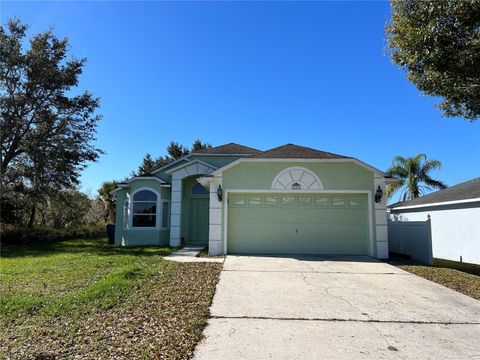
Active
$269,500
3
bds
|
2
ba
|
1,170
sqft
|
built
1996
250 Belvoir Dr, Davenport, FL 33837
$-439
Cash flow
-8.5%
Cash-on-Cash Return
4.2%
Cap rate
0.7%
Rent to Value Ratio
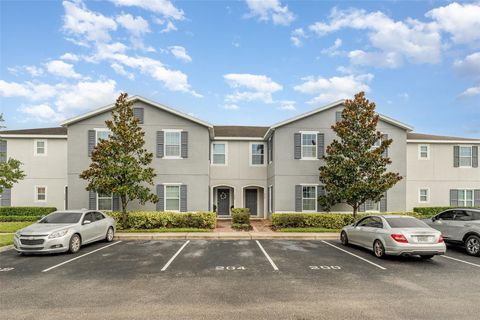
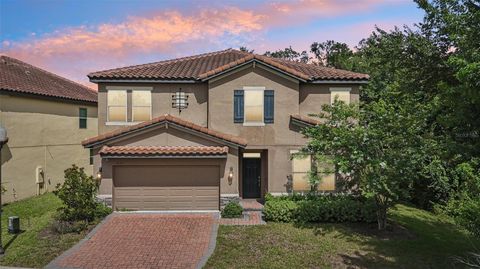
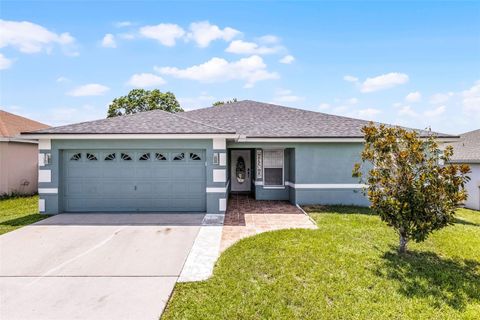
Active
$301,000
4
bds
|
3
ba
|
1,930
sqft
|
built
2018
200 Primrose Dr, Davenport, FL 33837
$-625
Cash flow
-10.8%
Cash-on-Cash Return
3.7%
Cap rate
0.8%
Rent to Value Ratio
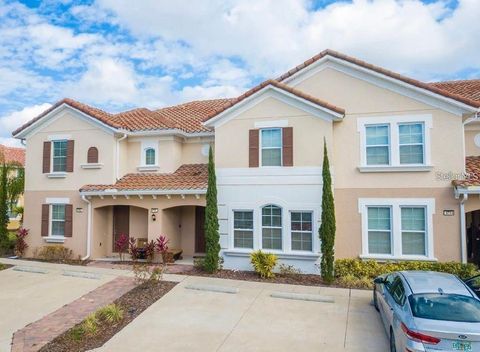
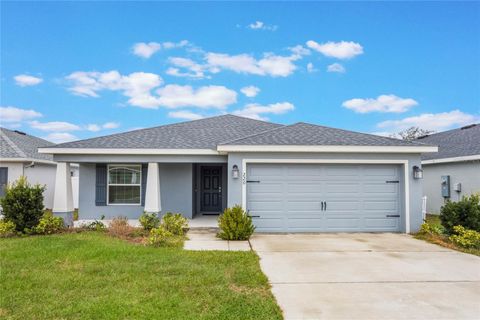
Active
$325,000
3
bds
|
2
ba
|
1,419
sqft
|
built
2014
1156 Mystery Cir, Davenport, FL 33837
$-580
Cash flow
-9.3%
Cash-on-Cash Return
4.0%
Cap rate
0.7%
Rent to Value Ratio
Active
$699,000
6
bds
|
5
ba
|
3,462
sqft
|
built
2014
4352 Acorn Ct, Davenport, FL 33837
$-1,961
Cash flow
-14.6%
Cash-on-Cash Return
2.8%
Cap rate
0.6%
Rent to Value Ratio
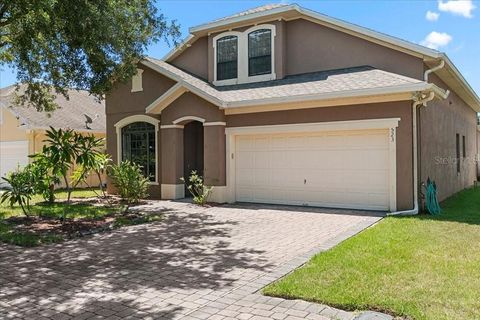
Active
$409,000
3
bds
|
3
ba
|
2,280
sqft
|
built
2014
525 Gunston Ct, Davenport, FL 33837
$-740
Cash flow
-9.4%
Cash-on-Cash Return
4.0%
Cap rate
0.6%
Rent to Value Ratio
Active
$380,000
3
bds
|
2
ba
|
1,578
sqft
|
built
2006
123 Preston Ave, Davenport, FL 33837
$-859
Cash flow
-11.8%
Cash-on-Cash Return
3.4%
Cap rate
0.6%
Rent to Value Ratio
Active
$384,900
4
bds
|
3
ba
|
2,655
sqft
|
built
2019
144 Taft Dr, Davenport, FL 33837
$-462
Cash flow
-6.3%
Cash-on-Cash Return
4.7%
Cap rate
0.8%
Rent to Value Ratio
Active
$618,000
5
bds
|
4
ba
|
2,990
sqft
|
built
2019
1833 Benoit Ter, Davenport, FL 33837
$-1,427
Cash flow
-12.0%
Cash-on-Cash Return
3.4%
Cap rate
0.6%
Rent to Value Ratio
Active
$350,000
4
bds
|
4
ba
|
2,184
sqft
|
built
2017
4710 Terrasonesta Dr, Davenport, FL 33837
$-984
Cash flow
-14.7%
Cash-on-Cash Return
2.8%
Cap rate
0.8%
Rent to Value Ratio
Active
$435,000
6
bds
|
5
ba
|
2,901
sqft
|
built
2007
523 Lake Davenport Cir, Davenport, FL 33837
$-322
Cash flow
-3.9%
Cash-on-Cash Return
5.3%
Cap rate
0.7%
Rent to Value Ratio
Active
$379,990
4
bds
|
3
ba
|
1,910
sqft
|
built
2020
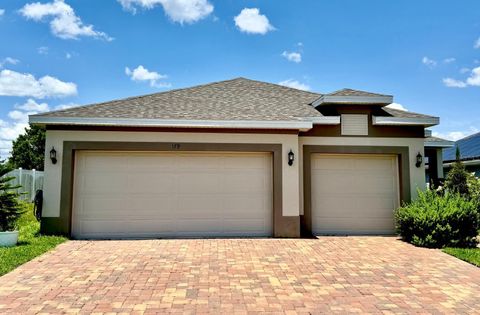
179 Blue Cypress Dr, Davenport, FL 33837
$-869
Cash flow
-11.9%
Cash-on-Cash Return
3.4%
Cap rate
0.6%
Rent to Value Ratio
Active
$410,000
4
bds
|
2
ba
|
1,976
sqft
|
built
2020
588 Meadow Bend Dr, Davenport, FL 33837
$-709
Cash flow
-9.0%
Cash-on-Cash Return
4.1%
Cap rate
0.6%
Rent to Value Ratio
Active
$315,000
4
bds
|
2
ba
|
1,767
sqft
|
built
2020
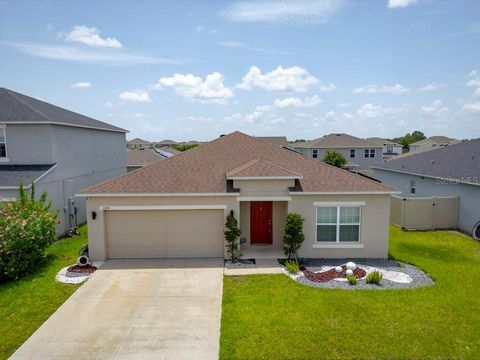
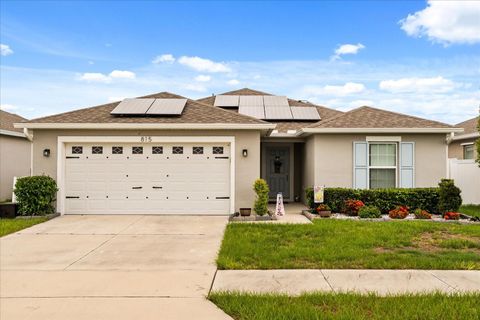
815 Fillmore Ct, Davenport, FL 33837
$-527
Cash flow
-8.7%
Cash-on-Cash Return
4.1%
Cap rate
0.8%
Rent to Value Ratio
Active
$695,000
6
bds
|
5
ba
|
2,995
sqft
|
built
2015
5168 Oakbourne Ave, Davenport, FL 33837
$-2,175
Cash flow
-16.3%
Cash-on-Cash Return
2.4%
Cap rate
0.5%
Rent to Value Ratio
Active
$625,000
6
bds
|
4
ba
|
3,616
sqft
|
built
2019
2231 Crofton Springs Ct, Davenport, FL 33837
$-1,504
Cash flow
-12.6%
Cash-on-Cash Return
3.3%
Cap rate
0.6%
Rent to Value Ratio
Active
$349,000
5
bds
|
3
ba
|
2,522
sqft
|
built
2023
1808 Post Oak Dr, Davenport, FL 33837
$-807
Cash flow
-12.1%
Cash-on-Cash Return
3.4%
Cap rate
0.7%
Rent to Value Ratio
Active
$389,000
5
bds
|
3
ba
|
2,345
sqft
|
built
2020
564 Meadow Bend Dr, Davenport, FL 33837
$-676
Cash flow
-9.1%
Cash-on-Cash Return
4.1%
Cap rate
0.6%
Rent to Value Ratio
Active
$499,900
5
bds
|
3
ba
|
2,783
sqft
|
built
2004
437 Grand Reserve Dr, Davenport, FL 33837
$-709
Cash flow
-7.4%
Cash-on-Cash Return
4.4%
Cap rate
0.7%
Rent to Value Ratio
Active
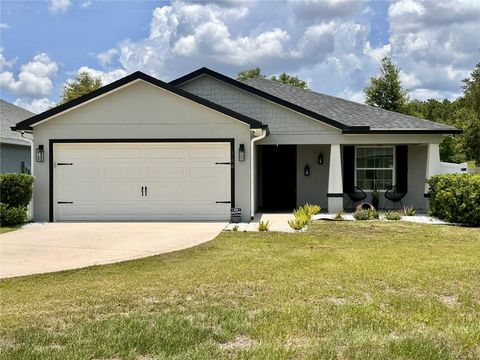
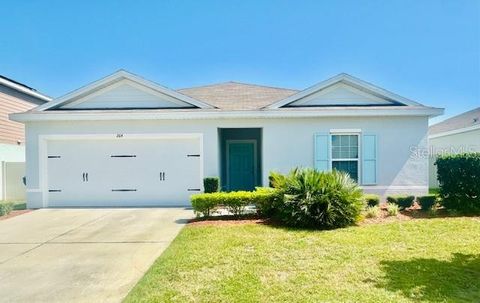
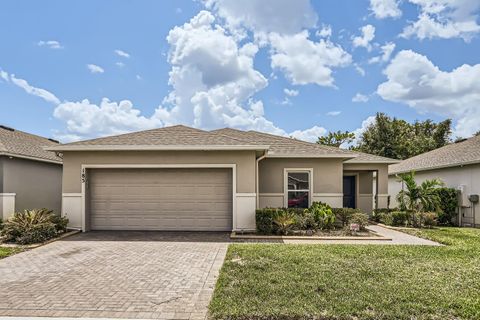
$355,000
4
bds
|
3
ba
|
1,542
sqft
|
built
2006
214 Paloma Dr, Davenport, FL 33837
$-756
Cash flow
-11.1%
Cash-on-Cash Return
3.6%
Cap rate
0.7%
Rent to Value Ratio
Active
$429,000
4
bds
|
2
ba
|
1,688
sqft
|
built
1997
132 Canary Island Cir, Davenport, FL 33837
$-1,301
Cash flow
-15.8%
Cash-on-Cash Return
2.5%
Cap rate
0.5%
Rent to Value Ratio
Active
$348,500
4
bds
|
2
ba
|
1,809
sqft
|
built
2004
141 Winsor Ave, Davenport, FL 33837
$-510
Cash flow
-7.6%
Cash-on-Cash Return
4.4%
Cap rate
0.7%
Rent to Value Ratio
Active
$360,000
4
bds
|
2
ba
|
1,698
sqft
|
built
2021
220 Foxtail Loop, Davenport, FL 33837
$-691
Cash flow
-10.0%
Cash-on-Cash Return
3.8%
Cap rate
0.7%
Rent to Value Ratio
Active
$364,900
3
bds
|
2
ba
|
1,711
sqft
|
built
1993
204 Grovepark Dr, Davenport, FL 33837
$-551
Cash flow
-7.9%
Cash-on-Cash Return
4.3%
Cap rate
0.7%
Rent to Value Ratio
Active
$279,000
3
bds
|
2
ba
|
1,374
sqft
|
built
2005
506 Nicholson Dr, Davenport, FL 33837
$-220
Cash flow
-4.1%
Cash-on-Cash Return
5.2%
Cap rate
0.8%
Rent to Value Ratio
Active
$690,000
4
bds
|
4
ba
|
4,034
sqft
|
built
2007
2209 Callaway Ct, Davenport, FL 33837
$-2,123
Cash flow
-16.1%
Cash-on-Cash Return
2.5%
Cap rate
0.5%
Rent to Value Ratio
Active
$305,000
3
bds
|
2
ba
|
1,413
sqft
|
built
2022
275 Blueberry Ln, Davenport, FL 33837
$-511
Cash flow
-8.7%
Cash-on-Cash Return
4.1%
Cap rate
0.7%
Rent to Value Ratio
Active
$344,900
3
bds
|
2
ba
|
1,566
sqft
|
built
2021
144 Foxtail Loop, Davenport, FL 33837
$-690
Cash flow
-10.4%
Cash-on-Cash Return
3.7%
Cap rate
0.6%
Rent to Value Ratio
Active
$325,000
3
bds
|
2
ba
|
1,450
sqft
|
built
2021
264 Fiddlewood Ct, Davenport, FL 33837
$-503
Cash flow
-8.1%
Cash-on-Cash Return
4.3%
Cap rate
0.7%
Rent to Value Ratio
Active
$347,999
3
bds
|
2
ba
|
1,516
sqft
|
built
2023
1370 Holodak Dr, Davenport, FL 33837
$-864
Cash flow
-13.0%
Cash-on-Cash Return
3.2%
Cap rate
0.7%
Rent to Value Ratio
Active
$400,000
3
bds
|
2
ba
|
1,842
sqft
|
built
2018
185 Hamlet Loop, Davenport, FL 33837
$-902
Cash flow
-11.8%
Cash-on-Cash Return
3.4%
Cap rate
0.6%
Rent to Value Ratio
Active
$478,000
5
bds
|
4
ba
|
3,090
sqft
|
built
2022
1023 Sugarwood St, Davenport, FL 33837
$-1,094
Cash flow
-11.9%
Cash-on-Cash Return
3.4%
Cap rate
0.7%
Rent to Value Ratio
Active
$515,000
4
bds
|
3
ba
|
2,105
sqft
|
built
2018
1709 Benoit Ter, Davenport, FL 33837
$-1,319
Cash flow
-13.4%
Cash-on-Cash Return
3.1%
Cap rate
0.5%
Rent to Value Ratio
Active
$540,000
5
bds
|
5
ba
|
2,777
sqft
|
built
2016
5368 Oakbourne Ave, Davenport, FL 33837
$-1,403
Cash flow
-13.6%
Cash-on-Cash Return
3.0%
Cap rate
0.7%
Rent to Value Ratio
Active
$425,000
4
bds
|
3
ba
|
2,027
sqft
|
built
2016
4928 Cortland Dr, Davenport, FL 33837
$-798
Cash flow
-9.8%
Cash-on-Cash Return
3.9%
Cap rate
0.6%
Rent to Value Ratio
Active
$394,990
4
bds
|
3
ba
|
2,232
sqft
|
built
2021
293 Fiddlewood Ct, Davenport, FL 33837
$-701
Cash flow
-9.3%
Cash-on-Cash Return
4.0%
Cap rate
0.7%
Rent to Value Ratio
Active
$265,000
3
bds
|
2
ba
|
1,353
sqft
|
built
1997
103 Thornbush Pkwy, Davenport, FL 33837
$-426
Cash flow
-8.4%
Cash-on-Cash Return
4.2%
Cap rate
0.7%
Rent to Value Ratio
Active
$320,000
3
bds
|
2
ba
|
1,249
sqft
|
built
2010
1366 Merrimack Pl, Davenport, FL 33837
$-311
Cash flow
-5.1%
Cash-on-Cash Return
5.0%
Cap rate
0.6%
Rent to Value Ratio
Active
$429,900
4
bds
|
2
ba
|
1,983
sqft
|
built
2021
363 Miro Dr, Davenport, FL 33837
$-744
Cash flow
-9.0%
Cash-on-Cash Return
4.1%
Cap rate
0.7%
Rent to Value Ratio