33860 Investment Properties for Sale
Browse homes for sale and investment properties in 33860. Refine your search by price, property type, or more.
Best cash flowing properties in 33860
Active
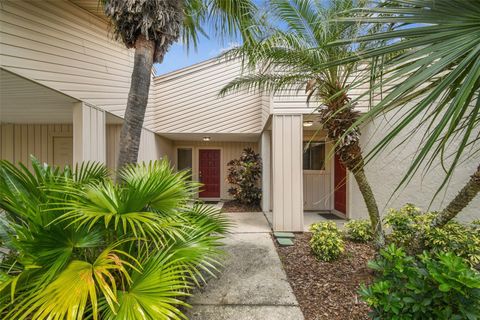
$156,500
2
bds
|
2
ba
|
968
sqft
|
built
1983
4243 Oak Loop, Mulberry, FL 33860
$161
Cash flow
5.4%
Cash-on-Cash Return
7.4%
Cap rate
1.0%
Rent to Value Ratio
Active
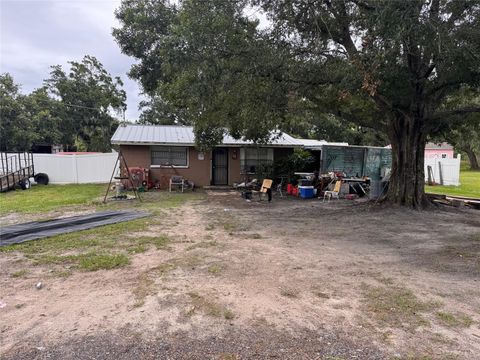
$140,000
2
bds
|
1
ba
|
720
sqft
|
built
1961
2293 Pump Rd, Mulberry, FL 33860
$135
Cash flow
5.0%
Cash-on-Cash Return
7.3%
Cap rate
1.0%
Rent to Value Ratio
29 out of 33 properties for sale in 33860
Limited Results Shown
Create a free account, or log in to reveal all property listings and enjoy the complete experience.
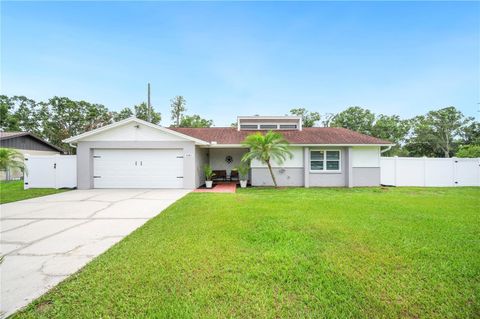
Active
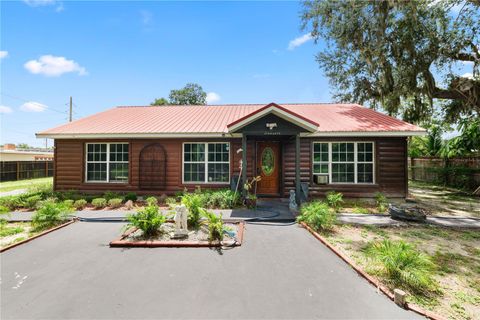
$264,500
3
bds
|
2
ba
|
1,260
sqft
|
built
2014
330 Diesel Rd, Mulberry, FL 33860
$-198
Cash flow
-3.9%
Cash-on-Cash Return
5.2%
Cap rate
0.7%
Rent to Value Ratio
Active
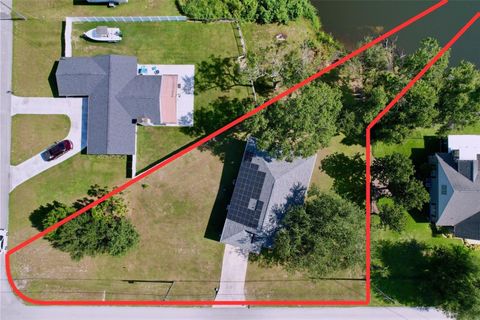
$369,000
3
bds
|
2
ba
|
1,757
sqft
|
built
2009
4285 Meadowood Dr, Mulberry, FL 33860
$-319
Cash flow
-4.5%
Cash-on-Cash Return
5.1%
Cap rate
0.7%
Rent to Value Ratio
Active
$364,999
4
bds
|
2
ba
|
1,946
sqft
|
built
2009
4662 Harts Brook Ln, Mulberry, FL 33860
$-448
Cash flow
-6.4%
Cash-on-Cash Return
4.7%
Cap rate
0.7%
Rent to Value Ratio
Active
$340,000
4
bds
|
3
ba
|
2,184
sqft
|
built
1973
5635 Kimball Rd, Mulberry, FL 33860
$-514
Cash flow
-7.9%
Cash-on-Cash Return
4.3%
Cap rate
0.7%
Rent to Value Ratio
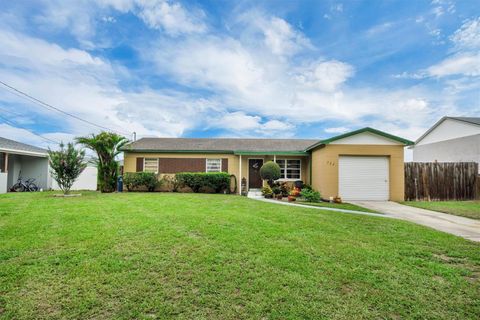
Active
$244,000
3
bds
|
2
ba
|
1,107
sqft
|
built
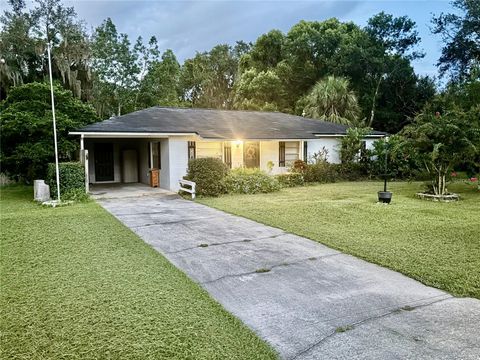
1980
2955 Howard St, Mulberry, FL 33860
$-81
Cash flow
-1.7%
Cash-on-Cash Return
5.7%
Cap rate
0.7%
Rent to Value Ratio
Active
$449,999
4
bds
|
4
ba
|
2,411
sqft
|
built
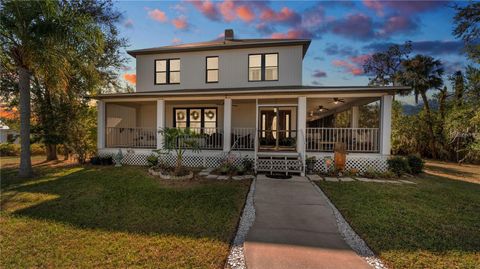
1923
504 NW 9th St, Mulberry, FL 33860
$-617
Cash flow
-7.2%
Cash-on-Cash Return
4.5%
Cap rate
0.7%
Rent to Value Ratio
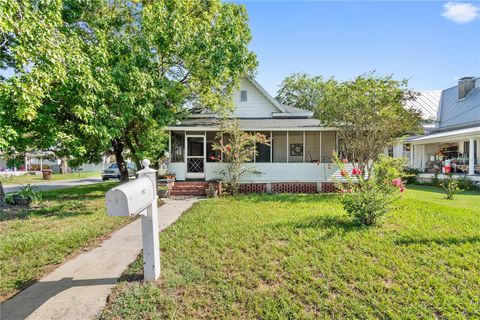
Active
$240,000
3
bds
|
2
ba
|
1,562
sqft
|
built
1920
202 E Badcock Blvd, Mulberry, FL 33860
$-34
Cash flow
-0.7%
Cash-on-Cash Return
6.0%
Cap rate
0.9%
Rent to Value Ratio
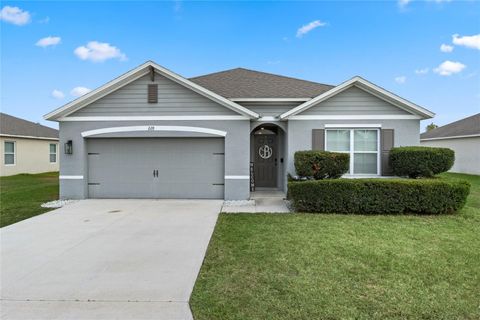
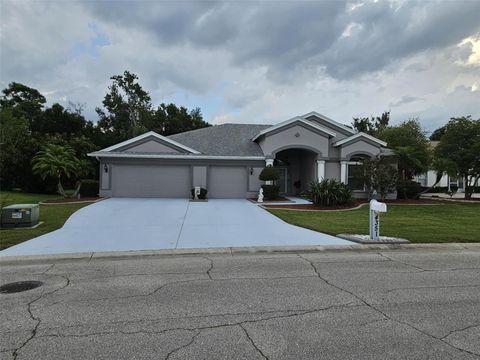
Active
$350,000
4
bds
|
2
ba
|
1,828
sqft
|
built
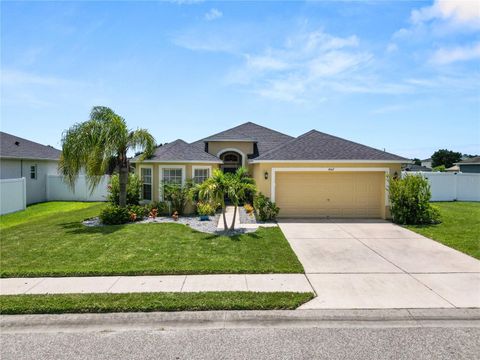
2019
228 St Thomas Dr, Mulberry, FL 33860
$-457
Cash flow
-6.8%
Cash-on-Cash Return
4.6%
Cap rate
0.7%
Rent to Value Ratio
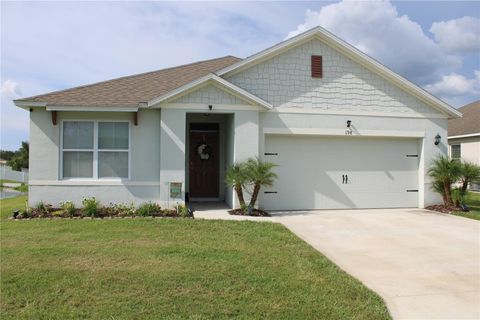
Active
$330,000
3
bds
|
2
ba
|
1,690
sqft
|
built
2019
198 St Thomas Dr, Mulberry, FL 33860
$-476
Cash flow
-7.5%
Cash-on-Cash Return
4.4%
Cap rate
0.7%
Rent to Value Ratio
Active
$355,000
4
bds
|
3
ba
|
2,822
sqft
|
built
2003
2228 Blackwood Dr, Mulberry, FL 33860
$-274
Cash flow
-4.0%
Cash-on-Cash Return
5.2%
Cap rate
0.8%
Rent to Value Ratio
Active
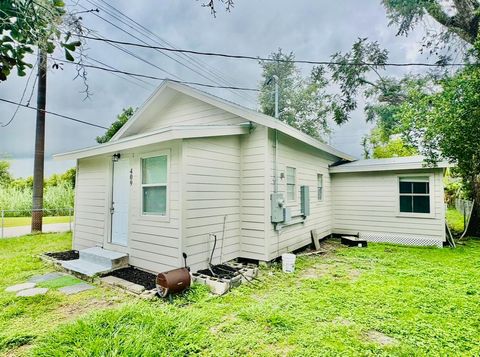
$195,000
3
bds
|
1
ba
|
860
sqft
|
built
1939
409 SW 2nd Ave, Mulberry, FL 33860
$-101
Cash flow
-2.7%
Cash-on-Cash Return
5.5%
Cap rate
0.8%
Rent to Value Ratio

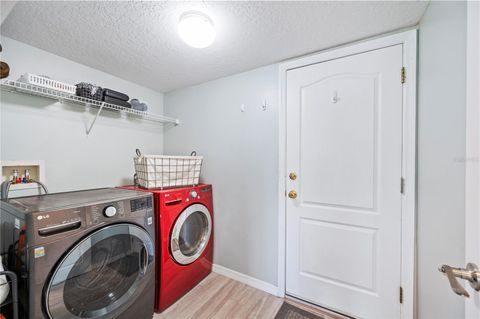
Active
$379,990
3
bds
|
2
ba
|
2,025
sqft
|
built
2022
134 St Thomas Dr, Mulberry, FL 33860
$-627
Cash flow
-8.6%
Cash-on-Cash Return
4.2%
Cap rate
0.7%
Rent to Value Ratio
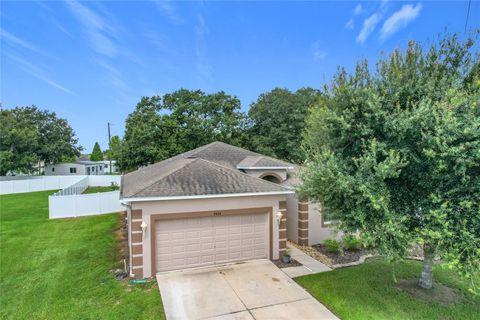
Active
$339,000
3
bds
|
2
ba
|
1,525
sqft
|
built
2010
4458 Creekside Dr, Mulberry, FL 33860
$-591
Cash flow
-9.1%
Cash-on-Cash Return
4.1%
Cap rate
0.6%
Rent to Value Ratio

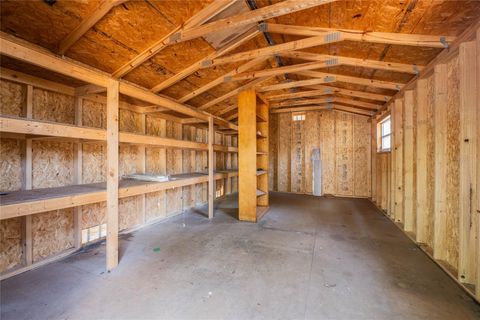
Active
$164,000
2
bds
|
2
ba
|
1,080
sqft
|
built
1983
4241 Oak Loop, Mulberry, FL 33860
$113
Cash flow
3.6%
Cash-on-Cash Return
7.0%
Cap rate
1.0%
Rent to Value Ratio
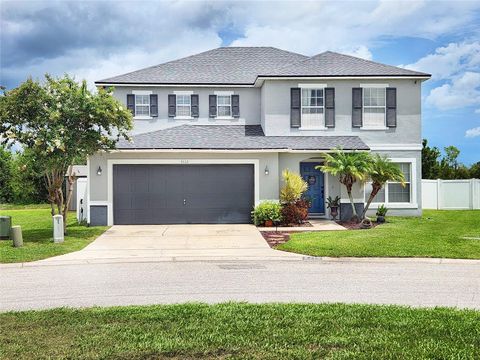
Active
$359,000
3
bds
|
3
ba
|
2,620
sqft
|
built
2007
3112 Kearns Rd, Mulberry, FL 33860
$-298
Cash flow
-4.3%
Cash-on-Cash Return
5.2%
Cap rate
0.7%
Rent to Value Ratio

Active
$300,000
4
bds
|
3
ba
|
1,612
sqft
|
built
1960
150 North Ave, Mulberry, FL 33860
$-492
Cash flow
-8.6%
Cash-on-Cash Return
4.2%
Cap rate
0.6%
Rent to Value Ratio
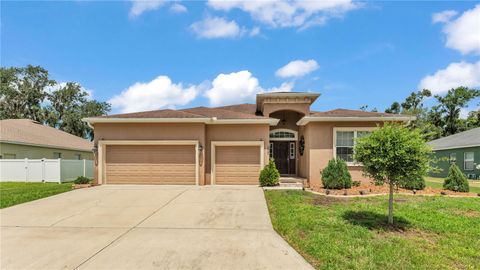
Active
$454,900
4
bds
|
3
ba
|
2,673
sqft
|
built
2013
2932 Blackwater Oaks Dr, Mulberry, FL 33860
$-712
Cash flow
-8.2%
Cash-on-Cash Return
4.3%
Cap rate
0.6%
Rent to Value Ratio
Active
$292,500
2
bds
|
2
ba
|
1,315
sqft
|
built
1979
3080 Cross Fox Dr, Mulberry, FL 33860
$-162
Cash flow
-2.9%
Cash-on-Cash Return
5.5%
Cap rate
0.8%
Rent to Value Ratio
Active
$263,000
3
bds
|
2
ba
|
1,197
sqft
|
built
1956
322 NE 9th St, Mulberry, FL 33860
$-209
Cash flow
-4.1%
Cash-on-Cash Return
5.2%
Cap rate
0.7%
Rent to Value Ratio
Active
$550,000
4
bds
|
3
ba
|
2,865
sqft
|
built
1996
4351 Winding Oaks Cir, Mulberry, FL 33860
$-1,316
Cash flow
-12.5%
Cash-on-Cash Return
3.3%
Cap rate
0.6%
Rent to Value Ratio
Active
$525,000
4
bds
|
3
ba
|
2,283
sqft
|
built
2012
2933 Blackwater Oaks Dr, Mulberry, FL 33860
$-1,154
Cash flow
-11.5%
Cash-on-Cash Return
3.5%
Cap rate
0.5%
Rent to Value Ratio
Active
$329,900
3
bds
|
3
ba
|
2,535
sqft
|
built
2005
2415 Brownwood Dr, Mulberry, FL 33860
$-564
Cash flow
-8.9%
Cash-on-Cash Return
4.1%
Cap rate
0.7%
Rent to Value Ratio
Active
$450,690
4
bds
|
3
ba
|
3,353
sqft
|
built
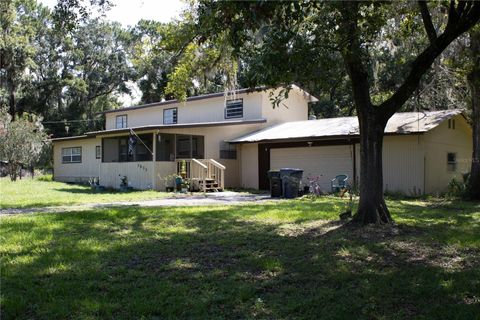
1979
34 Misty Meadow Ln, Mulberry, FL 33860
$-619
Cash flow
-7.2%
Cash-on-Cash Return
4.5%
Cap rate
0.6%
Rent to Value Ratio
Active
$525,000
3
bds
|
2
ba
|
2,354
sqft
|
built
1967
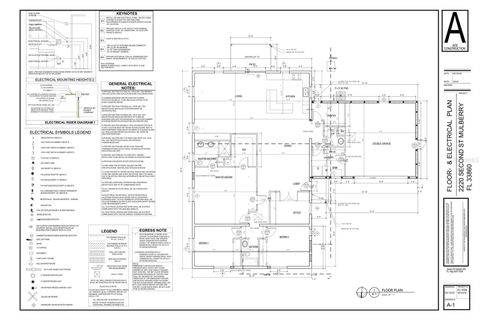
2220 2nd St, Mulberry, FL 33860
$-1,820
Cash flow
-18.1%
Cash-on-Cash Return
2.0%
Cap rate
0.3%
Rent to Value Ratio
Active
$750,000
4
bds
|
3
ba
|
3,713
sqft
|
built
2006
5118 Norriswood Dr, Mulberry, FL 33860
$-1,913
Cash flow
-13.3%
Cash-on-Cash Return
3.1%
Cap rate
0.5%
Rent to Value Ratio
Active
$383,500
3
bds
|
2
ba
|
1,705
sqft
|
built
1979
4210 Old Colony Rd, Mulberry, FL 33860
$-268
Cash flow
-3.6%
Cash-on-Cash Return
5.3%
Cap rate
0.8%
Rent to Value Ratio
Active
$388,000
4
bds
|
2
ba
|
2,002
sqft
|
built
2011
2712 Oak Hammock Loop, Mulberry, FL 33860
$-472
Cash flow
-6.3%
Cash-on-Cash Return
4.7%
Cap rate
0.6%
Rent to Value Ratio