33870 Investment Properties for Sale
Browse homes for sale and investment properties in 33870. Refine your search by price, property type, or more.
Best cash flowing properties in 33870
Active
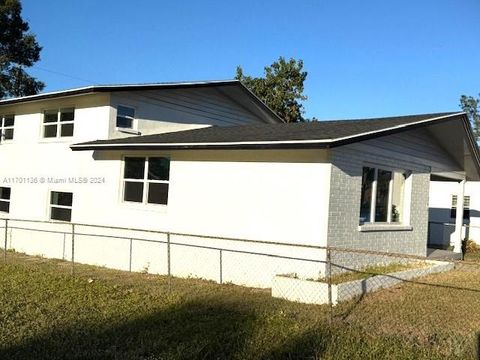
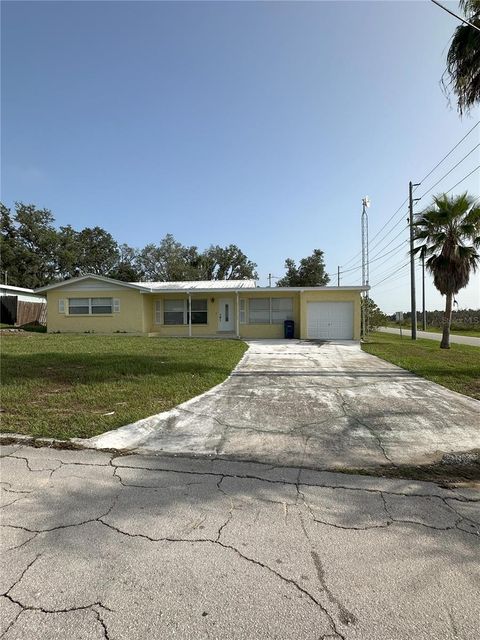
$164,999
3
bds
|
2
ba
|
0
sqft
|
built
1967
744 Lemon Ave, Sebring, FL 33870
$237
Cash flow
7.5%
Cash-on-Cash Return
7.9%
Cap rate
1.1%
Rent to Value Ratio
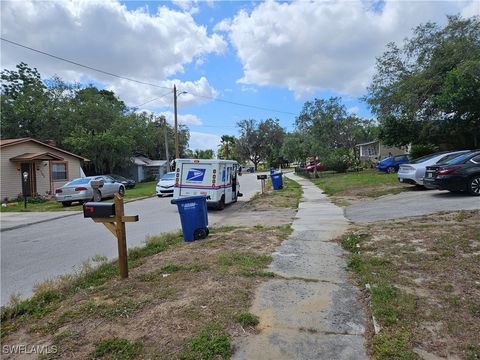
Active
$155,000
2
bds
|
1
ba
|
1,182
sqft
|
built
1980
1112 Evanston St, Sebring, FL 33870
$24
Cash flow
0.8%
Cash-on-Cash Return
6.3%
Cap rate
0.9%
Rent to Value Ratio
21 out of 23 properties for sale in 33870
Limited Results Shown
Create a free account, or log in to reveal all property listings and enjoy the complete experience.
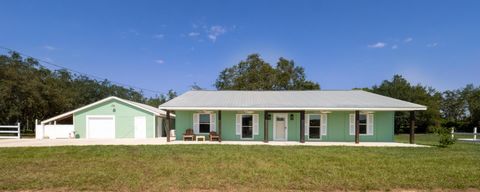
Active
$619,000
3
bds
|
2
ba
|
2,145
sqft
|
built
2007
2011 Hartt Rd, Sebring, FL 33870
$-1,674
Cash flow
-14.1%
Cash-on-Cash Return
2.9%
Cap rate
0.4%
Rent to Value Ratio
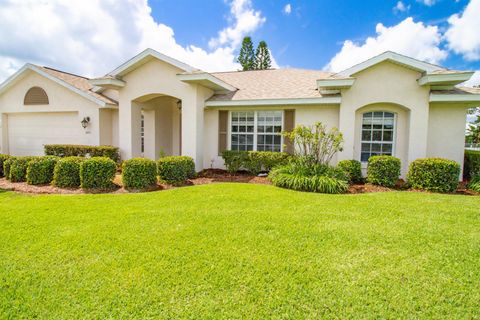
Active
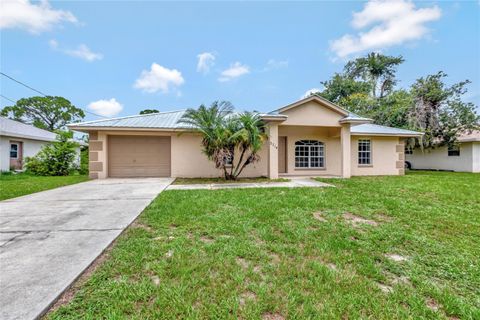
$284,900
3
bds
|
2
ba
|
1,764
sqft
|
built
1996
3841 Sebring Pkwy, Sebring, FL 33870
$-199
Cash flow
-3.6%
Cash-on-Cash Return
5.3%
Cap rate
0.7%
Rent to Value Ratio
Active
$269,000
3
bds
|
2
ba
|
0
sqft
|
built
1987
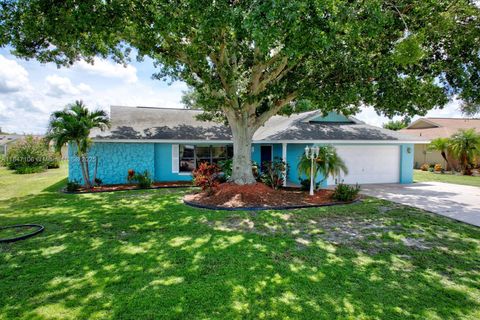
1704 Ridge St, Sebring, FL 33870
$-278
Cash flow
-5.4%
Cash-on-Cash Return
4.9%
Cap rate
0.7%
Rent to Value Ratio
Active
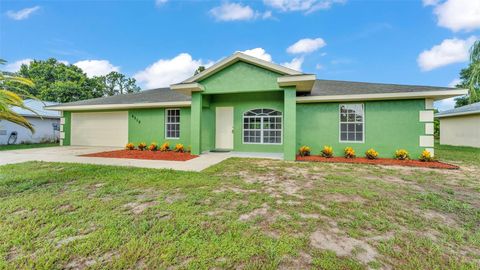
$299,000
3
bds
|
2
ba
|
1,719
sqft
|
built
2018
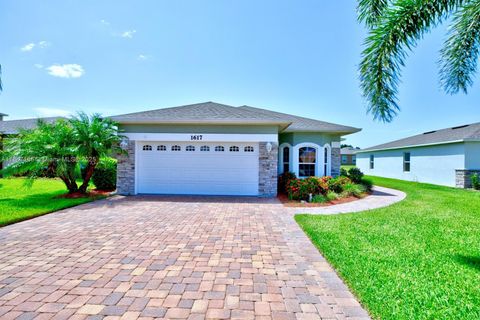
1617 Marble St, Sebring, FL 33870
$-753
Cash flow
-13.1%
Cash-on-Cash Return
3.1%
Cap rate
0.7%
Rent to Value Ratio
Active
$289,000
3
bds
|
2
ba
|
1,701
sqft
|
built
2006
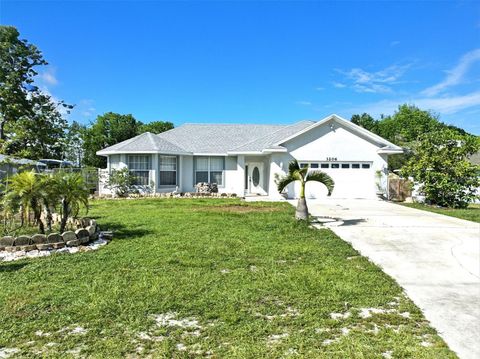
3206 Valerie Blvd, Sebring, FL 33870
$-204
Cash flow
-3.7%
Cash-on-Cash Return
5.3%
Cap rate
0.7%
Rent to Value Ratio
Active
$270,000
4
bds
|
0
ba
|
0
sqft
|
built
1978
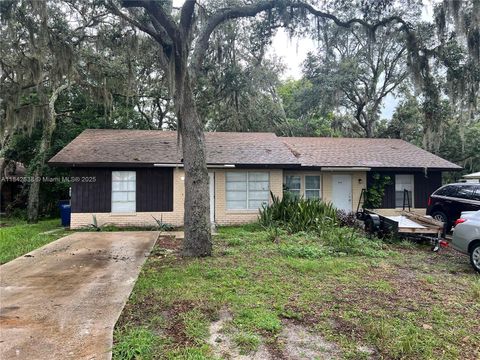
2019 Colmar Ave, Sebring, FL 33870
$-670
Cash flow
-12.9%
Cash-on-Cash Return
3.2%
Cap rate
0.5%
Rent to Value Ratio
Active
$334,000
3
bds
|
2
ba
|
1,323
sqft
|
built
2010
2351 Lakeview Dr, Sebring, FL 33870
$-1,184
Cash flow
-18.5%
Cash-on-Cash Return
1.9%
Cap rate
0.7%
Rent to Value Ratio
Active
$265,000
2
bds
|
2
ba
|
1,416
sqft
|
built
1981
2818 Summit Dr, Sebring, FL 33870
$-316
Cash flow
-6.2%
Cash-on-Cash Return
4.7%
Cap rate
0.7%
Rent to Value Ratio
Active
$300,000
3
bds
|
2
ba
|
1,323
sqft
|
built
2010
2351 Lakeview Dr, Sebring, FL 33870
$-983
Cash flow
-17.1%
Cash-on-Cash Return
2.2%
Cap rate
0.8%
Rent to Value Ratio
Active
$309,900
3
bds
|
2
ba
|
2,074
sqft
|
built
1954
2600 Lakeview Dr, Sebring, FL 33870
$-706
Cash flow
-11.9%
Cash-on-Cash Return
3.4%
Cap rate
0.6%
Rent to Value Ratio
Active
$220,000
2
bds
|
2
ba
|
1,234
sqft
|
built
1960
1732 Valencia Ave, Sebring, FL 33870
$-317
Cash flow
-7.5%
Cash-on-Cash Return
4.4%
Cap rate
0.7%
Rent to Value Ratio
Active
$249,000
3
bds
|
2
ba
|
1,288
sqft
|
built
2004
2714 Valerie Blvd, Sebring, FL 33870
$-394
Cash flow
-8.3%
Cash-on-Cash Return
4.3%
Cap rate
0.6%
Rent to Value Ratio
Active
$275,000
3
bds
|
2
ba
|
1,336
sqft
|
built
2005
4515 Starfish Ave, Sebring, FL 33870
$-409
Cash flow
-7.8%
Cash-on-Cash Return
4.4%
Cap rate
0.7%
Rent to Value Ratio
Active
$399,000
5
bds
|
3
ba
|
2,600
sqft
|
built
1973
2530 Van Pelt Rd, Sebring, FL 33870
$-792
Cash flow
-10.4%
Cash-on-Cash Return
3.8%
Cap rate
0.6%
Rent to Value Ratio

Active
$295,000
3
bds
|
2
ba
|
1,962
sqft
|
built
1976
1624 Lagrange Ave, Sebring, FL 33870
$-553
Cash flow
-9.8%
Cash-on-Cash Return
3.9%
Cap rate
0.6%
Rent to Value Ratio

Active
$380,000
3
bds
|
2
ba
|
1,908
sqft
|
built
1998
2225 Jackson Dr, Sebring, FL 33870
$-884
Cash flow
-12.1%
Cash-on-Cash Return
3.4%
Cap rate
0.6%
Rent to Value Ratio

Active
$243,000
2
bds
|
2
ba
|
1,436
sqft
|
built
1988
107 Robin Ave, Sebring, FL 33870
$-103
Cash flow
-2.2%
Cash-on-Cash Return
5.6%
Cap rate
0.7%
Rent to Value Ratio

Active
$569,000
4
bds
|
3
ba
|
2,136
sqft
|
built
1956
1622 Dinner Lake Dr, Sebring, FL 33870
$-1,853
Cash flow
-17.0%
Cash-on-Cash Return
2.2%
Cap rate
0.4%
Rent to Value Ratio

Active
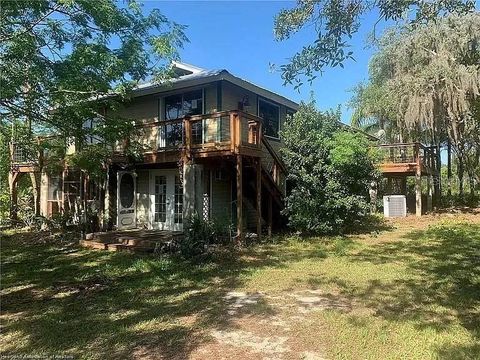
$1,599,000
4
bds
|
3
ba
|
2,233
sqft
|
built
1975
2650 Scrubpens Rd, Sebring, FL 33870
$-5,831
Cash flow
-19.0%
Cash-on-Cash Return
1.8%
Cap rate
0.3%
Rent to Value Ratio