33896 Investment Properties for Sale
Browse homes for sale and investment properties in 33896. Refine your search by price, property type, or more.
Best cash flowing properties in 33896
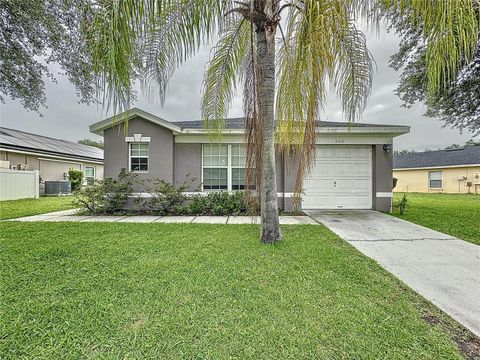
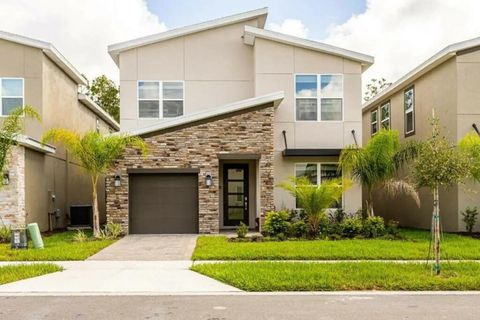
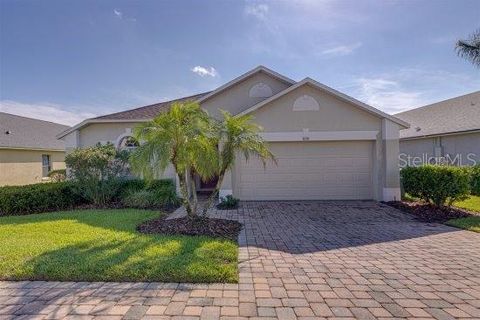
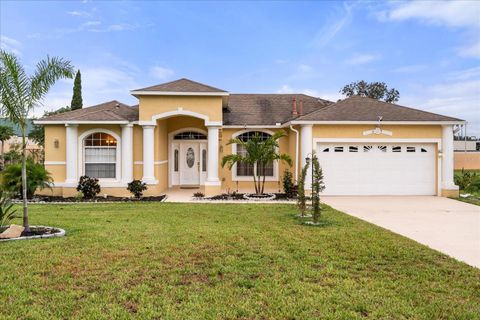
Active
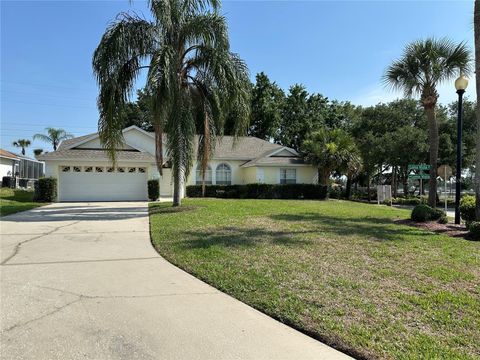
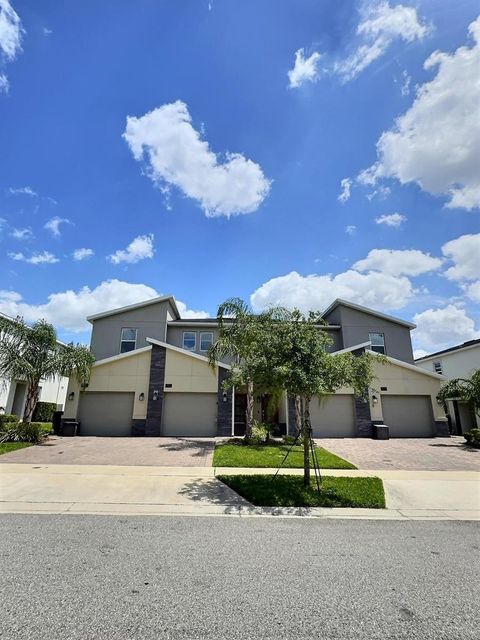
$228,000
2
bds
|
2
ba
|
1,134
sqft
|
built
2007
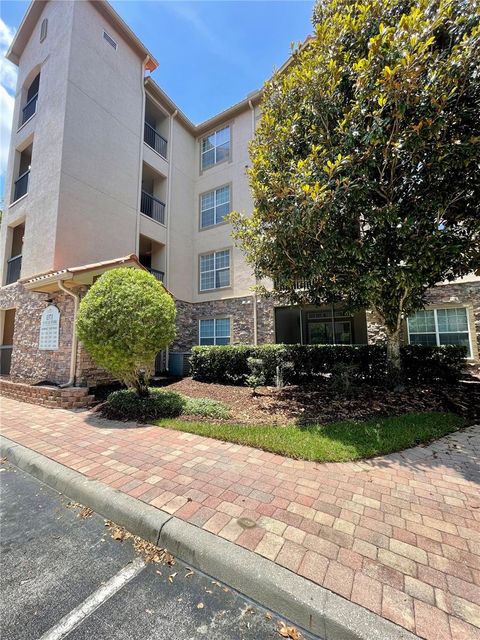
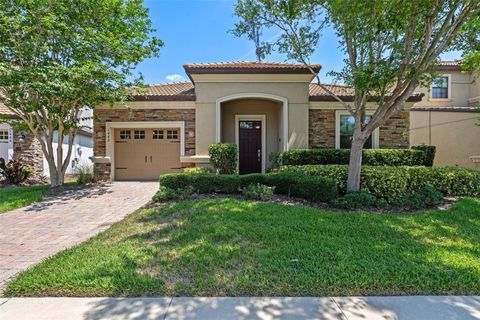
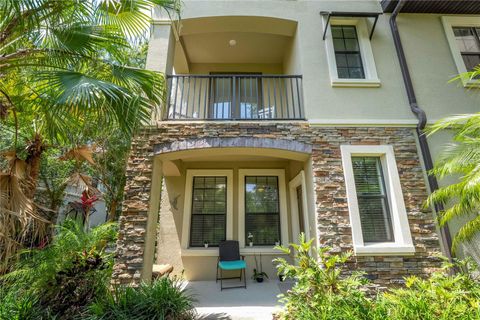
8010 Tuscany Way, Davenport, FL 33896
$-405
Cash flow
-9.3%
Cash-on-Cash Return
4.0%
Cap rate
0.8%
Rent to Value Ratio
Active
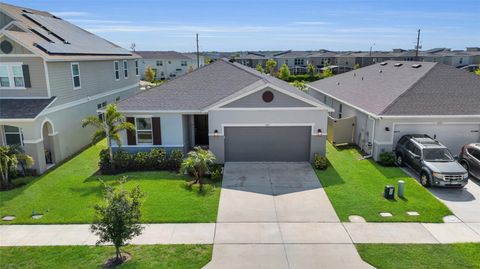
$314,900
3
bds
|
3
ba
|
1,534
sqft
|
built
1994
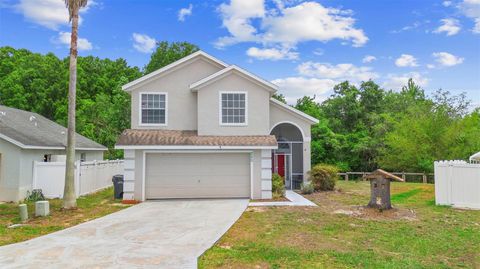
232 Oxford Rd, Davenport, FL 33896
$-423
Cash flow
-7.0%
Cash-on-Cash Return
4.5%
Cap rate
0.7%
Rent to Value Ratio
158 out of 336 properties for sale in 33896
Limited Results Shown
Create a free account, or log in to reveal all property listings and enjoy the complete experience.
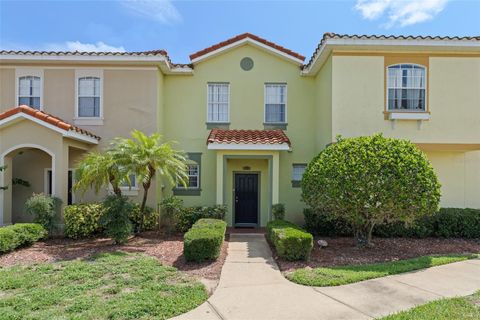
Active
$220,000
3
bds
|
2
ba
|
1,248
sqft
|
built
2006
1355 Venezia Ct, Davenport, FL 33896
$-472
Cash flow
-11.2%
Cash-on-Cash Return
3.6%
Cap rate
0.8%
Rent to Value Ratio
Active
$215,000
2
bds
|
2
ba
|
1,134
sqft
|
built
2007
1361 Tuscan Ter, Davenport, FL 33896
$-793
Cash flow
-19.2%
Cash-on-Cash Return
1.7%
Cap rate
0.8%
Rent to Value Ratio
Active
$499,000
4
bds
|
3
ba
|
2,225
sqft
|
built
2013
1442 Moon Valley Dr, Davenport, FL 33896
$-1,451
Cash flow
-15.2%
Cash-on-Cash Return
2.7%
Cap rate
0.7%
Rent to Value Ratio
Active
$444,900
4
bds
|
5
ba
|
2,094
sqft
|
built
2016
306 Captiva Dr, Davenport, FL 33896
$-1,184
Cash flow
-13.9%
Cash-on-Cash Return
3.0%
Cap rate
0.6%
Rent to Value Ratio
Active
$399,000
5
bds
|
3
ba
|
1,680
sqft
|
built
2008
2281 Royal Ridge Dr, Davenport, FL 33896
$-808
Cash flow
-10.6%
Cash-on-Cash Return
3.7%
Cap rate
0.6%
Rent to Value Ratio
Active
$519,000
5
bds
|
4
ba
|
3,221
sqft
|
built
2008
844 Suffolk Pl, Davenport, FL 33896
$-1,306
Cash flow
-13.1%
Cash-on-Cash Return
3.1%
Cap rate
0.6%
Rent to Value Ratio
Active
$355,000
3
bds
|
3
ba
|
1,609
sqft
|
built
2020
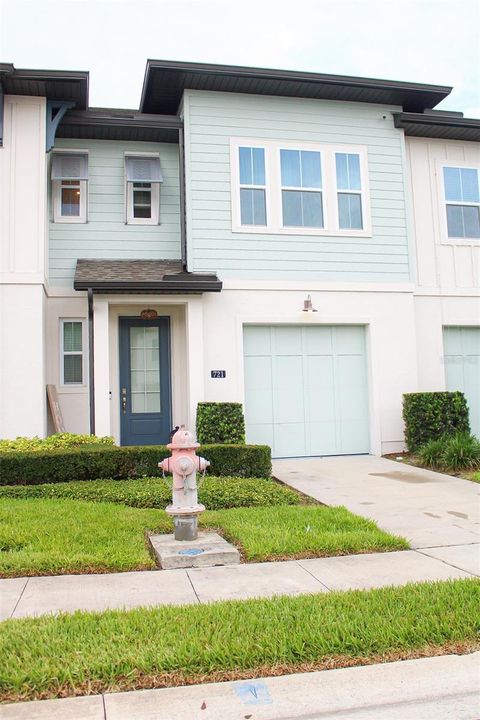
721 Benoi Dr, Davenport, FL 33896
$-850
Cash flow
-12.5%
Cash-on-Cash Return
3.3%
Cap rate
0.7%
Rent to Value Ratio
Active
$285,000
4
bds
|
2
ba
|
1,688
sqft
|
built
2005
504 Terrace Ridge Cir, Davenport, FL 33896
$-1,078
Cash flow
-19.7%
Cash-on-Cash Return
1.6%
Cap rate
0.7%
Rent to Value Ratio
Active
$412,000
3
bds
|
3
ba
|
2,076
sqft
|
built
2021
8955 Fluffy Lie Ct, Davenport, FL 33896
$-1,744
Cash flow
-22.1%
Cash-on-Cash Return
1.1%
Cap rate
0.6%
Rent to Value Ratio
Active
$568,900
5
bds
|
5
ba
|
2,842
sqft
|
built
2014
9023 Shadow Mountain St, Davenport, FL 33896
$-1,894
Cash flow
-17.4%
Cash-on-Cash Return
2.2%
Cap rate
0.6%
Rent to Value Ratio
Active
$330,000
4
bds
|
3
ba
|
1,665
sqft
|
built
2005
350 Scrub Jay Way, Davenport, FL 33896
$-563
Cash flow
-8.9%
Cash-on-Cash Return
4.1%
Cap rate
0.7%
Rent to Value Ratio
Active
$349,999
3
bds
|
2
ba
|
1,499
sqft
|
built
2000
307 Balmoral Ct, Davenport, FL 33896
$-465
Cash flow
-6.9%
Cash-on-Cash Return
4.6%
Cap rate
0.7%
Rent to Value Ratio
Active
$695,000
7
bds
|
6
ba
|
3,604
sqft
|
built
2013
1439 Moon Valley Dr, Davenport, FL 33896
$-2,378
Cash flow
-17.9%
Cash-on-Cash Return
2.0%
Cap rate
0.5%
Rent to Value Ratio
Active
$489,000
4
bds
|
2
ba
|
2,269
sqft
|
built
2020
1101 Downswing Pl, Davenport, FL 33896
$-1,813
Cash flow
-19.3%
Cash-on-Cash Return
1.7%
Cap rate
0.6%
Rent to Value Ratio
Active
$560,000
6
bds
|
5
ba
|
2,995
sqft
|
built
2015
1327 Shinnecock Hills Dr, Davenport, FL 33896
$-1,613
Cash flow
-15.0%
Cash-on-Cash Return
2.7%
Cap rate
0.6%
Rent to Value Ratio
Active
$465,000
4
bds
|
2
ba
|
1,989
sqft
|
built
2023
685 Overpool Ave, Davenport, FL 33896
$-1,239
Cash flow
-13.9%
Cash-on-Cash Return
2.9%
Cap rate
0.5%
Rent to Value Ratio
Active
$215,000
3
bds
|
3
ba
|
1,262
sqft
|
built
2003
214 Monroe Cir, Davenport, FL 33896
$-468
Cash flow
-11.4%
Cash-on-Cash Return
3.5%
Cap rate
0.8%
Rent to Value Ratio
Active
$344,900
4
bds
|
2
ba
|
1,751
sqft
|
built
2018
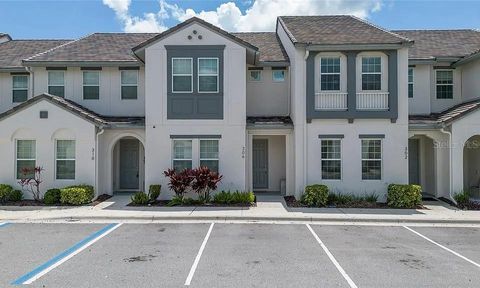
316 Tanglewood Dr, Davenport, FL 33896
$-673
Cash flow
-10.2%
Cash-on-Cash Return
3.8%
Cap rate
0.6%
Rent to Value Ratio
Active
$377,500
4
bds
|
3
ba
|
1,854
sqft
|
built
2000
5604 Loma Vista Dr W, Davenport, FL 33896
$-638
Cash flow
-8.8%
Cash-on-Cash Return
4.1%
Cap rate
0.7%
Rent to Value Ratio
Active
$369,000
3
bds
|
2
ba
|
1,950
sqft
|
built
2007
126 San Carlo Rd, Davenport, FL 33896
$-755
Cash flow
-10.7%
Cash-on-Cash Return
3.7%
Cap rate
0.6%
Rent to Value Ratio
Active
$369,000
3
bds
|
3
ba
|
2,174
sqft
|
built
2020
652 Benoi Dr, Davenport, FL 33896
$-1,103
Cash flow
-15.6%
Cash-on-Cash Return
2.6%
Cap rate
0.6%
Rent to Value Ratio
Active
$850,000
8
bds
|
5
ba
|
3,915
sqft
|
built
2019
8833 Cruden Bay Ct, Davenport, FL 33896
$-2,350
Cash flow
-14.4%
Cash-on-Cash Return
2.8%
Cap rate
0.6%
Rent to Value Ratio
Active
$585,000
5
bds
|
5
ba
|
3,081
sqft
|
built
2020
671 Drop Shot Dr, Davenport, FL 33896
$-1,375
Cash flow
-12.3%
Cash-on-Cash Return
3.3%
Cap rate
0.7%
Rent to Value Ratio
Active
$760,000
8
bds
|
5
ba
|
3,909
sqft
|
built
2014
1478 Moon Valley Dr, Davenport, FL 33896
$-2,629
Cash flow
-18.0%
Cash-on-Cash Return
2.0%
Cap rate
0.5%
Rent to Value Ratio
Active
$729,900
9
bds
|
5
ba
|
3,909
sqft
|
built
2015
1450 Rolling Fairway Dr, Davenport, FL 33896
$-2,249
Cash flow
-16.1%
Cash-on-Cash Return
2.4%
Cap rate
0.6%
Rent to Value Ratio
Active
$239,000
3
bds
|
2
ba
|
0
sqft
|
built
2008
1301 Tuscan Ter, Davenport, FL 33896
$-1,001
Cash flow
-21.9%
Cash-on-Cash Return
1.1%
Cap rate
0.8%
Rent to Value Ratio
Active
$462,500
4
bds
|
3
ba
|
1,708
sqft
|
built
2002
926 Balmoral Dr, Davenport, FL 33896
$-1,265
Cash flow
-14.3%
Cash-on-Cash Return
2.9%
Cap rate
0.5%
Rent to Value Ratio
Active
$389,000
3
bds
|
3
ba
|
2,174
sqft
|
built
2021
1615 Sanibel Dr, Davenport, FL 33896
$-890
Cash flow
-11.9%
Cash-on-Cash Return
3.4%
Cap rate
0.7%
Rent to Value Ratio
Active
$303,000
3
bds
|
3
ba
|
1,682
sqft
|
built
2020
809 Benoi Dr, Davenport, FL 33896
$-718
Cash flow
-12.4%
Cash-on-Cash Return
3.3%
Cap rate
0.8%
Rent to Value Ratio
Active
$580,999
6
bds
|
6
ba
|
3,410
sqft
|
built
2003
143 Windsor Pl, Davenport, FL 33896
$-1,530
Cash flow
-13.7%
Cash-on-Cash Return
3.0%
Cap rate
0.6%
Rent to Value Ratio
Active
$440,000
4
bds
|
3
ba
|
2,029
sqft
|
built
1994
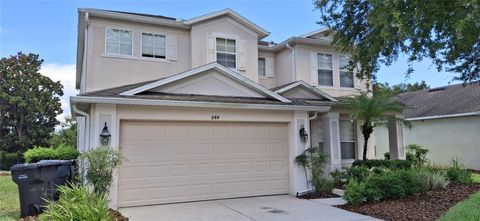
507 Westwind Dr, Davenport, FL 33896
$-767
Cash flow
-9.1%
Cash-on-Cash Return
4.1%
Cap rate
0.6%
Rent to Value Ratio
Active
$630,000
6
bds
|
5
ba
|
3,291
sqft
|
built
2021
1077 Leader St, Davenport, FL 33896
$-2,225
Cash flow
-18.4%
Cash-on-Cash Return
1.9%
Cap rate
0.6%
Rent to Value Ratio
Active
$458,000
3
bds
|
2
ba
|
1,979
sqft
|
built
2021
8907 Fallen Oak Dr, Davenport, FL 33896
$-1,894
Cash flow
-21.6%
Cash-on-Cash Return
1.2%
Cap rate
0.6%
Rent to Value Ratio
Active
$329,990
3
bds
|
2
ba
|
1,280
sqft
|
built
2021
853 Bocavista Ct, Davenport, FL 33896
$-649
Cash flow
-10.3%
Cash-on-Cash Return
3.8%
Cap rate
0.6%
Rent to Value Ratio
Active
$379,500
3
bds
|
2
ba
|
1,787
sqft
|
built
2020
703 Ocean Course Ave, Davenport, FL 33896
$-1,406
Cash flow
-19.3%
Cash-on-Cash Return
1.7%
Cap rate
0.6%
Rent to Value Ratio
Active
$270,500
3
bds
|
2
ba
|
1,893
sqft
|
built
2006
1288 Grady Ln, Davenport, FL 33896
$-760
Cash flow
-14.7%
Cash-on-Cash Return
2.8%
Cap rate
0.7%
Rent to Value Ratio
Active
$729,500
8
bds
|
5
ba
|
3,916
sqft
|
built
2019
303 Ocean Course Ave, Davenport, FL 33896
$-2,339
Cash flow
-16.7%
Cash-on-Cash Return
2.3%
Cap rate
0.6%
Rent to Value Ratio
Active
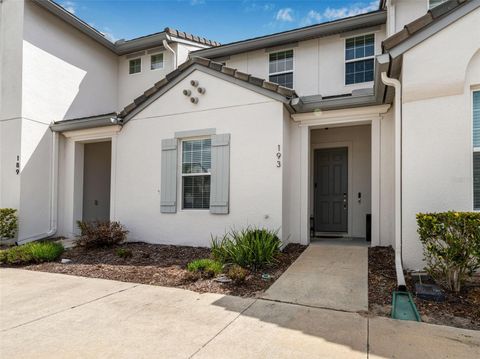
$413,000
3
bds
|
2
ba
|
1,771
sqft
|
built
2018
193 Captiva Dr, Davenport, FL 33896
$-1,252
Cash flow
-15.8%
Cash-on-Cash Return
2.5%
Cap rate
0.6%
Rent to Value Ratio