33896 Investment Properties for Sale
Browse homes for sale and investment properties in 33896. Refine your search by price, property type, or more.
Best cash flowing properties in 33896
Active
$201,000
2
bds
|
2
ba
|
1,134
sqft
|
built
2007
1361 Tuscan Ter, Davenport, FL 33896
$-244
Cash flow
-6.3%
Cash-on-Cash Return
4.7%
Cap rate
0.9%
Rent to Value Ratio
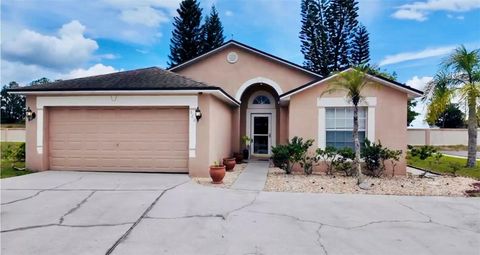
Active
$349,500
4
bds
|
2
ba
|
1,728
sqft
|
built
1996
660 Symphony Pl, Davenport, FL 33896
$-393
Cash flow
-5.9%
Cash-on-Cash Return
4.8%
Cap rate
0.6%
Rent to Value Ratio
156 out of 333 properties for sale in 33896
Limited Results Shown
Create a free account, or log in to reveal all property listings and enjoy the complete experience.
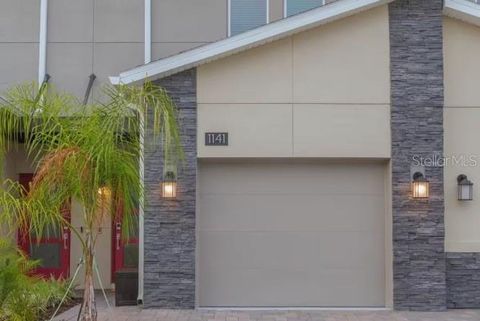
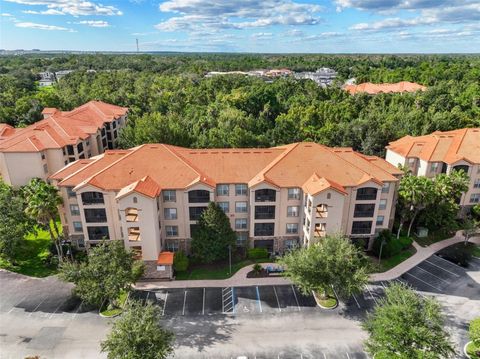
Active
$365,000
3
bds
|
2
ba
|
1,787
sqft
|
built
2021
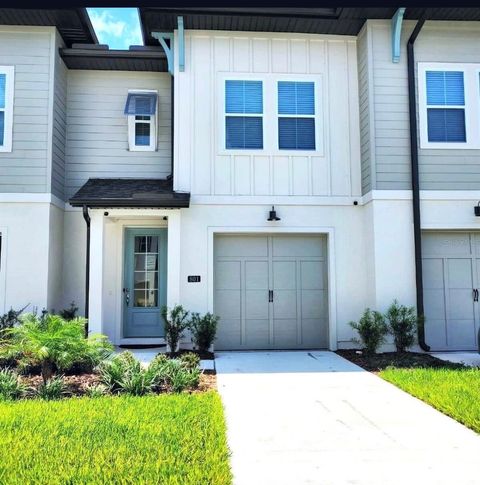
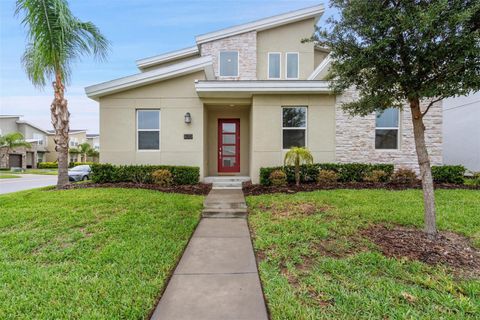
1141 Drop Ln, Davenport, FL 33896
$-953
Cash flow
-13.6%
Cash-on-Cash Return
3.0%
Cap rate
0.6%
Rent to Value Ratio
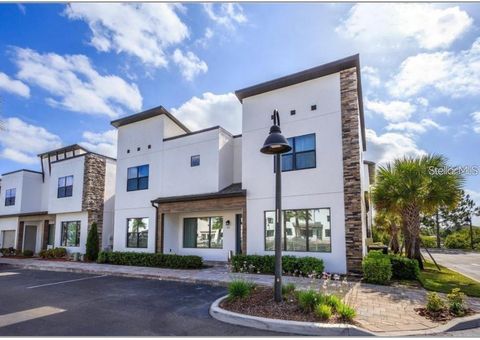
Active
$433,000
3
bds
|
4
ba
|
2,205
sqft
|
built
2022
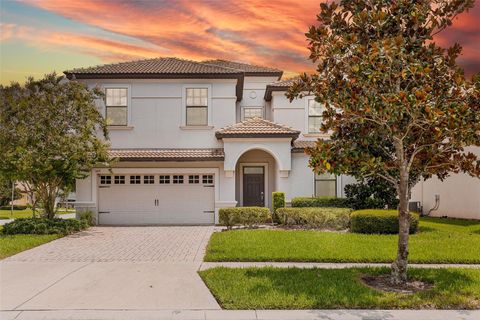
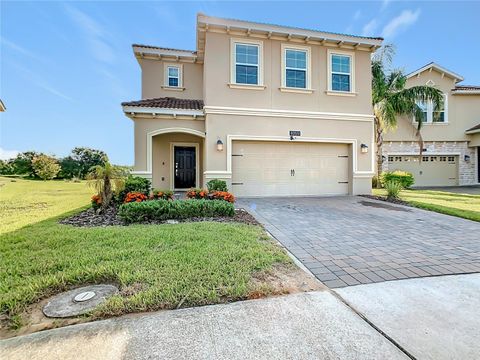
175 Villa Domani Cir, Davenport, FL 33896
$-842
Cash flow
-10.1%
Cash-on-Cash Return
3.8%
Cap rate
0.7%
Rent to Value Ratio
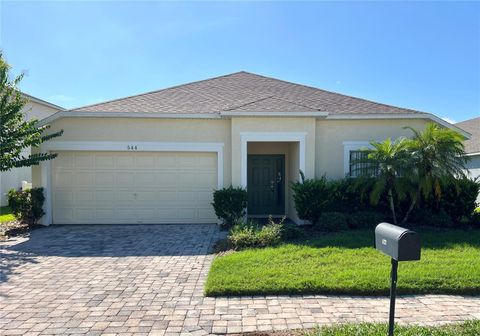
Active
$409,990
5
bds
|
3
ba
|
2,013
sqft
|
built
2001
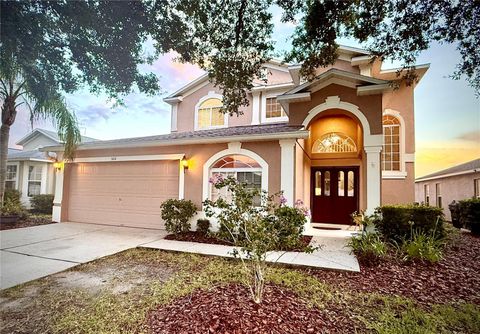
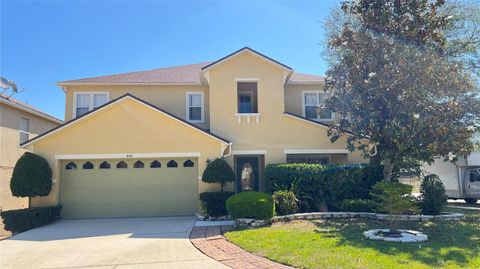
544 Balmoral Dr, Davenport, FL 33896
$-834
Cash flow
-10.6%
Cash-on-Cash Return
3.7%
Cap rate
0.7%
Rent to Value Ratio
Active
$325,000
3
bds
|
2
ba
|
1,690
sqft
|
built
2019
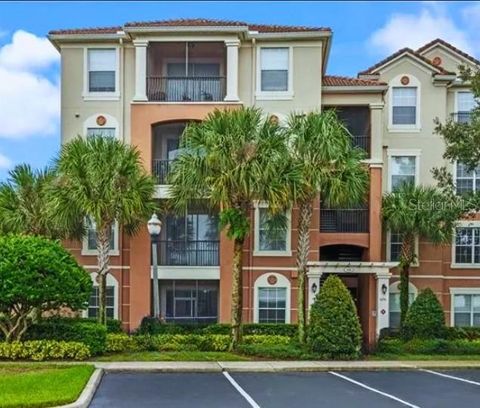
3342 Sonder Dr, Davenport, FL 33896
$-554
Cash flow
-8.9%
Cash-on-Cash Return
4.1%
Cap rate
0.7%
Rent to Value Ratio
Active
$450,000
3
bds
|
2
ba
|
0
sqft
|
built
2023
9100 Oscraft Dr, Davenport, FL 33896
$-1,157
Cash flow
-13.4%
Cash-on-Cash Return
3.1%
Cap rate
0.6%
Rent to Value Ratio
Active
$450,000
3
bds
|
2
ba
|
0
sqft
|
built
2023
915 Overpool Ave, Davenport, FL 33896
$-1,226
Cash flow
-14.2%
Cash-on-Cash Return
2.9%
Cap rate
0.5%
Rent to Value Ratio
Active
$985,000
9
bds
|
5
ba
|
3,909
sqft
|
built
2014
1424 Wexford Way, Davenport, FL 33896
$-3,703
Cash flow
-19.6%
Cash-on-Cash Return
1.6%
Cap rate
0.4%
Rent to Value Ratio
Active
$310,000
3
bds
|
3
ba
|
1,724
sqft
|
built
2019
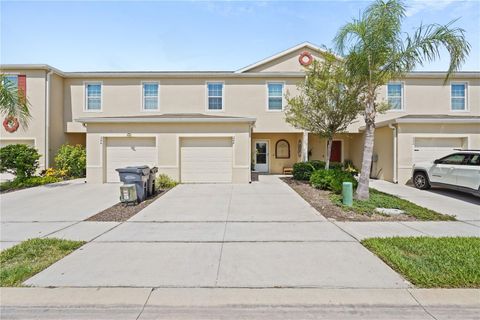
440 Arbor Lakes Dr, Davenport, FL 33896
$-442
Cash flow
-7.4%
Cash-on-Cash Return
4.4%
Cap rate
0.7%
Rent to Value Ratio
Active
$335,000
4
bds
|
2
ba
|
1,364
sqft
|
built
2005
340 Paradise Woods Pl, Davenport, FL 33896
$-631
Cash flow
-9.8%
Cash-on-Cash Return
3.9%
Cap rate
0.7%
Rent to Value Ratio
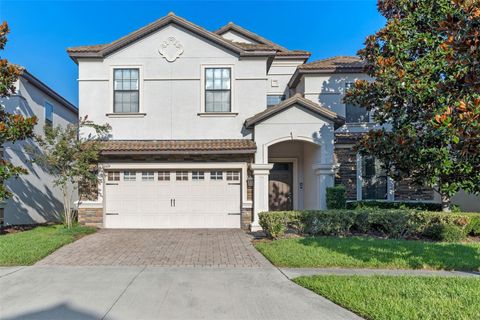
Active
$550,000
5
bds
|
3
ba
|
2,522
sqft
|
built
2020
1359 Shinnecock Hills Dr, Davenport, FL 33896
$-1,847
Cash flow
-17.5%
Cash-on-Cash Return
2.1%
Cap rate
0.5%
Rent to Value Ratio
Active
$518,000
5
bds
|
3
ba
|
2,834
sqft
|
built
2005
526 Henley Cir, Davenport, FL 33896
$-1,053
Cash flow
-10.6%
Cash-on-Cash Return
3.7%
Cap rate
0.6%
Rent to Value Ratio
Active
$350,000
3
bds
|
3
ba
|
1,553
sqft
|
built
2020
801 Benoi Dr, Davenport, FL 33896
$-619
Cash flow
-9.2%
Cash-on-Cash Return
4.0%
Cap rate
0.6%
Rent to Value Ratio
Active
$699,000
8
bds
|
5
ba
|
3,909
sqft
|
built
2014
1419 Wexford Way, Davenport, FL 33896
$-1,806
Cash flow
-13.5%
Cash-on-Cash Return
3.0%
Cap rate
0.7%
Rent to Value Ratio
Active
$215,000
3
bds
|
2
ba
|
1,248
sqft
|
built
2008
8296 Portofino Dr, Davenport, FL 33896
$-945
Cash flow
-22.9%
Cash-on-Cash Return
0.9%
Cap rate
0.8%
Rent to Value Ratio
Active
$500,000
5
bds
|
6
ba
|
2,526
sqft
|
built
2003
308 Windsor Pl, Davenport, FL 33896
$-1,192
Cash flow
-12.4%
Cash-on-Cash Return
3.3%
Cap rate
0.6%
Rent to Value Ratio
Active
$469,000
5
bds
|
6
ba
|
2,277
sqft
|
built
2003
329 Windsor Pl, Davenport, FL 33896
$-1,182
Cash flow
-13.1%
Cash-on-Cash Return
3.1%
Cap rate
0.6%
Rent to Value Ratio
Active
$735,000
8
bds
|
5
ba
|
3,909
sqft
|
built
2013
1403 Moon Valley Dr, Davenport, FL 33896
$-2,266
Cash flow
-16.1%
Cash-on-Cash Return
2.4%
Cap rate
0.5%
Rent to Value Ratio
Active
$399,999
4
bds
|
2
ba
|
1,815
sqft
|
built
1999
129 Wall Ave, Davenport, FL 33896
$-533
Cash flow
-7.0%
Cash-on-Cash Return
4.5%
Cap rate
0.6%
Rent to Value Ratio
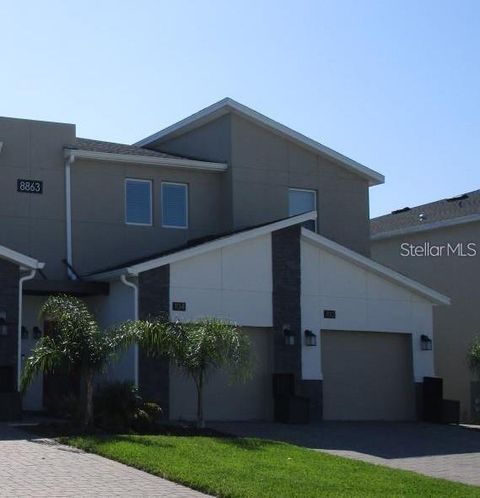
Active
$444,900
3
bds
|
2
ba
|
1,788
sqft
|
built
2023
8863 Cabot Cliffs Dr, Davenport, FL 33896
$-1,265
Cash flow
-14.8%
Cash-on-Cash Return
2.7%
Cap rate
0.6%
Rent to Value Ratio
Active
$615,000
7
bds
|
5
ba
|
4,019
sqft
|
built
2020
691 Sticks St, Davenport, FL 33896
$-1,975
Cash flow
-16.8%
Cash-on-Cash Return
2.3%
Cap rate
0.7%
Rent to Value Ratio
Active
$619,000
6
bds
|
6
ba
|
3,063
sqft
|
built
2013
1431 Moon Valley Dr, Davenport, FL 33896
$-1,177
Cash flow
-9.9%
Cash-on-Cash Return
3.9%
Cap rate
0.6%
Rent to Value Ratio
Active
$299,999
2
bds
|
2
ba
|
1,388
sqft
|
built
2021
1153 Drop Ln, Davenport, FL 33896
$-855
Cash flow
-14.9%
Cash-on-Cash Return
2.7%
Cap rate
0.7%
Rent to Value Ratio
Active
$875,000
8
bds
|
5
ba
|
3,909
sqft
|
built
2013
1430 Moon Valley Dr, Davenport, FL 33896
$-3,425
Cash flow
-20.4%
Cash-on-Cash Return
1.4%
Cap rate
0.4%
Rent to Value Ratio
Active
$350,000
3
bds
|
2
ba
|
1,624
sqft
|
built
2022
1481 Discovery St, Davenport, FL 33896
$-677
Cash flow
-10.1%
Cash-on-Cash Return
3.8%
Cap rate
0.7%
Rent to Value Ratio
Active
$399,999
3
bds
|
3
ba
|
2,402
sqft
|
built
2006
8308 Riverdale Ln, Davenport, FL 33896
$-1,632
Cash flow
-21.3%
Cash-on-Cash Return
1.3%
Cap rate
0.6%
Rent to Value Ratio
Active
$625,000
5
bds
|
3
ba
|
3,623
sqft
|
built
2015
1303 Sea Pines Way, Davenport, FL 33896
$-1,918
Cash flow
-16.0%
Cash-on-Cash Return
2.5%
Cap rate
0.6%
Rent to Value Ratio
Active
$385,000
4
bds
|
4
ba
|
1,746
sqft
|
built
2006
303 Earlmont Pl, Davenport, FL 33896
$-914
Cash flow
-12.4%
Cash-on-Cash Return
3.3%
Cap rate
0.6%
Rent to Value Ratio
Active
$474,900
5
bds
|
4
ba
|
2,609
sqft
|
built
2007
101 Cypress Pointe Ct, Davenport, FL 33896
$-1,036
Cash flow
-11.4%
Cash-on-Cash Return
3.5%
Cap rate
0.6%
Rent to Value Ratio
Active
$289,900
3
bds
|
3
ba
|
1,741
sqft
|
built
2018
1205 Royal St George Blvd, Davenport, FL 33896
$-785
Cash flow
-14.1%
Cash-on-Cash Return
2.9%
Cap rate
0.9%
Rent to Value Ratio
Active
$749,000
6
bds
|
6
ba
|
3,063
sqft
|
built
2015
1510 Rolling Fairway Dr, Davenport, FL 33896
$-2,366
Cash flow
-16.5%
Cash-on-Cash Return
2.4%
Cap rate
0.5%
Rent to Value Ratio
Active
$439,999
5
bds
|
3
ba
|
3,033
sqft
|
built
2007
446 Rosselli Blvd, Davenport, FL 33896
$-1,181
Cash flow
-14.0%
Cash-on-Cash Return
2.9%
Cap rate
0.5%
Rent to Value Ratio
Active
$419,000
3
bds
|
3
ba
|
2,076
sqft
|
built
2020
1059 Blackwolf Run Rd, Davenport, FL 33896
$-1,625
Cash flow
-20.2%
Cash-on-Cash Return
1.5%
Cap rate
0.6%
Rent to Value Ratio
Active
$300,000
3
bds
|
3
ba
|
1,507
sqft
|
built
2017
248 Arbor Lakes Dr, Davenport, FL 33896
$-517
Cash flow
-9.0%
Cash-on-Cash Return
4.1%
Cap rate
0.7%
Rent to Value Ratio
Active
$780,000
7
bds
|
5
ba
|
4,019
sqft
|
built
2020
870 Drop Shot Dr, Davenport, FL 33896
$-2,297
Cash flow
-15.4%
Cash-on-Cash Return
2.6%
Cap rate
0.6%
Rent to Value Ratio
Active
$620,000
5
bds
|
4
ba
|
3,221
sqft
|
built
2008
115 Essex Pl, Davenport, FL 33896
$-1,248
Cash flow
-10.5%
Cash-on-Cash Return
3.7%
Cap rate
0.6%
Rent to Value Ratio
Active
$710,000
6
bds
|
6
ba
|
3,850
sqft
|
built
2021
9338 Sommerset Hills Dr, Davenport, FL 33896
$-2,452
Cash flow
-18.0%
Cash-on-Cash Return
2.0%
Cap rate
0.5%
Rent to Value Ratio
Active
$724,000
5
bds
|
4
ba
|
4,838
sqft
|
built
2021
1457 Mickelson Ct, Davenport, FL 33896
$-1,972
Cash flow
-14.2%
Cash-on-Cash Return
2.9%
Cap rate
0.7%
Rent to Value Ratio
Active
$664,900
6
bds
|
6
ba
|
3,339
sqft
|
built
2016
1534 Moon Valley Dr, Davenport, FL 33896
$-2,002
Cash flow
-15.7%
Cash-on-Cash Return
2.5%
Cap rate
0.6%
Rent to Value Ratio