34450 Investment Properties for Sale
Browse homes for sale and investment properties in 34450. Refine your search by price, property type, or more.
Best cash flowing properties in 34450
Active
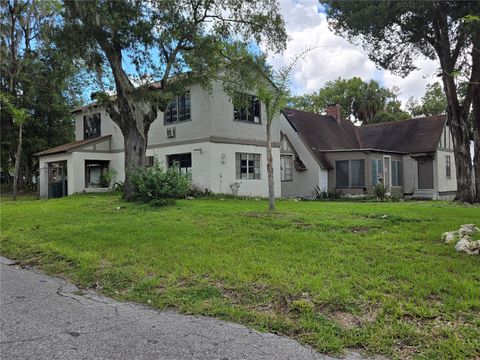
$120,000
4
bds
|
2
ba
|
2,192
sqft
|
built
1908
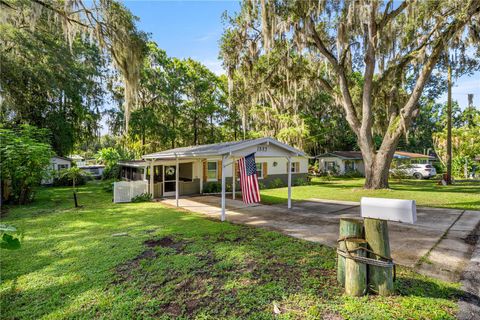
201 Talmage Ave, Inverness, FL 34450
$304
Cash flow
13.2%
Cash-on-Cash Return
9.2%
Cap rate
1.5%
Rent to Value Ratio

Active
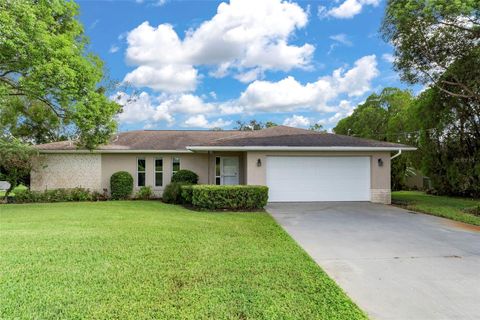
$185,000
3
bds
|
1
ba
|
1,150
sqft
|
built
1970
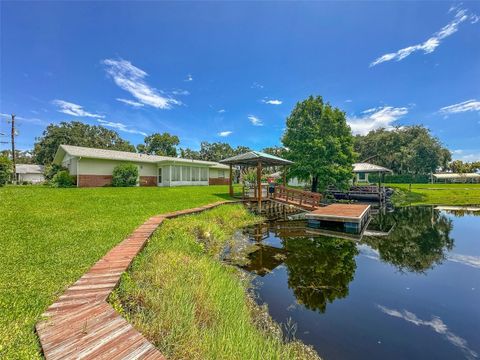
822 S Honey Way, Inverness, FL 34450
$-24
Cash flow
-0.7%
Cash-on-Cash Return
6.0%
Cap rate
0.9%
Rent to Value Ratio
32 out of 37 properties for sale in 34450
Limited Results Shown
Create a free account, or log in to reveal all property listings and enjoy the complete experience.
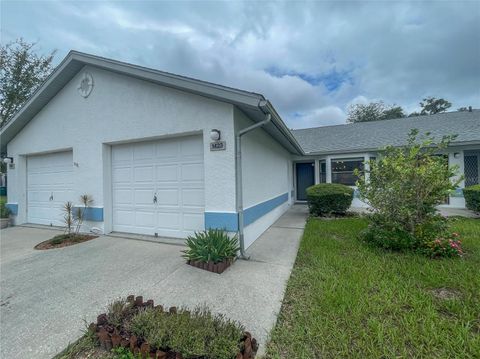
Active
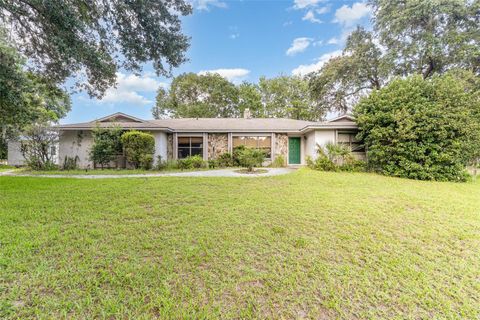
$279,900
2
bds
|
2
ba
|
1,608
sqft
|
built
1979
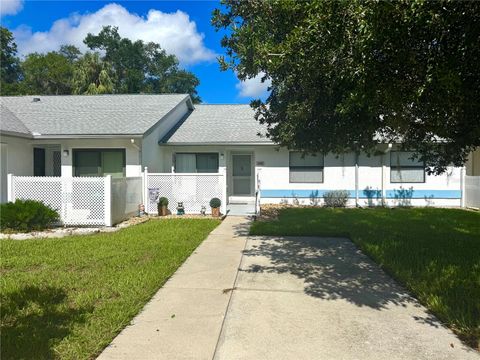
8505 E Sandpiper Dr, Inverness, FL 34450
$-360
Cash flow
-6.7%
Cash-on-Cash Return
4.6%
Cap rate
0.6%
Rent to Value Ratio

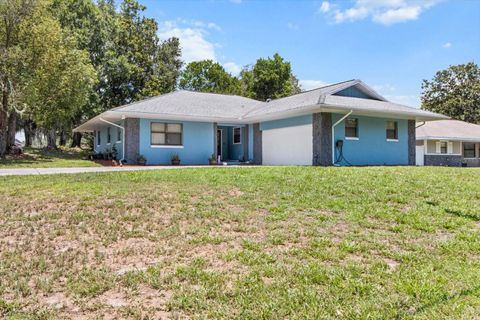
Active
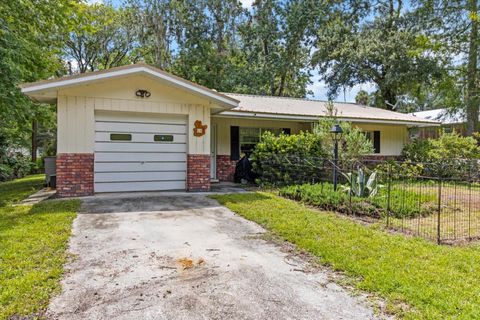
$330,000
2
bds
|
3
ba
|
1,561
sqft
|
built
1978
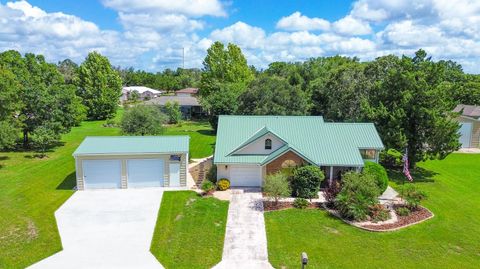
212 S Ferndale Ter, Inverness, FL 34450
$-553
Cash flow
-8.7%
Cash-on-Cash Return
4.1%
Cap rate
0.6%
Rent to Value Ratio
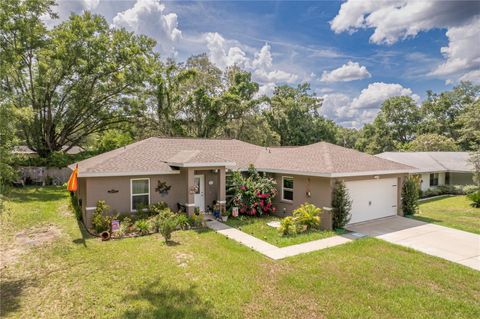
Active
$350,000
3
bds
|
2
ba
|
2,280
sqft
|
built
1983
3203 S Skyline Dr, Inverness, FL 34450
$-695
Cash flow
-10.4%
Cash-on-Cash Return
3.8%
Cap rate
0.6%
Rent to Value Ratio
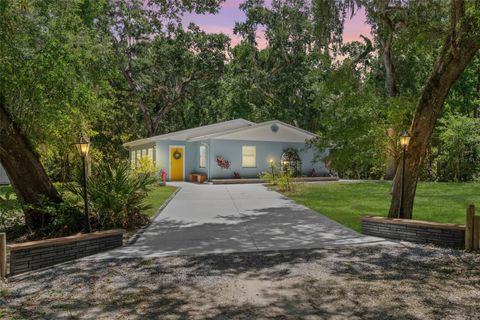
Active
$250,000
2
bds
|
1
ba
|
1,076
sqft
|
built
1973
516 S Tuck Pt, Inverness, FL 34450
$-237
Cash flow
-4.9%
Cash-on-Cash Return
5.0%
Cap rate
0.7%
Rent to Value Ratio
Active
$325,000
2
bds
|
1
ba
|
1,281
sqft
|
built
1959
1885 S Westlake Dr, Inverness, FL 34450
$-630
Cash flow
-10.1%
Cash-on-Cash Return
3.8%
Cap rate
0.5%
Rent to Value Ratio
Active
$310,000
2
bds
|
2
ba
|
1,106
sqft
|
built
1976
1220 Mossy Oak Dr, Inverness, FL 34450
$-70
Cash flow
-1.2%
Cash-on-Cash Return
5.9%
Cap rate
0.7%
Rent to Value Ratio
Active
$168,500
2
bds
|
2
ba
|
959
sqft
|
built
1987
475 Landing Blvd, Inverness, FL 34450
$-257
Cash flow
-8.0%
Cash-on-Cash Return
4.3%
Cap rate
0.9%
Rent to Value Ratio

Active
$204,900
3
bds
|
4
ba
|
3,360
sqft
|
built
1956
204 Davidson Ave, Inverness, FL 34450
$-147
Cash flow
-3.7%
Cash-on-Cash Return
5.3%
Cap rate
0.9%
Rent to Value Ratio
Active
$359,000
2
bds
|
2
ba
|
1,347
sqft
|
built
1986
8725 E Rosemont Ct, Inverness, FL 34450
$-606
Cash flow
-8.8%
Cash-on-Cash Return
4.1%
Cap rate
0.5%
Rent to Value Ratio
Active
$174,000
2
bds
|
2
ba
|
959
sqft
|
built
1989
1423 Longboat Pt, Inverness, FL 34450
$-101
Cash flow
-3.0%
Cash-on-Cash Return
5.4%
Cap rate
0.9%
Rent to Value Ratio

Active
$270,000
3
bds
|
2
ba
|
1,404
sqft
|
built
1966
10115 E Perch Ct, Inverness, FL 34450
$-91
Cash flow
-1.8%
Cash-on-Cash Return
5.7%
Cap rate
0.9%
Rent to Value Ratio

Active
$280,000
3
bds
|
2
ba
|
1,566
sqft
|
built
1992
3111 S Blackmountain Dr, Inverness, FL 34450
$-213
Cash flow
-4.0%
Cash-on-Cash Return
5.2%
Cap rate
0.7%
Rent to Value Ratio
Active
$265,000
3
bds
|
2
ba
|
1,514
sqft
|
built
1986
3499 S Stroud Ter, Inverness, FL 34450
$-311
Cash flow
-6.1%
Cash-on-Cash Return
4.7%
Cap rate
0.6%
Rent to Value Ratio
Active
$265,000
3
bds
|
2
ba
|
1,248
sqft
|
built
2021
1123 E Bucknell Ave, Inverness, FL 34450
$-26
Cash flow
-0.5%
Cash-on-Cash Return
6.0%
Cap rate
0.8%
Rent to Value Ratio
Active
$389,900
3
bds
|
2
ba
|
1,688
sqft
|
built
1985
4645 S Ironwood Pt, Inverness, FL 34450
$-670
Cash flow
-9.0%
Cash-on-Cash Return
4.1%
Cap rate
0.6%
Rent to Value Ratio
Active
$389,900
4
bds
|
3
ba
|
2,152
sqft
|
built
1989
3231 S Eagle Pt, Inverness, FL 34450
$-530
Cash flow
-7.1%
Cash-on-Cash Return
4.5%
Cap rate
0.6%
Rent to Value Ratio
Active
$483,000
5
bds
|
4
ba
|
2,414
sqft
|
built
2023
9495 E Baymeadows Dr, Inverness, FL 34450
$-1,021
Cash flow
-11.0%
Cash-on-Cash Return
3.6%
Cap rate
0.6%
Rent to Value Ratio
Active
$569,900
3
bds
|
2
ba
|
1,612
sqft
|
built
1986
3915 S Spaniel Trl, Inverness, FL 34450
$-1,606
Cash flow
-14.7%
Cash-on-Cash Return
2.8%
Cap rate
0.4%
Rent to Value Ratio

Active
$214,900
2
bds
|
1
ba
|
962
sqft
|
built
1967
101 S Lunar Ter, Inverness, FL 34450
$-171
Cash flow
-4.2%
Cash-on-Cash Return
5.2%
Cap rate
0.7%
Rent to Value Ratio
Active
$219,999
2
bds
|
2
ba
|
933
sqft
|
built
1968
138 S Lunar Ter, Inverness, FL 34450
$-106
Cash flow
-2.5%
Cash-on-Cash Return
5.6%
Cap rate
0.7%
Rent to Value Ratio
Active
$249,000
3
bds
|
2
ba
|
1,276
sqft
|
built
1993
3341 S Jean Pt, Inverness, FL 34450
$-80
Cash flow
-1.7%
Cash-on-Cash Return
5.8%
Cap rate
0.7%
Rent to Value Ratio
Active
$799,000
2
bds
|
3
ba
|
1,809
sqft
|
built
1973
1005 S Sands Paradise Pt, Inverness, FL 34450
$-2,962
Cash flow
-19.3%
Cash-on-Cash Return
1.7%
Cap rate
0.3%
Rent to Value Ratio

Active
$299,900
3
bds
|
2
ba
|
1,802
sqft
|
built
1988
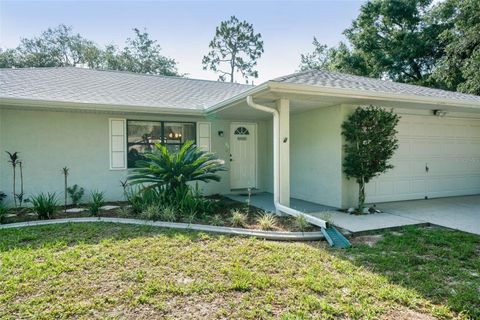
4893 S Old Floral City Rd, Inverness, FL 34450
$-454
Cash flow
-7.9%
Cash-on-Cash Return
4.3%
Cap rate
0.6%
Rent to Value Ratio

Active
$299,000
3
bds
|
2
ba
|
1,707
sqft
|
built
1973
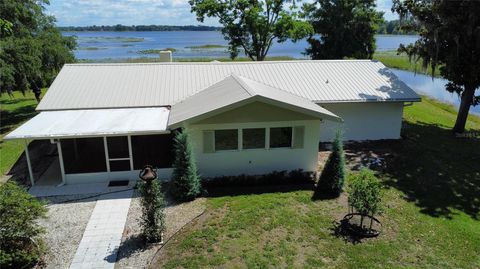
1406 Eden Dr, Inverness, FL 34450
$-534
Cash flow
-9.3%
Cash-on-Cash Return
4.0%
Cap rate
0.7%
Rent to Value Ratio

Active
$394,900
3
bds
|
2
ba
|
1,276
sqft
|
built
1981
490 S Minstrel Ave, Inverness, FL 34450
$-813
Cash flow
-10.7%
Cash-on-Cash Return
3.7%
Cap rate
0.6%
Rent to Value Ratio
Active
$340,000
3
bds
|
2
ba
|
1,341
sqft
|
built
1980
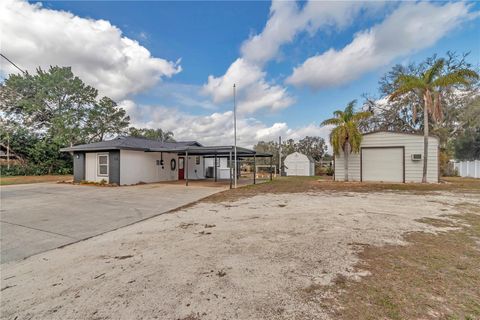
9019 E Gulf To Lake Hwy, Inverness, FL 34450
$-405
Cash flow
-6.2%
Cash-on-Cash Return
4.7%
Cap rate
0.7%
Rent to Value Ratio
Active
$199,000
2
bds
|
2
ba
|
945
sqft
|
built
1988
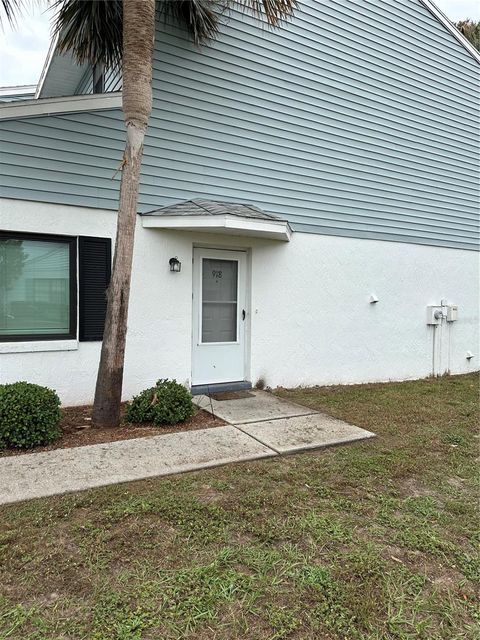
918 Pritchard Island Rd, Inverness, FL 34450
$-212
Cash flow
-5.6%
Cash-on-Cash Return
4.9%
Cap rate
1.0%
Rent to Value Ratio

Active
$1,400,000
5
bds
|
6
ba
|
4,786
sqft
|
built
1968
8711 E Cresco Ln, Inverness, FL 34450
$-4,404
Cash flow
-16.4%
Cash-on-Cash Return
2.4%
Cap rate
0.3%
Rent to Value Ratio
Active
$229,000
2
bds
|
2
ba
|
1,220
sqft
|
built
1990
9771 E Pebble Creek Ct, Inverness, FL 34450
$-159
Cash flow
-3.6%
Cash-on-Cash Return
5.3%
Cap rate
0.8%
Rent to Value Ratio

Active
$248,000
3
bds
|
2
ba
|
1,376
sqft
|
built
2008
1221 Emerson St, Inverness, FL 34450
$-98
Cash flow
-2.1%
Cash-on-Cash Return
5.7%
Cap rate
0.7%
Rent to Value Ratio