34474 Investment Properties for Sale
Browse homes for sale and investment properties in 34474. Refine your search by price, property type, or more.
Best cash flowing properties in 34474
Active
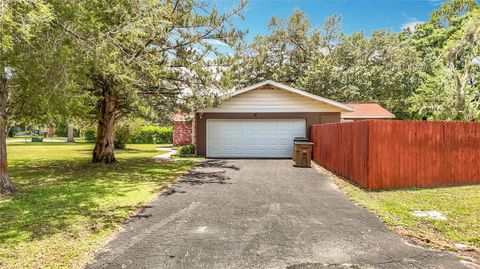
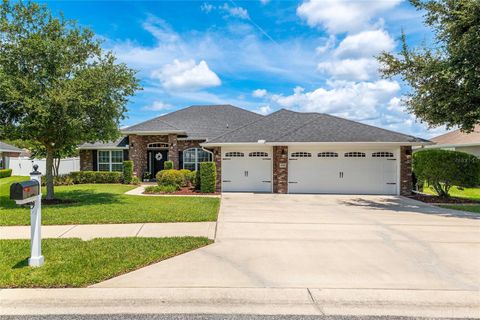
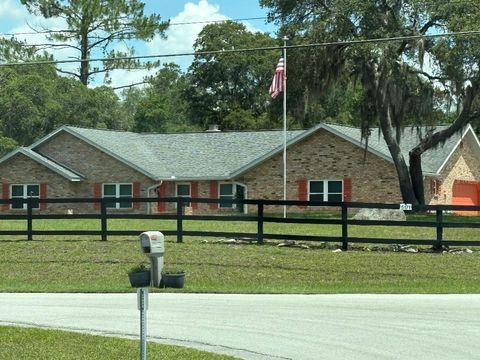
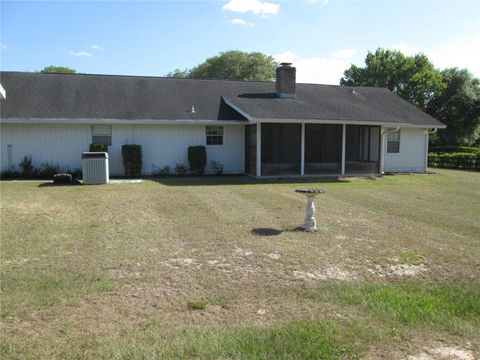
$235,000
3
bds
|
2
ba
|
1,784
sqft
|
built
1978
2510 SW 34th Ave, Ocala, FL 34474
$21
Cash flow
0.5%
Cash-on-Cash Return
6.3%
Cap rate
0.9%
Rent to Value Ratio

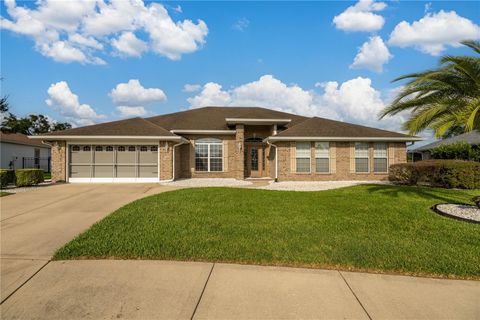
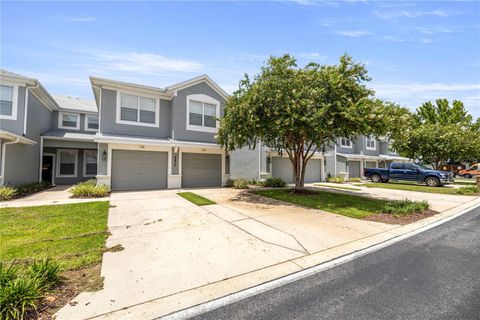
Active
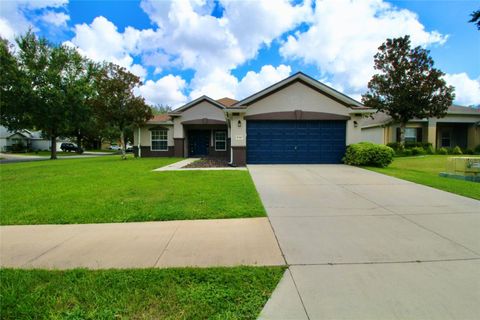
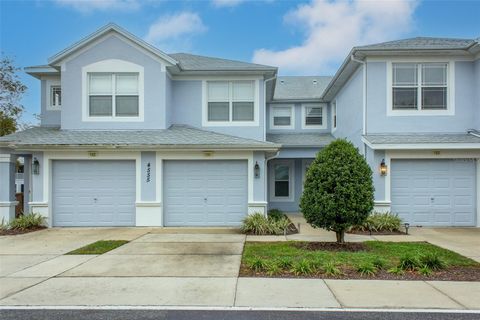
$300,000
3
bds
|
2
ba
|
1,720
sqft
|
built
2005
6470 SW 50th Ct, Ocala, FL 34474
$-134
Cash flow
-2.3%
Cash-on-Cash Return
5.6%
Cap rate
0.8%
Rent to Value Ratio
29 out of 38 properties for sale in 34474
Limited Results Shown
Create a free account, or log in to reveal all property listings and enjoy the complete experience.
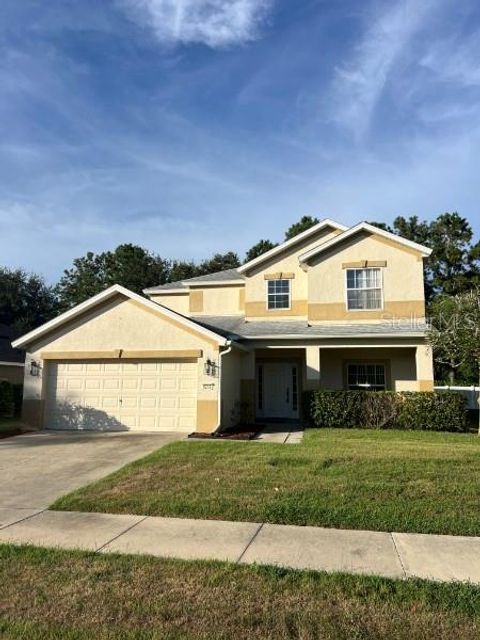
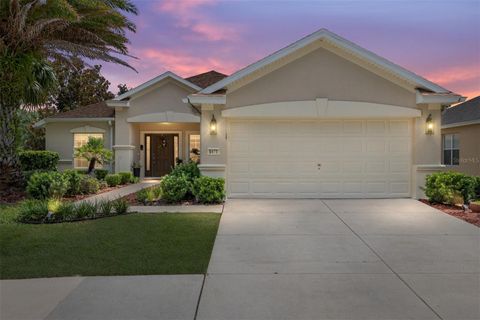
Active
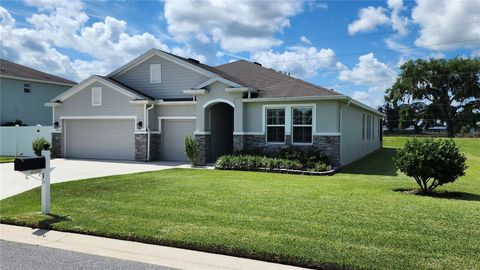
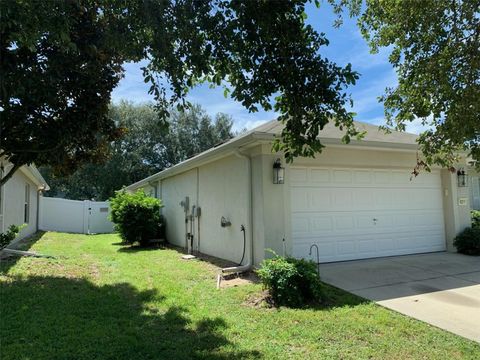
$380,000
4
bds
|
3
ba
|
3,000
sqft
|
built
2008
4380 SW 62nd Loop, Ocala, FL 34474
$-589
Cash flow
-8.1%
Cash-on-Cash Return
4.3%
Cap rate
0.7%
Rent to Value Ratio
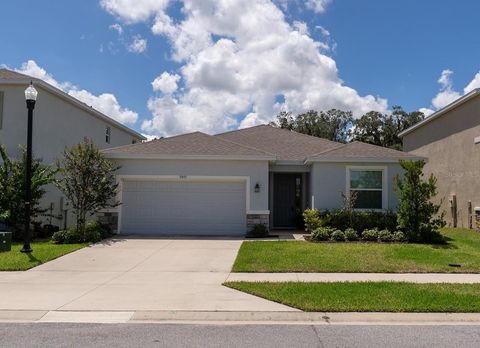
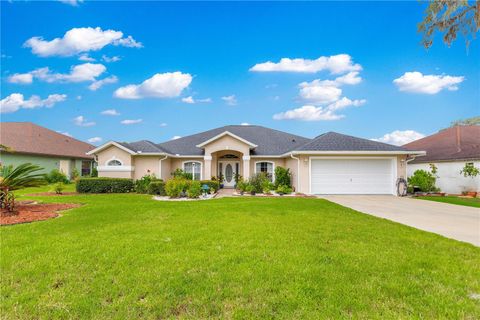
Active
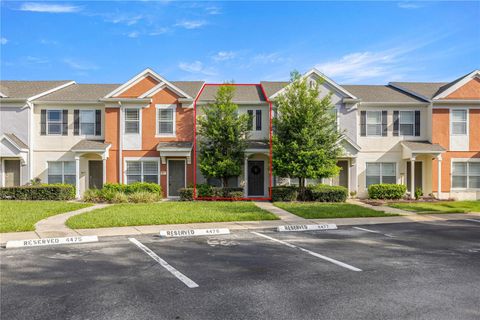
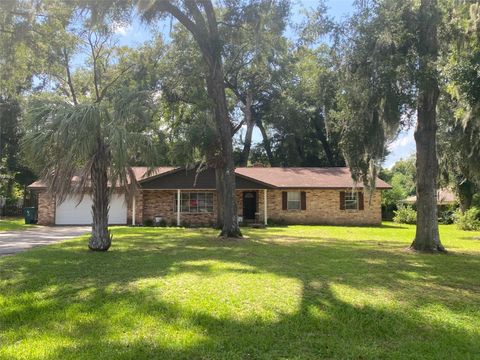
$360,000
4
bds
|
4
ba
|
2,510
sqft
|
built
2006
5073 SW 40th Pl, Ocala, FL 34474
$-819
Cash flow
-11.9%
Cash-on-Cash Return
3.4%
Cap rate
0.6%
Rent to Value Ratio
Active
$359,900
4
bds
|
3
ba
|
2,053
sqft
|
built
2023
5445 SW 44th Court Rd, Ocala, FL 34474
$-959
Cash flow
-13.9%
Cash-on-Cash Return
3.0%
Cap rate
0.6%
Rent to Value Ratio
Active
$425,000
4
bds
|
3
ba
|
2,226
sqft
|
built
2014
4743 SW 62nd Pl, Ocala, FL 34474
$-932
Cash flow
-11.4%
Cash-on-Cash Return
3.5%
Cap rate
0.5%
Rent to Value Ratio
Active
$319,900
4
bds
|
2
ba
|
2,185
sqft
|
built
2006
5739 SW 40th St, Ocala, FL 34474
$-446
Cash flow
-7.3%
Cash-on-Cash Return
4.5%
Cap rate
0.7%
Rent to Value Ratio
Active
$475,000
4
bds
|
4
ba
|
2,830
sqft
|
built
2019
4514 SW 65th Pl, Ocala, FL 34474
$-1,024
Cash flow
-11.2%
Cash-on-Cash Return
3.6%
Cap rate
0.6%
Rent to Value Ratio
Active
$210,000
2
bds
|
3
ba
|
1,134
sqft
|
built
2006
4478 SW 49th Ave, Ocala, FL 34474
$-466
Cash flow
-11.6%
Cash-on-Cash Return
3.5%
Cap rate
0.7%
Rent to Value Ratio
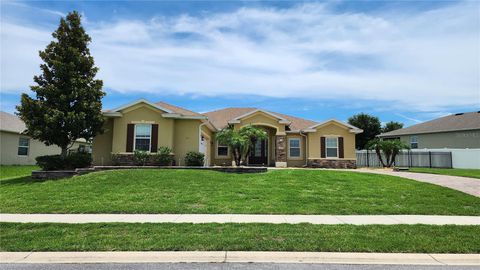
Active
$445,000
3
bds
|
2
ba
|
2,107
sqft
|
built
1985
5171 SW 31st St, Ocala, FL 34474
$-842
Cash flow
-9.9%
Cash-on-Cash Return
3.9%
Cap rate
0.6%
Rent to Value Ratio
Active
$239,900
3
bds
|
2
ba
|
1,864
sqft
|
built
2006
4570 SW 52nd Cir, Ocala, FL 34474
$-433
Cash flow
-9.4%
Cash-on-Cash Return
4.0%
Cap rate
0.7%
Rent to Value Ratio
Active
$329,000
4
bds
|
2
ba
|
2,185
sqft
|
built
2006
5471 SW 40th St, Ocala, FL 34474
$-558
Cash flow
-8.8%
Cash-on-Cash Return
4.1%
Cap rate
0.7%
Rent to Value Ratio
Active
$379,000
4
bds
|
2
ba
|
2,421
sqft
|
built
2005
6470 SW 51st Ter, Ocala, FL 34474
$-604
Cash flow
-8.3%
Cash-on-Cash Return
4.2%
Cap rate
0.7%
Rent to Value Ratio
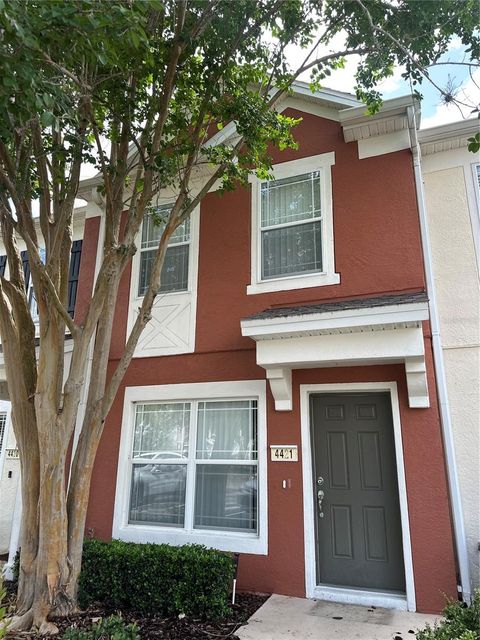
Active
$189,000
2
bds
|
3
ba
|
1,134
sqft
|
built
2005
4421 SW 49th Ave, Ocala, FL 34474
$-465
Cash flow
-12.8%
Cash-on-Cash Return
3.2%
Cap rate
0.8%
Rent to Value Ratio
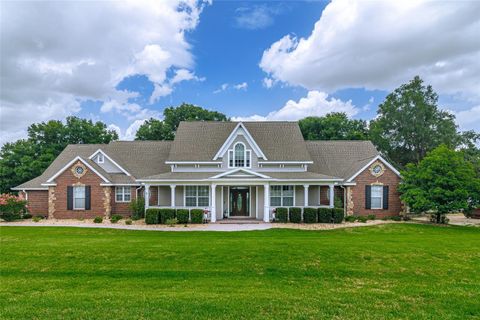
Active
$995,000
3
bds
|
4
ba
|
3,467
sqft
|
built
2006
5795 SW 43rd Pl, Ocala, FL 34474
$-3,124
Cash flow
-16.4%
Cash-on-Cash Return
2.4%
Cap rate
0.4%
Rent to Value Ratio
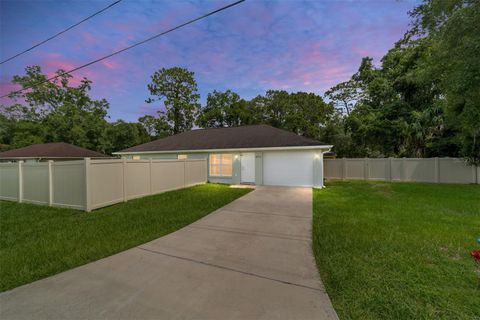
Active
$245,000
3
bds
|
2
ba
|
1,260
sqft
|
built
2018
2711 SW 17th Cir, Ocala, FL 34474
$-452
Cash flow
-9.6%
Cash-on-Cash Return
3.9%
Cap rate
0.7%
Rent to Value Ratio
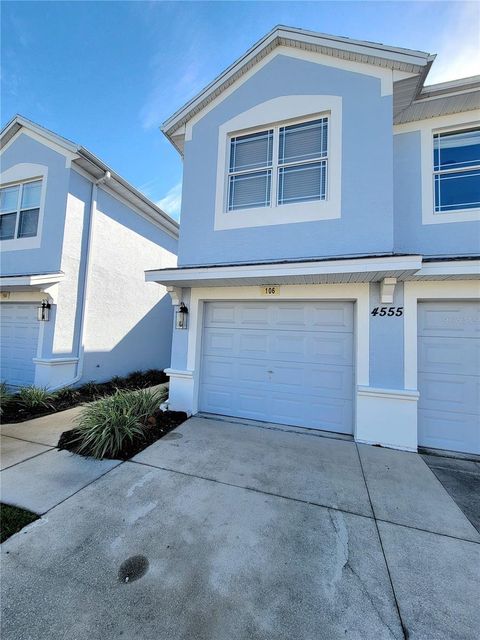
Active
$239,000
3
bds
|
2
ba
|
1,864
sqft
|
built
2006
4555 SW 52nd Cir, Ocala, FL 34474
$-648
Cash flow
-14.1%
Cash-on-Cash Return
2.9%
Cap rate
0.8%
Rent to Value Ratio
Active
$450,000
3
bds
|
3
ba
|
2,592
sqft
|
built
2018
6429 SW 45th Ave, Ocala, FL 34474
$-1,135
Cash flow
-13.2%
Cash-on-Cash Return
3.1%
Cap rate
0.6%
Rent to Value Ratio
Active
$380,000
4
bds
|
4
ba
|
2,510
sqft
|
built
2005
3921 SW 51st Ter, Ocala, FL 34474
$-1,001
Cash flow
-13.7%
Cash-on-Cash Return
3.0%
Cap rate
0.6%
Rent to Value Ratio
Active
$375,000
4
bds
|
3
ba
|
2,342
sqft
|
built
2006
4940 SW 63rd Loop, Ocala, FL 34474
$-725
Cash flow
-10.1%
Cash-on-Cash Return
3.8%
Cap rate
0.7%
Rent to Value Ratio
Active
$169,000
2
bds
|
3
ba
|
1,134
sqft
|
built
2005
4429 SW 49th Ave, Ocala, FL 34474
$-391
Cash flow
-12.1%
Cash-on-Cash Return
3.4%
Cap rate
0.8%
Rent to Value Ratio
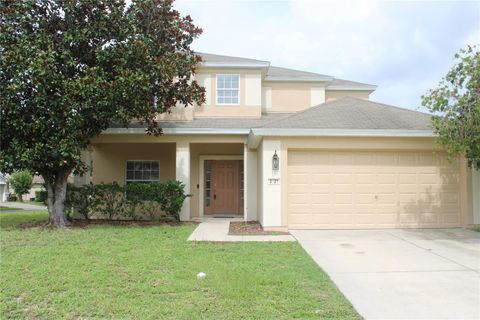
Active
$289,000
3
bds
|
2
ba
|
1,516
sqft
|
built
1968
4116 SW 20th St, Ocala, FL 34474
$-595
Cash flow
-10.7%
Cash-on-Cash Return
3.7%
Cap rate
0.6%
Rent to Value Ratio
Active
$380,000
4
bds
|
3
ba
|
2,342
sqft
|
built
2006
4990 SW 63rd Loop, Ocala, FL 34474
$-630
Cash flow
-8.6%
Cash-on-Cash Return
4.2%
Cap rate
0.7%
Rent to Value Ratio
Active
$247,400
3
bds
|
3
ba
|
1,584
sqft
|
built
2006
4927 SW 45th Cir, Ocala, FL 34474
$-702
Cash flow
-14.8%
Cash-on-Cash Return
2.7%
Cap rate
0.7%
Rent to Value Ratio
Active
$455,000
4
bds
|
2
ba
|
1,996
sqft
|
built
2016
6436 SW 44th Ct, Ocala, FL 34474
$-961
Cash flow
-11.0%
Cash-on-Cash Return
3.6%
Cap rate
0.5%
Rent to Value Ratio
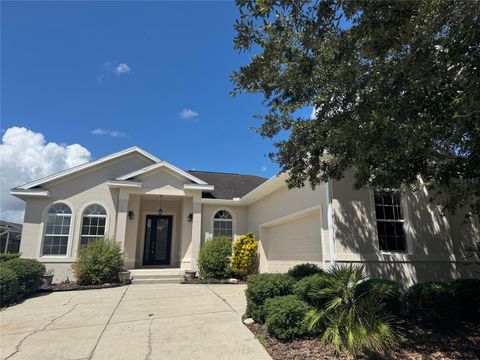
Active
$419,000
3
bds
|
2
ba
|
1,806
sqft
|
built
1985
5355 SW 31st St, Ocala, FL 34474
$-1,204
Cash flow
-15.0%
Cash-on-Cash Return
2.7%
Cap rate
0.5%
Rent to Value Ratio
Active
$220,000
2
bds
|
2
ba
|
1,490
sqft
|
built
2006
4555 SW 52nd Cir, Ocala, FL 34474
$-460
Cash flow
-10.9%
Cash-on-Cash Return
3.6%
Cap rate
0.7%
Rent to Value Ratio
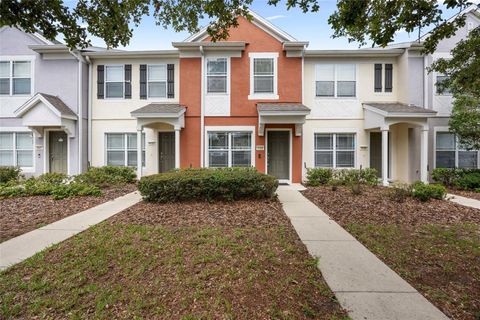
Active
$259,900
3
bds
|
2
ba
|
1,714
sqft
|
built
2005
4311 SW 53rd Ter, Ocala, FL 34474
$-708
Cash flow
-14.2%
Cash-on-Cash Return
2.9%
Cap rate
0.7%
Rent to Value Ratio
Active
$309,000
3
bds
|
2
ba
|
1,938
sqft
|
built
1979
2710 SW 36th Dr, Ocala, FL 34474
$-383
Cash flow
-6.5%
Cash-on-Cash Return
4.7%
Cap rate
0.7%
Rent to Value Ratio