34476 Investment Properties for Sale
Browse homes for sale and investment properties in 34476. Refine your search by price, property type, or more.
Best cash flowing properties in 34476
Active
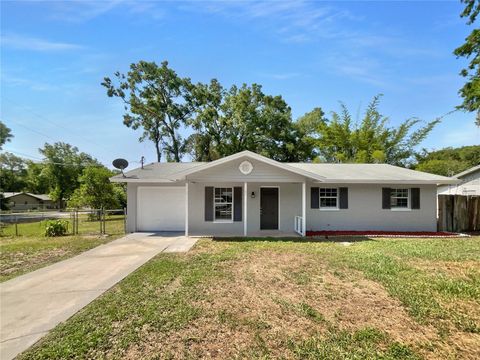
$237,000
3
bds
|
2
ba
|
936
sqft
|
built
1972
7614 SW 80th St, Ocala, FL 34476
$-254
Cash flow
-5.6%
Cash-on-Cash Return
4.9%
Cap rate
0.7%
Rent to Value Ratio
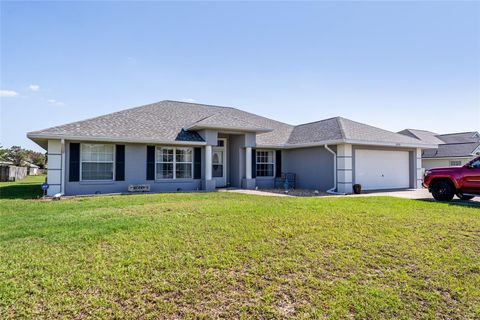
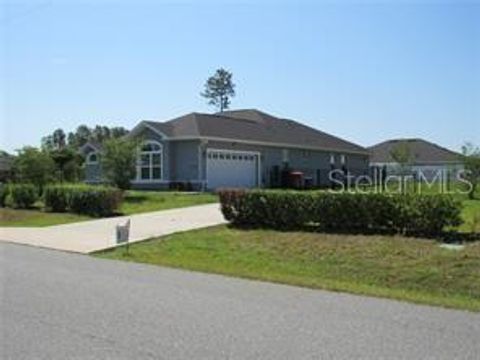
Active
$309,905
3
bds
|
2
ba
|
2,374
sqft
|
built
2001
5920 SW 88th Pl, Ocala, FL 34476
$-297
Cash flow
-5.0%
Cash-on-Cash Return
5.0%
Cap rate
0.7%
Rent to Value Ratio
29 out of 46 properties for sale in 34476
Limited Results Shown
Create a free account, or log in to reveal all property listings and enjoy the complete experience.
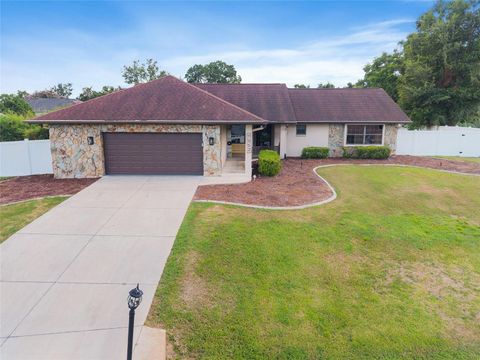
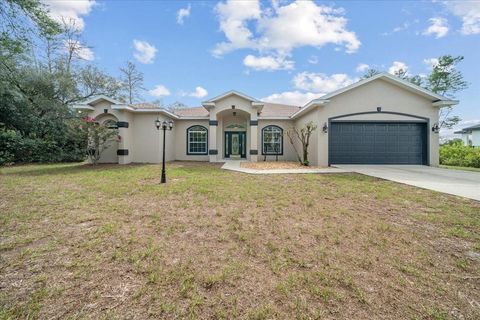
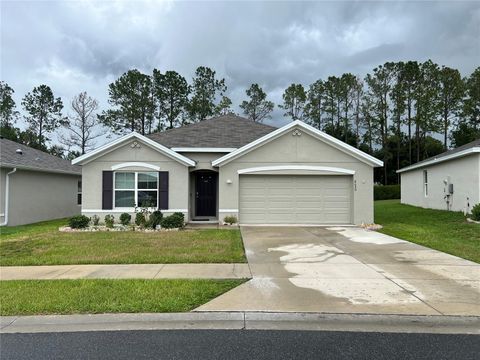
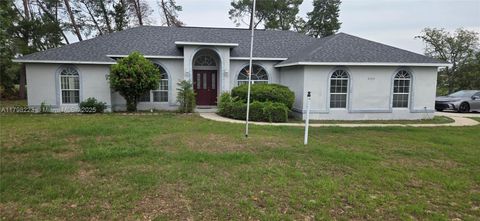
Active
$344,999
3
bds
|
2
ba
|
1,804
sqft
|
built
1990
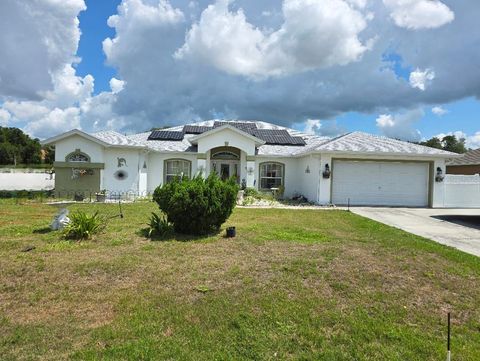
7552 SW 102nd Loop, Ocala, FL 34476
$-535
Cash flow
-8.1%
Cash-on-Cash Return
4.3%
Cap rate
0.6%
Rent to Value Ratio
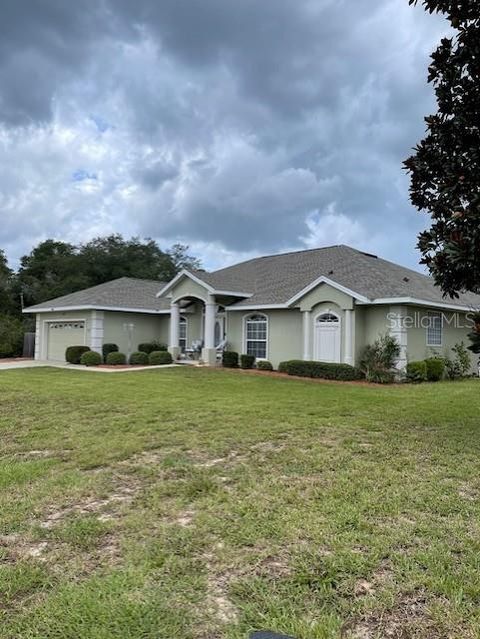
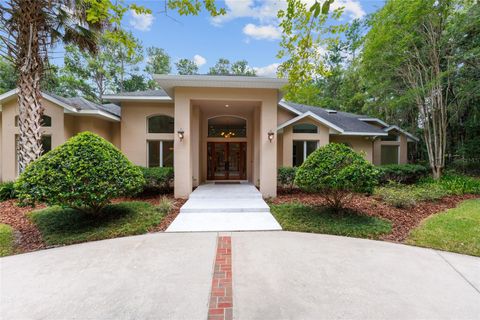
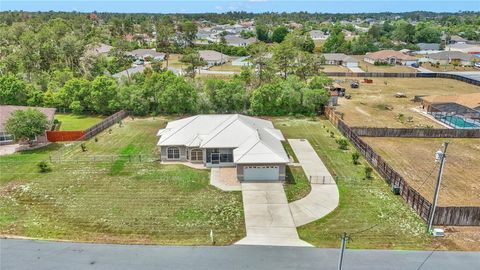
Active
$499,000
4
bds
|
3
ba
|
2,530
sqft
|
built
2004
4493 SW 102nd Lane Rd, Ocala, FL 34476
$-992
Cash flow
-10.4%
Cash-on-Cash Return
3.8%
Cap rate
0.5%
Rent to Value Ratio
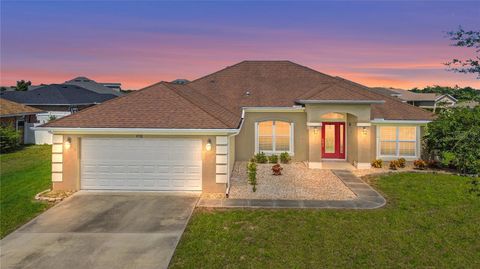
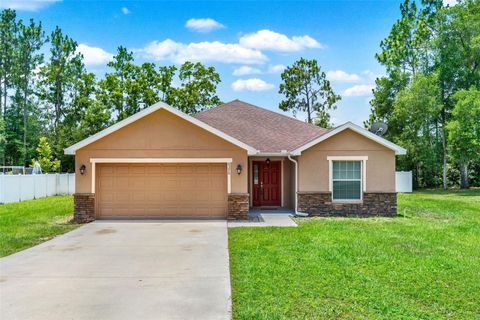
Active
$364,900
3
bds
|
3
ba
|
2,473
sqft
|
built
2001
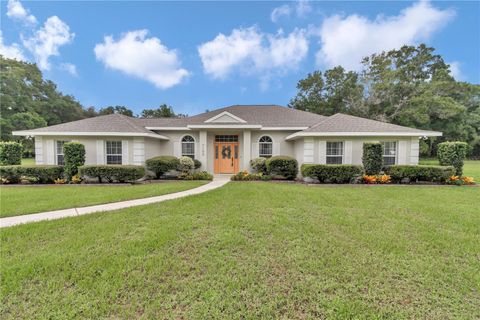
10929 SW 39th Ct, Ocala, FL 34476
$-335
Cash flow
-4.8%
Cash-on-Cash Return
5.0%
Cap rate
0.7%
Rent to Value Ratio
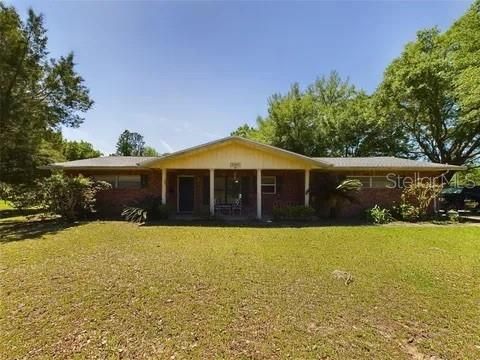
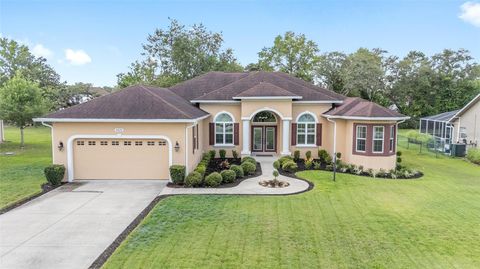
Active
$3,000,000
4
bds
|
6
ba
|
3,859
sqft
|
built
1996
6709 SW 17th Terrace Rd, Ocala, FL 34476
$-13,071
Cash flow
-22.7%
Cash-on-Cash Return
0.9%
Cap rate
0.1%
Rent to Value Ratio
Active
$407,000
4
bds
|
3
ba
|
2,303
sqft
|
built
2016
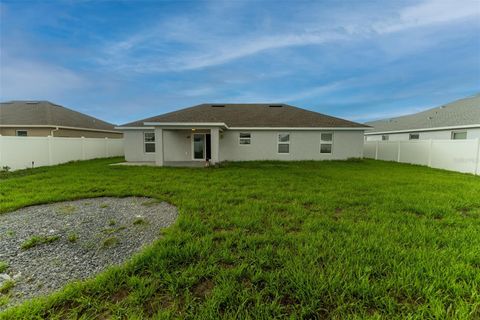
9798 SW 56th Cir, Ocala, FL 34476
$-973
Cash flow
-12.5%
Cash-on-Cash Return
3.3%
Cap rate
0.6%
Rent to Value Ratio
Active
$390,000
3
bds
|
2
ba
|
1,634
sqft
|
built
1973
7440 SW 83rd Pl, Ocala, FL 34476
$-596
Cash flow
-8.0%
Cash-on-Cash Return
4.3%
Cap rate
0.6%
Rent to Value Ratio
Active
$475,000
4
bds
|
3
ba
|
2,436
sqft
|
built
2005
4671 SW 100th Ln, Ocala, FL 34476
$-1,059
Cash flow
-11.6%
Cash-on-Cash Return
3.5%
Cap rate
0.5%
Rent to Value Ratio
Active
$694,900
4
bds
|
3
ba
|
2,185
sqft
|
built
1991
7150 SW 99th St, Ocala, FL 34476
$-1,931
Cash flow
-14.5%
Cash-on-Cash Return
2.8%
Cap rate
0.4%
Rent to Value Ratio
Active
$348,500
4
bds
|
2
ba
|
1,873
sqft
|
built
2023
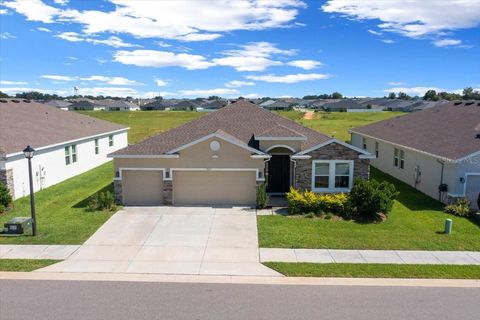
5050 SW 91st St, Ocala, FL 34476
$-694
Cash flow
-10.4%
Cash-on-Cash Return
3.8%
Cap rate
0.6%
Rent to Value Ratio
Active
$410,000
4
bds
|
3
ba
|
2,344
sqft
|
built
2021
5833 SW 85th Pl, Ocala, FL 34476
$-766
Cash flow
-9.7%
Cash-on-Cash Return
3.9%
Cap rate
0.6%
Rent to Value Ratio
Active
$385,000
4
bds
|
2
ba
|
1,827
sqft
|
built
2021
8640 SW 49th Cir, Ocala, FL 34476
$-983
Cash flow
-13.3%
Cash-on-Cash Return
3.1%
Cap rate
0.5%
Rent to Value Ratio
Active
$539,000
3
bds
|
3
ba
|
2,652
sqft
|
built
2017
5024 SW 114th Street Rd, Ocala, FL 34476
$-1,356
Cash flow
-13.1%
Cash-on-Cash Return
3.1%
Cap rate
0.5%
Rent to Value Ratio
Active
$475,550
5
bds
|
3
ba
|
2,534
sqft
|
built
2018
11412 SW 51st Cir, Ocala, FL 34476
$-974
Cash flow
-10.7%
Cash-on-Cash Return
3.7%
Cap rate
0.5%
Rent to Value Ratio
Active
$310,000
3
bds
|
2
ba
|
1,998
sqft
|
built
2017
6376 SW 117th Street Rd, Ocala, FL 34476
$-660
Cash flow
-11.1%
Cash-on-Cash Return
3.6%
Cap rate
0.6%
Rent to Value Ratio
Active
$2,100,000
4
bds
|
3
ba
|
4,279
sqft
|
built
1970
555 SW 87th Pl, Ocala, FL 34476
$-9,039
Cash flow
-22.5%
Cash-on-Cash Return
1.0%
Cap rate
0.2%
Rent to Value Ratio
Active
$434,900
4
bds
|
3
ba
|
2,784
sqft
|
built
2020
4770 SW 114th St, Ocala, FL 34476
$-827
Cash flow
-9.9%
Cash-on-Cash Return
3.9%
Cap rate
0.7%
Rent to Value Ratio
Active
$300,000
3
bds
|
2
ba
|
0
sqft
|
built
1999
4725 SW 103rd Pl, Ocala, FL 34476
$-32,008
Cash flow
-556.7%
Cash-on-Cash Return
-121.9%
Cap rate
0.7%
Rent to Value Ratio
Active
$425,000
4
bds
|
2
ba
|
2,174
sqft
|
built
2002
10372 SW 41st Ct, Ocala, FL 34476
$-759
Cash flow
-9.3%
Cash-on-Cash Return
4.0%
Cap rate
0.5%
Rent to Value Ratio
Active
$264,900
3
bds
|
2
ba
|
1,661
sqft
|
built
1995
5327 SW 89th St, Ocala, FL 34476
$-298
Cash flow
-5.9%
Cash-on-Cash Return
4.8%
Cap rate
0.8%
Rent to Value Ratio
Active
$375,000
4
bds
|
3
ba
|
2,134
sqft
|
built
1994
10337 SW 74th Ter, Ocala, FL 34476
$-597
Cash flow
-8.3%
Cash-on-Cash Return
4.2%
Cap rate
0.6%
Rent to Value Ratio
Active
$427,990
3
bds
|
2
ba
|
2,135
sqft
|
built
2003
4910 SW 109th Loop, Ocala, FL 34476
$-911
Cash flow
-11.1%
Cash-on-Cash Return
3.6%
Cap rate
0.5%
Rent to Value Ratio
Active
$376,000
4
bds
|
2
ba
|
2,120
sqft
|
built
2020
5220 SW 114th Street Rd, Ocala, FL 34476
$-749
Cash flow
-10.4%
Cash-on-Cash Return
3.8%
Cap rate
0.6%
Rent to Value Ratio
Active
$350,000
4
bds
|
2
ba
|
2,507
sqft
|
built
2008
9689 SW 53rd Ter, Ocala, FL 34476
$-570
Cash flow
-8.5%
Cash-on-Cash Return
4.2%
Cap rate
0.7%
Rent to Value Ratio
Active
$335,000
4
bds
|
2
ba
|
1,827
sqft
|
built
2023
4961 SW 88th Pl, Ocala, FL 34476
$-791
Cash flow
-12.3%
Cash-on-Cash Return
3.3%
Cap rate
0.6%
Rent to Value Ratio
Active
$359,000
4
bds
|
2
ba
|
0
sqft
|
built
2023
8864 SW 49th Cir, Ocala, FL 34476
$-914
Cash flow
-13.3%
Cash-on-Cash Return
3.1%
Cap rate
0.6%
Rent to Value Ratio
Active
$2,650,000
5
bds
|
8
ba
|
6,575
sqft
|
built
2009
10621 SW 11th Ter, Ocala, FL 34476
$-10,908
Cash flow
-21.5%
Cash-on-Cash Return
1.2%
Cap rate
0.2%
Rent to Value Ratio
Active
$629,900
3
bds
|
2
ba
|
2,921
sqft
|
built
2002
10411 SW 52nd Ct, Ocala, FL 34476
$-998
Cash flow
-8.3%
Cash-on-Cash Return
4.2%
Cap rate
0.6%
Rent to Value Ratio