34482 Investment Properties for Sale
Browse homes for sale and investment properties in 34482. Refine your search by price, property type, or more.
Best cash flowing properties in 34482
Active
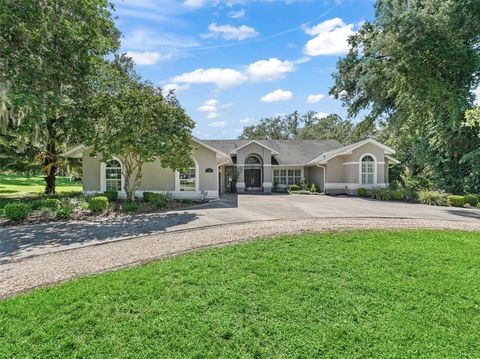
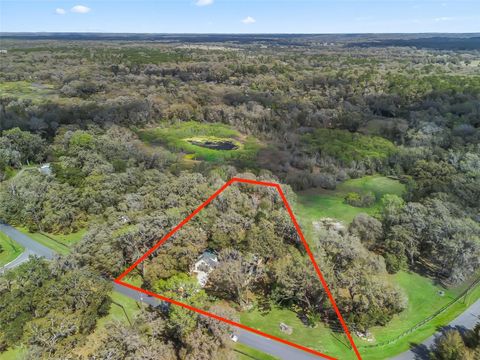
$777,777
3
bds
|
3
ba
|
2,553
sqft
|
built
1993
5714 NW 80th Avenue Rd, Ocala, FL 34482
$374
Cash flow
2.5%
Cash-on-Cash Return
6.7%
Cap rate
0.9%
Rent to Value Ratio
Active
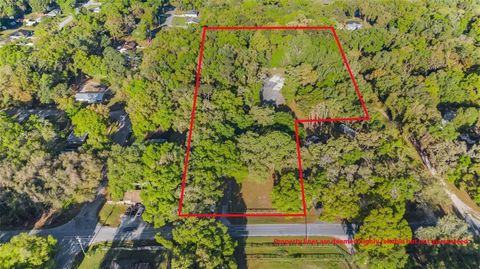
$375,000
1
bds
|
1
ba
|
0
sqft
|
built
1987
6700 NW 57th Ave, Ocala, FL 34482
$126
Cash flow
1.8%
Cash-on-Cash Return
6.6%
Cap rate
1.0%
Rent to Value Ratio
30 out of 49 properties for sale in 34482
Limited Results Shown
Create a free account, or log in to reveal all property listings and enjoy the complete experience.
Active
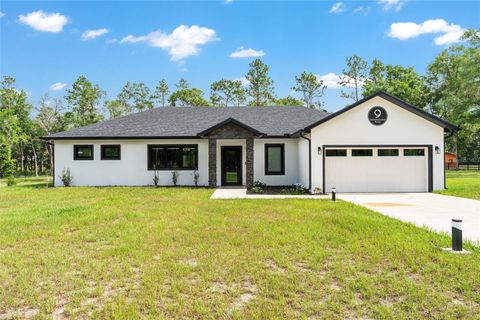
$950,000
4
bds
|
2
ba
|
1,880
sqft
|
built
2023
9 Middleground Rd, Ocala, FL 34482
$-3,507
Cash flow
-19.3%
Cash-on-Cash Return
1.7%
Cap rate
0.3%
Rent to Value Ratio
Active
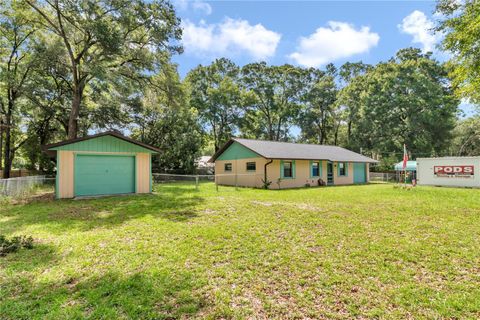
$245,000
3
bds
|
2
ba
|
1,143
sqft
|
built
1984
6415 NW 61st Ave, Ocala, FL 34482
$-434
Cash flow
-9.2%
Cash-on-Cash Return
4.0%
Cap rate
0.6%
Rent to Value Ratio
Active
$247,000
2
bds
|
2
ba
|
1,195
sqft
|
built
1983
6848 NW 60th St, Ocala, FL 34482
$-81
Cash flow
-1.7%
Cash-on-Cash Return
5.8%
Cap rate
0.7%
Rent to Value Ratio
Active
$269,900
3
bds
|
2
ba
|
1,238
sqft
|
built
2021
6298 NW 61st Ave, Ocala, FL 34482
$-368
Cash flow
-7.1%
Cash-on-Cash Return
4.5%
Cap rate
0.7%
Rent to Value Ratio
Active
$329,900
3
bds
|
2
ba
|
1,746
sqft
|
built
2001
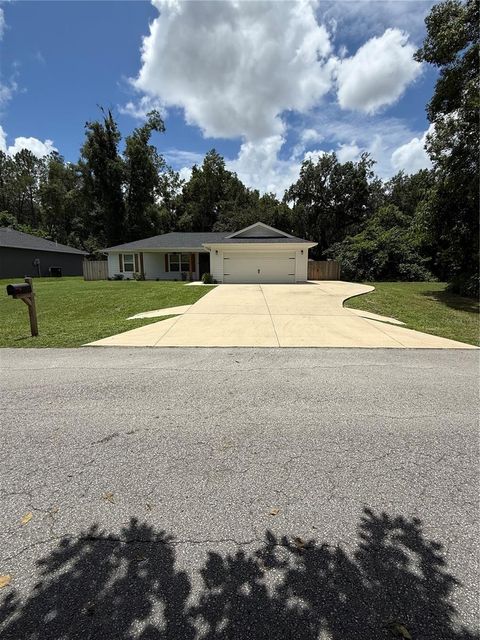
3333 NW 47th Ct, Ocala, FL 34482
$-546
Cash flow
-8.6%
Cash-on-Cash Return
4.2%
Cap rate
0.7%
Rent to Value Ratio
Active
$295,000
3
bds
|
2
ba
|
1,350
sqft
|
built
2021
4931 NW 62nd Ave, Ocala, FL 34482
$-553
Cash flow
-9.8%
Cash-on-Cash Return
3.9%
Cap rate
0.6%
Rent to Value Ratio
Active
$349,900
3
bds
|
2
ba
|
1,406
sqft
|
built
2022
4492 NW 45th St, Ocala, FL 34482
$-676
Cash flow
-10.1%
Cash-on-Cash Return
3.8%
Cap rate
0.6%
Rent to Value Ratio
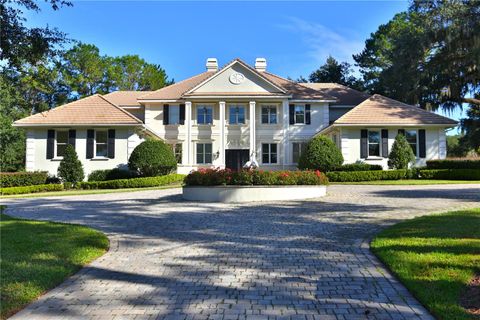
Active
$1,399,000
3
bds
|
3
ba
|
2,552
sqft
|
built
2003
1960 NW 73rd Ter, Ocala, FL 34482
$-5,173
Cash flow
-19.3%
Cash-on-Cash Return
1.7%
Cap rate
0.3%
Rent to Value Ratio
Active
$3,875,000
5
bds
|
6
ba
|
5,912
sqft
|
built
2007
4026 NW 85th Ter, Ocala, FL 34482
$-17,186
Cash flow
-23.1%
Cash-on-Cash Return
0.8%
Cap rate
0.2%
Rent to Value Ratio
Active
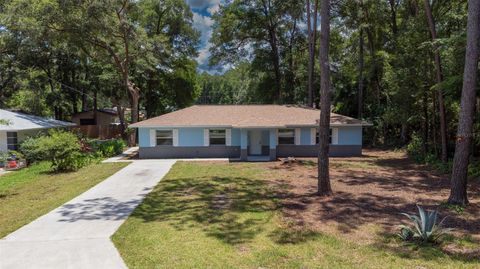
$239,900
3
bds
|
2
ba
|
1,456
sqft
|
built
1998
6475 NW 61st Ave, Ocala, FL 34482
$-270
Cash flow
-5.9%
Cash-on-Cash Return
4.8%
Cap rate
0.7%
Rent to Value Ratio
Active
$2,499,000
3
bds
|
2
ba
|
2,032
sqft
|
built
1975
7563 NW 21st St, Ocala, FL 34482
$-10,976
Cash flow
-22.9%
Cash-on-Cash Return
0.9%
Cap rate
0.1%
Rent to Value Ratio
Active
$240,000
2
bds
|
2
ba
|
1,315
sqft
|
built
2019
5255 NW 33rd Pl, Ocala, FL 34482
$-742
Cash flow
-16.1%
Cash-on-Cash Return
2.4%
Cap rate
0.8%
Rent to Value Ratio
Active
$275,000
2
bds
|
2
ba
|
1,454
sqft
|
built
2017
5610 NW 37th Lane Rd, Ocala, FL 34482
$-617
Cash flow
-11.7%
Cash-on-Cash Return
3.5%
Cap rate
0.8%
Rent to Value Ratio
Active
$650,000
3
bds
|
3
ba
|
2,694
sqft
|
built
2020
5430 NW 35th Lane Rd, Ocala, FL 34482
$-2,083
Cash flow
-16.7%
Cash-on-Cash Return
2.3%
Cap rate
0.5%
Rent to Value Ratio
Active
$679,000
3
bds
|
3
ba
|
2,711
sqft
|
built
1987
4530 NW 78th Ave, Ocala, FL 34482
$-1,570
Cash flow
-12.1%
Cash-on-Cash Return
3.4%
Cap rate
0.5%
Rent to Value Ratio
Active
$359,000
3
bds
|
2
ba
|
1,298
sqft
|
built
1980
3 Lakeside Dr, Ocala, FL 34482
$-767
Cash flow
-11.1%
Cash-on-Cash Return
3.6%
Cap rate
0.6%
Rent to Value Ratio
Active
$289,900
2
bds
|
2
ba
|
1,454
sqft
|
built
2018
3935 NW 46th Ter, Ocala, FL 34482
$-556
Cash flow
-10.0%
Cash-on-Cash Return
3.8%
Cap rate
0.9%
Rent to Value Ratio
Active
$599,000
4
bds
|
2
ba
|
1,880
sqft
|
built
2023
36 Lake Wood Cir, Ocala, FL 34482
$-1,718
Cash flow
-15.0%
Cash-on-Cash Return
2.7%
Cap rate
0.5%
Rent to Value Ratio
Active
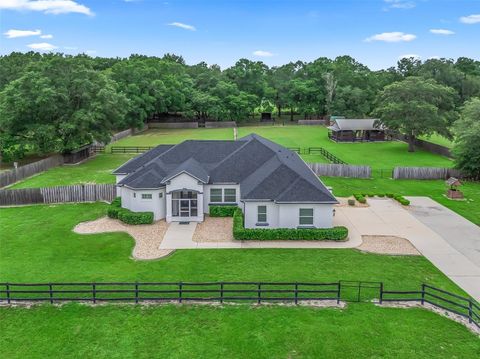
$697,000
4
bds
|
4
ba
|
2,768
sqft
|
built
2004
1 Lake Wood Cir, Ocala, FL 34482
$-2,189
Cash flow
-16.4%
Cash-on-Cash Return
2.4%
Cap rate
0.3%
Rent to Value Ratio
Active
$669,000
3
bds
|
2
ba
|
2,144
sqft
|
built
1978
7699 NW 56th Pl, Ocala, FL 34482
$-1,692
Cash flow
-13.2%
Cash-on-Cash Return
3.1%
Cap rate
0.4%
Rent to Value Ratio
Active
$599,000
3
bds
|
2
ba
|
3,178
sqft
|
built
1980
5391 NW 76th Ct, Ocala, FL 34482
$-845
Cash flow
-7.4%
Cash-on-Cash Return
4.5%
Cap rate
0.7%
Rent to Value Ratio
Active
$1,965,000
2
bds
|
3
ba
|
2,201
sqft
|
built
2022
8033 NW 28th St, Ocala, FL 34482
$-9,610
Cash flow
-25.5%
Cash-on-Cash Return
0.3%
Cap rate
0.2%
Rent to Value Ratio
Active
$549,900
3
bds
|
3
ba
|
0
sqft
|
built
1987
1370 NW 120th Ave, Ocala, FL 34482
$-1,008
Cash flow
-9.6%
Cash-on-Cash Return
3.9%
Cap rate
0.5%
Rent to Value Ratio
Active
$1,650,000
3
bds
|
3
ba
|
2,027
sqft
|
built
2015
8135 NW 26th Lane Rd, Ocala, FL 34482
$-6,544
Cash flow
-20.7%
Cash-on-Cash Return
1.4%
Cap rate
0.3%
Rent to Value Ratio
Active
$2,250,000
4
bds
|
4
ba
|
3,037
sqft
|
built
2022
7549 NW 33rd Pl, Ocala, FL 34482
$-9,207
Cash flow
-21.3%
Cash-on-Cash Return
1.2%
Cap rate
0.3%
Rent to Value Ratio
Active
$265,000
2
bds
|
2
ba
|
1,454
sqft
|
built
2019
3947 NW 46th Ter, Ocala, FL 34482
$-651
Cash flow
-12.8%
Cash-on-Cash Return
3.2%
Cap rate
0.9%
Rent to Value Ratio

Active
$340,000
2
bds
|
2
ba
|
1,666
sqft
|
built
2016
4747 NW 35th Lane Rd, Ocala, FL 34482
$-839
Cash flow
-12.9%
Cash-on-Cash Return
3.2%
Cap rate
0.8%
Rent to Value Ratio
Active
$1,199,900
5
bds
|
6
ba
|
8,314
sqft
|
built
1983
10303 NW 76th Ter, Ocala, FL 34482
$-4,688
Cash flow
-20.4%
Cash-on-Cash Return
1.5%
Cap rate
0.4%
Rent to Value Ratio