34655 Investment Properties for Sale
Browse homes for sale and investment properties in 34655. Refine your search by price, property type, or more.
Best cash flowing properties in 34655
Active
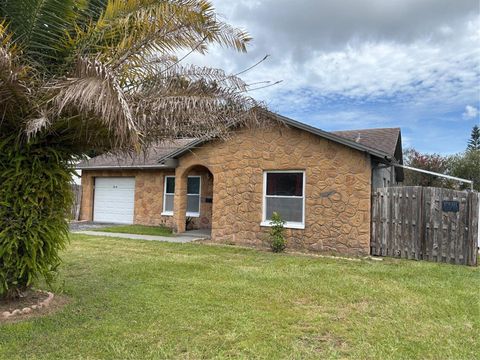
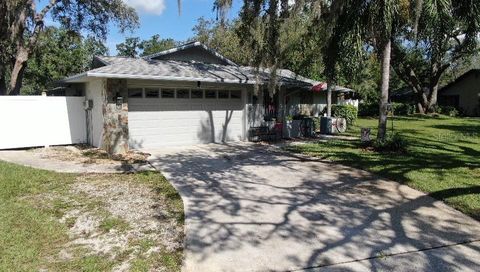
$210,000
2
bds
|
2
ba
|
969
sqft
|
built
1976
7313 Daggett Ter, New Port Richey, FL 34655
$-45
Cash flow
-1.1%
Cash-on-Cash Return
5.9%
Cap rate
0.9%
Rent to Value Ratio
Active
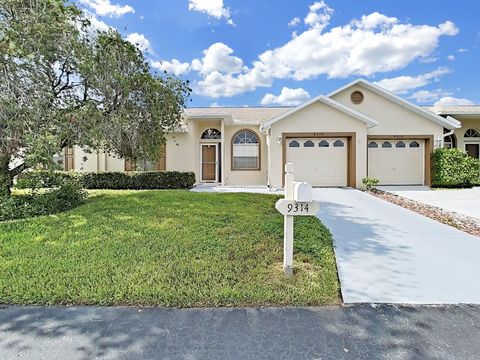
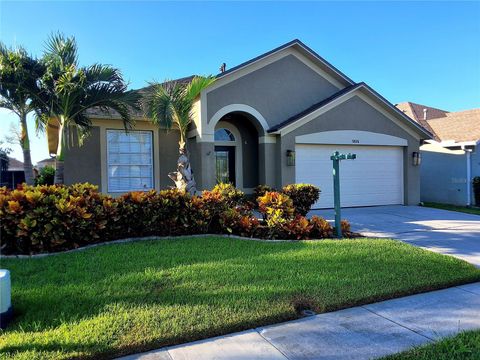
$199,900
2
bds
|
2
ba
|
1,161
sqft
|
built
2000
9314 Alta Sol Way, New Port Richey, FL 34655
$-77
Cash flow
-2.0%
Cash-on-Cash Return
5.7%
Cap rate
1.0%
Rent to Value Ratio
149 out of 180 properties for sale in 34655
Limited Results Shown
Create a free account, or log in to reveal all property listings and enjoy the complete experience.

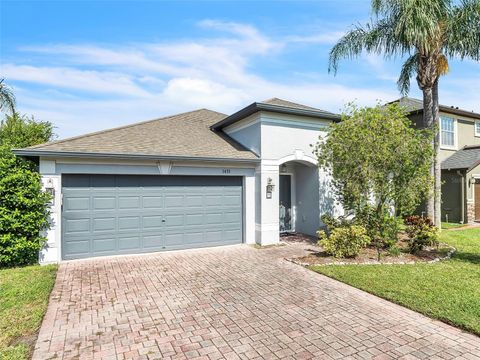
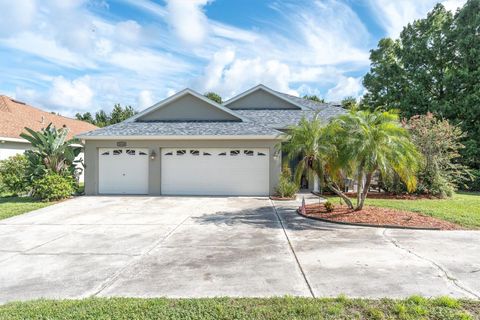
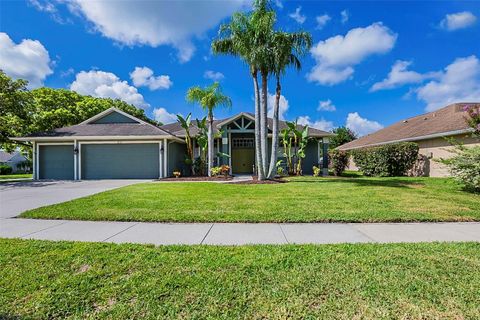
Active
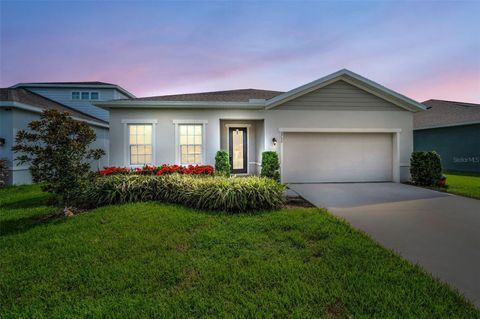
$350,000
3
bds
|
2
ba
|
1,804
sqft
|
built
1987
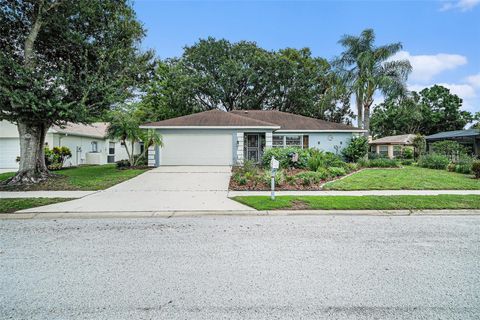
5506 Redhawk Dr, New Port Richey, FL 34655
$-445
Cash flow
-6.6%
Cash-on-Cash Return
4.6%
Cap rate
0.7%
Rent to Value Ratio
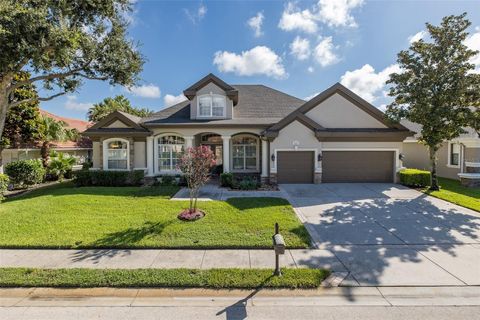
Active
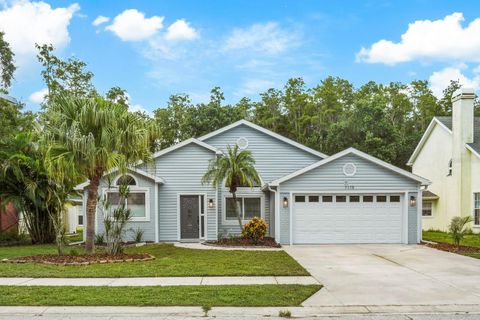
$425,000
3
bds
|
2
ba
|
2,055
sqft
|
built
2006
1433 Impatiens Ct, Trinity, FL 34655
$-478
Cash flow
-5.9%
Cash-on-Cash Return
4.8%
Cap rate
0.7%
Rent to Value Ratio
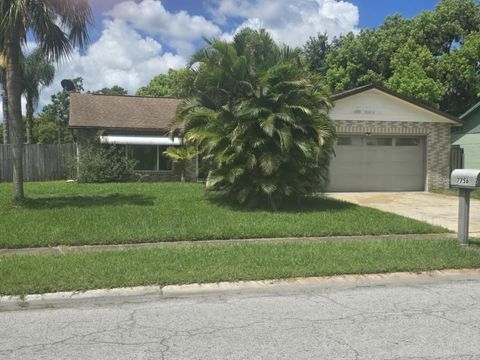
Active
$259,000
2
bds
|
2
ba
|
1,075
sqft
|
built
1980
7756 Ivory Ter, New Port Richey, FL 34655
$-403
Cash flow
-8.1%
Cash-on-Cash Return
4.3%
Cap rate
0.7%
Rent to Value Ratio
Active
$490,000
3
bds
|
2
ba
|
1,889
sqft
|
built
2004
2114 Larkspur Ct, Trinity, FL 34655
$-816
Cash flow
-8.7%
Cash-on-Cash Return
4.1%
Cap rate
0.6%
Rent to Value Ratio
Active
$1,095,000
5
bds
|
4
ba
|
4,195
sqft
|
built
2005
1444 El Pardo Dr, Trinity, FL 34655
$-3,295
Cash flow
-15.7%
Cash-on-Cash Return
2.5%
Cap rate
0.4%
Rent to Value Ratio

Active
$290,000
3
bds
|
2
ba
|
1,872
sqft
|
built
1978
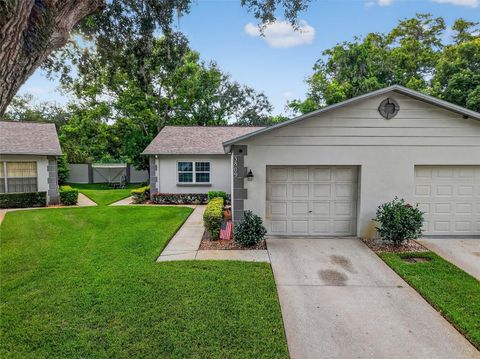
3655 Dellefield St, New Port Richey, FL 34655
$-548
Cash flow
-9.9%
Cash-on-Cash Return
3.9%
Cap rate
0.7%
Rent to Value Ratio
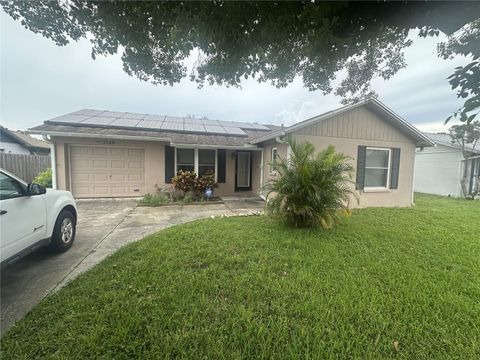
Active
$239,000
3
bds
|
2
ba
|
1,283
sqft
|
built
1978
3148 Ludlow Dr, New Port Richey, FL 34655
$-94
Cash flow
-2.1%
Cash-on-Cash Return
5.7%
Cap rate
0.8%
Rent to Value Ratio

Active
$399,900
3
bds
|
2
ba
|
1,652
sqft
|
built
1985
3716 Player Dr, New Port Richey, FL 34655
$-575
Cash flow
-7.5%
Cash-on-Cash Return
4.4%
Cap rate
0.6%
Rent to Value Ratio
Active
$290,000
2
bds
|
2
ba
|
1,291
sqft
|
built
1979
3744 Mendocino St, New Port Richey, FL 34655
$-118
Cash flow
-2.1%
Cash-on-Cash Return
5.7%
Cap rate
0.8%
Rent to Value Ratio

Active
$215,000
3
bds
|
2
ba
|
1,333
sqft
|
built
1985
8825 Manos Cir, New Port Richey, FL 34655
$-344
Cash flow
-8.3%
Cash-on-Cash Return
4.2%
Cap rate
0.8%
Rent to Value Ratio

Active
$239,900
2
bds
|
2
ba
|
1,292
sqft
|
built
1990
3204 Lori Ln, New Port Richey, FL 34655
$-311
Cash flow
-6.8%
Cash-on-Cash Return
4.6%
Cap rate
0.9%
Rent to Value Ratio

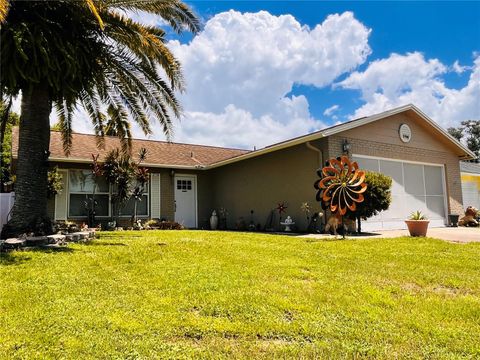
Active
$299,900
2
bds
|
2
ba
|
1,291
sqft
|
built
1981
7926 Griswold Loop, New Port Richey, FL 34655
$-81
Cash flow
-1.4%
Cash-on-Cash Return
5.8%
Cap rate
0.7%
Rent to Value Ratio
Active
$439,900
2
bds
|
2
ba
|
1,564
sqft
|
built
1979
2309 Woodbend Cir, New Port Richey, FL 34655
$-909
Cash flow
-10.8%
Cash-on-Cash Return
3.7%
Cap rate
0.5%
Rent to Value Ratio
Active
$419,000
3
bds
|
2
ba
|
1,610
sqft
|
built
2001
10516 Peppergrass Ct, Trinity, FL 34655
$-1,027
Cash flow
-12.8%
Cash-on-Cash Return
3.2%
Cap rate
0.6%
Rent to Value Ratio
Active
$499,000
3
bds
|
2
ba
|
2,017
sqft
|
built
2020
8755 Prairie Creek Dr, New Port Richey, FL 34655
$-632
Cash flow
-6.6%
Cash-on-Cash Return
4.6%
Cap rate
0.6%
Rent to Value Ratio
Active
$460,000
4
bds
|
2
ba
|
1,849
sqft
|
built
1988
7119 Hummingbird Ln, New Port Richey, FL 34655
$-1,171
Cash flow
-13.3%
Cash-on-Cash Return
3.1%
Cap rate
0.5%
Rent to Value Ratio
Active
$325,000
2
bds
|
2
ba
|
1,296
sqft
|
built
1981
3302 Rankin Dr, New Port Richey, FL 34655
$-388
Cash flow
-6.2%
Cash-on-Cash Return
4.7%
Cap rate
0.7%
Rent to Value Ratio
Active
$225,000
2
bds
|
2
ba
|
1,040
sqft
|
built
1985
3809 River Oaks Ct, New Port Richey, FL 34655
$-95
Cash flow
-2.2%
Cash-on-Cash Return
5.6%
Cap rate
0.8%
Rent to Value Ratio
Active
$399,999
3
bds
|
2
ba
|
1,646
sqft
|
built
1996
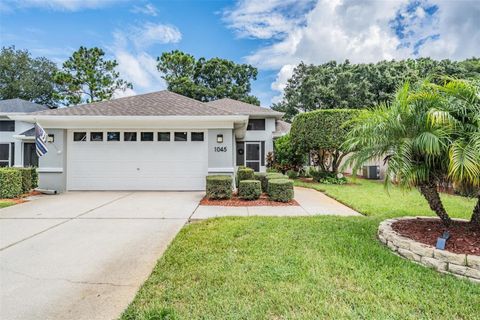
1045 Trafalgar Dr, New Port Richey, FL 34655
$-891
Cash flow
-11.6%
Cash-on-Cash Return
3.5%
Cap rate
0.6%
Rent to Value Ratio

Active
$349,990
2
bds
|
2
ba
|
1,446
sqft
|
built
1985
3711 Erin Brook Dr, New Port Richey, FL 34655
$-564
Cash flow
-8.4%
Cash-on-Cash Return
4.2%
Cap rate
0.6%
Rent to Value Ratio
Active
$599,999
3
bds
|
3
ba
|
2,174
sqft
|
built
2016
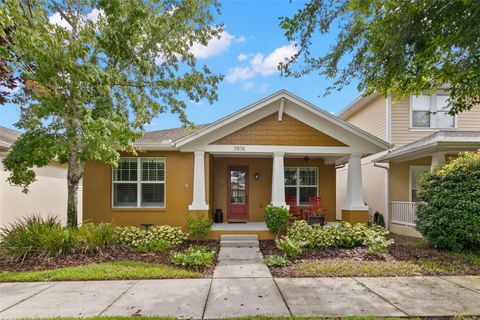
3506 Albritton St, New Port Richey, FL 34655
$-1,444
Cash flow
-12.6%
Cash-on-Cash Return
3.3%
Cap rate
0.5%
Rent to Value Ratio
Active
$449,000
4
bds
|
2
ba
|
2,193
sqft
|
built
1999
1747 Orchardgrove Ave, New Port Richey, FL 34655
$-877
Cash flow
-10.2%
Cash-on-Cash Return
3.8%
Cap rate
0.7%
Rent to Value Ratio
Active
$659,000
5
bds
|
3
ba
|
2,638
sqft
|
built
2005
2048 Tarragon Ln, New Port Richey, FL 34655
$-1,504
Cash flow
-11.9%
Cash-on-Cash Return
3.4%
Cap rate
0.5%
Rent to Value Ratio
Active
$679,000
4
bds
|
3
ba
|
3,334
sqft
|
built
2006
10126 Balcony St, New Port Richey, FL 34655
$-1,458
Cash flow
-11.2%
Cash-on-Cash Return
3.6%
Cap rate
0.5%
Rent to Value Ratio
Active
$569,900
4
bds
|
4
ba
|
2,503
sqft
|
built
2012
1224 Halapa Way, Trinity, FL 34655
$-992
Cash flow
-9.1%
Cash-on-Cash Return
4.1%
Cap rate
0.6%
Rent to Value Ratio
Active
$780,000
4
bds
|
4
ba
|
3,549
sqft
|
built
2001
2151 Edelweiss Loop, Trinity, FL 34655
$-1,433
Cash flow
-9.6%
Cash-on-Cash Return
3.9%
Cap rate
0.6%
Rent to Value Ratio

Active
$389,000
3
bds
|
2
ba
|
1,517
sqft
|
built
1989
7501 Turtlebrook Ln, New Port Richey, FL 34655
$-466
Cash flow
-6.3%
Cash-on-Cash Return
4.7%
Cap rate
0.6%
Rent to Value Ratio
Active
$799,999
4
bds
|
3
ba
|
2,822
sqft
|
built
2005
10620 Garda Dr, Trinity, FL 34655
$-1,837
Cash flow
-12.0%
Cash-on-Cash Return
3.4%
Cap rate
0.6%
Rent to Value Ratio

Active
$309,999
3
bds
|
2
ba
|
1,653
sqft
|
built
1979
7619 Humboldt Ave, New Port Richey, FL 34655
$-276
Cash flow
-4.6%
Cash-on-Cash Return
5.1%
Cap rate
0.7%
Rent to Value Ratio
Active
$529,999
3
bds
|
2
ba
|
2,017
sqft
|
built
2020
8847 Prairie Creek Dr, New Port Richey, FL 34655
$-1,162
Cash flow
-11.4%
Cash-on-Cash Return
3.5%
Cap rate
0.5%
Rent to Value Ratio

Active
$425,000
4
bds
|
3
ba
|
2,260
sqft
|
built
2021
7731 Cypress Walk Dr, New Port Richey, FL 34655
$-925
Cash flow
-11.4%
Cash-on-Cash Return
3.5%
Cap rate
0.6%
Rent to Value Ratio
Active
$925,000
4
bds
|
4
ba
|
3,828
sqft
|
built
2005
10644 Garda Dr, Trinity, FL 34655
$-2,926
Cash flow
-16.5%
Cash-on-Cash Return
2.4%
Cap rate
0.4%
Rent to Value Ratio

Active
$234,900
2
bds
|
2
ba
|
1,161
sqft
|
built
1997
4201 Prado Ln, New Port Richey, FL 34655
$-295
Cash flow
-6.6%
Cash-on-Cash Return
4.6%
Cap rate
0.9%
Rent to Value Ratio
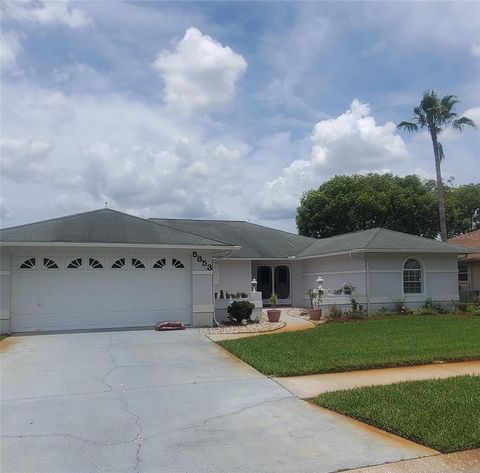
Active
$423,000
3
bds
|
2
ba
|
2,022
sqft
|
built
1988
5853 Redhawk Dr, New Port Richey, FL 34655
$-493
Cash flow
-6.1%
Cash-on-Cash Return
4.7%
Cap rate
0.7%
Rent to Value Ratio
Active
$515,000
4
bds
|
2
ba
|
2,147
sqft
|
built
1997
8112 Maidencane Dr, Trinity, FL 34655
$-1,098
Cash flow
-11.1%
Cash-on-Cash Return
3.6%
Cap rate
0.6%
Rent to Value Ratio

Active
$699,000
4
bds
|
3
ba
|
2,954
sqft
|
built
2022
8256 Capstone Ranch Dr, New Port Richey, FL 34655
$-2,457
Cash flow
-18.3%
Cash-on-Cash Return
1.9%
Cap rate
0.5%
Rent to Value Ratio

Active
$355,000
4
bds
|
3
ba
|
2,014
sqft
|
built
2003
2652 Tottenham Dr, New Port Richey, FL 34655
$-745
Cash flow
-10.9%
Cash-on-Cash Return
3.6%
Cap rate
0.7%
Rent to Value Ratio

Active
$389,900
3
bds
|
2
ba
|
1,674
sqft
|
built
1995
1049 Trafalgar Dr, New Port Richey, FL 34655
$-827
Cash flow
-11.1%
Cash-on-Cash Return
3.6%
Cap rate
0.6%
Rent to Value Ratio