34668 Investment Properties for Sale
Browse homes for sale and investment properties in 34668. Refine your search by price, property type, or more.
Best cash flowing properties in 34668
Active
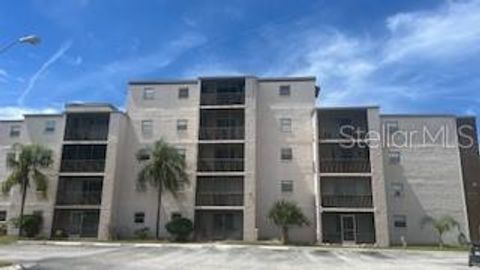
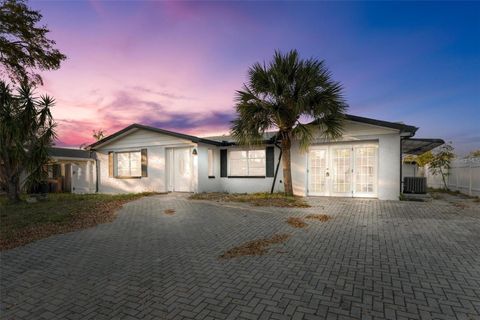
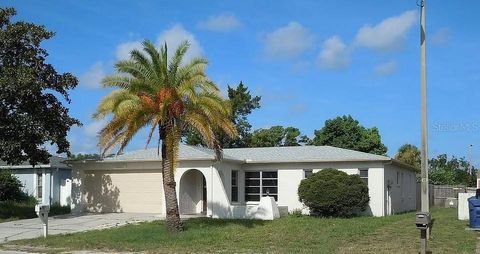
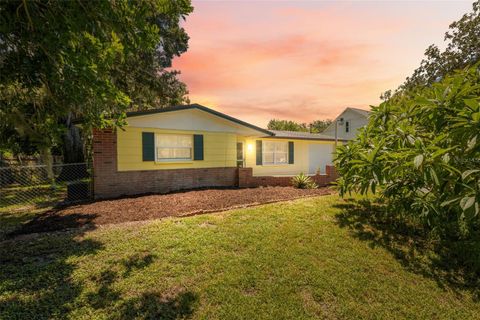
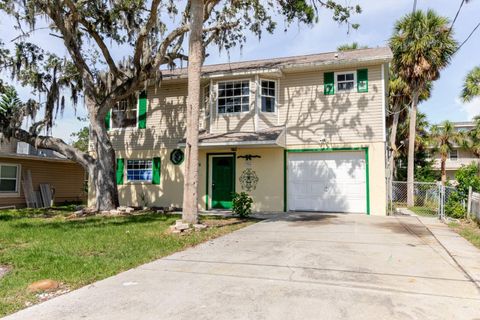
$89,000
1
bds
|
1
ba
|
806
sqft
|
built
1980
5541 Bay Blvd, Port Richey, FL 34668
$374
Cash flow
21.9%
Cash-on-Cash Return
11.2%
Cap rate
1.5%
Rent to Value Ratio
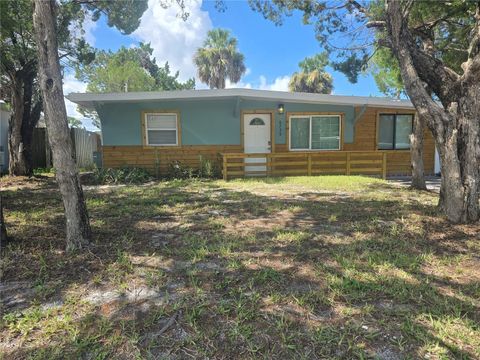
Active
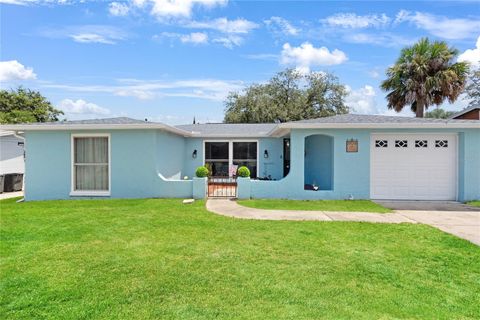
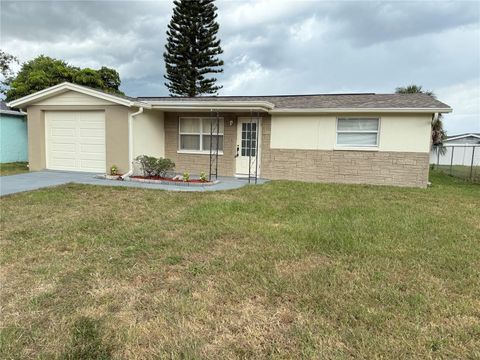
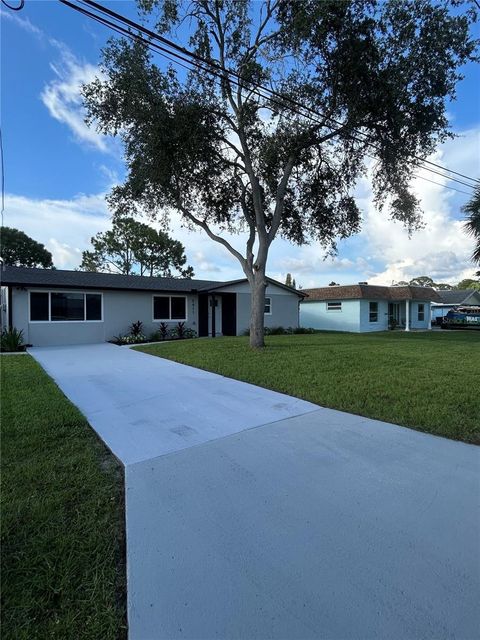
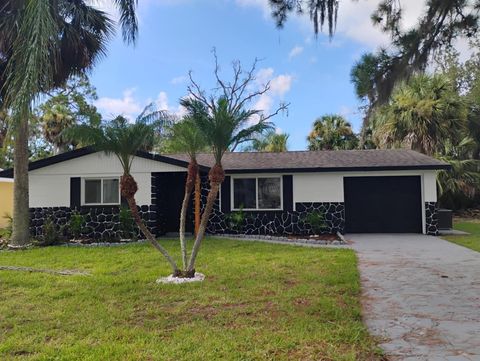
$209,900
3
bds
|
2
ba
|
928
sqft
|
built
1963
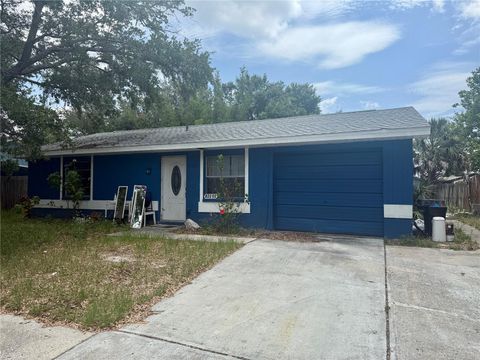
6730 Sandra Dr, Port Richey, FL 34668
$157
Cash flow
3.9%
Cash-on-Cash Return
7.0%
Cap rate
1.0%
Rent to Value Ratio
90 out of 99 properties for sale in 34668
Limited Results Shown
Create a free account, or log in to reveal all property listings and enjoy the complete experience.
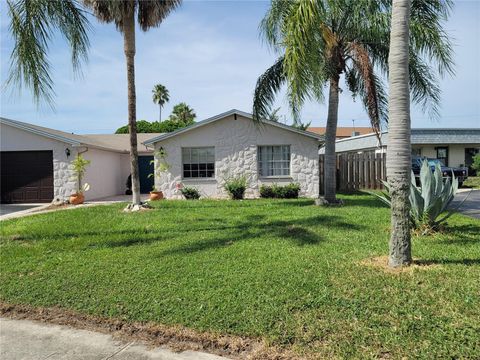
Active
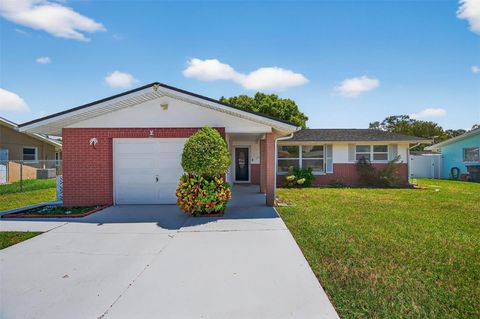
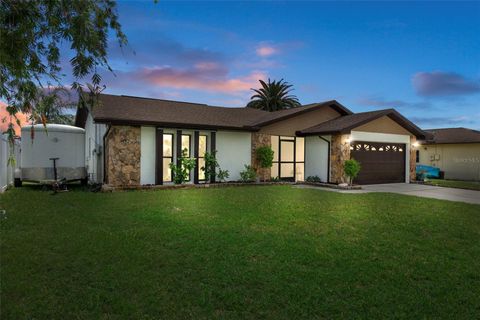
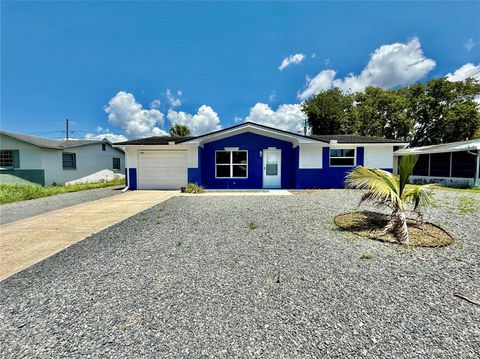
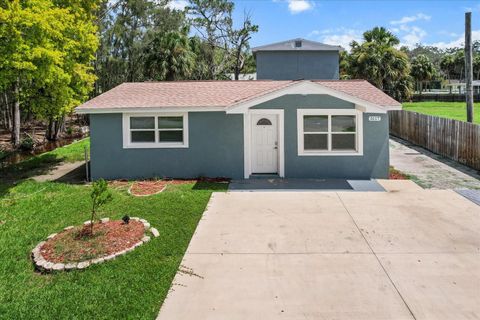
$289,000
3
bds
|
2
ba
|
1,562
sqft
|
built
1972
9826 Lehigh Dr, Port Richey, FL 34668
$-323
Cash flow
-5.8%
Cash-on-Cash Return
4.8%
Cap rate
0.6%
Rent to Value Ratio
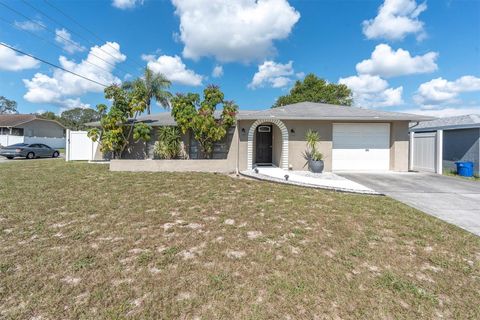
Active
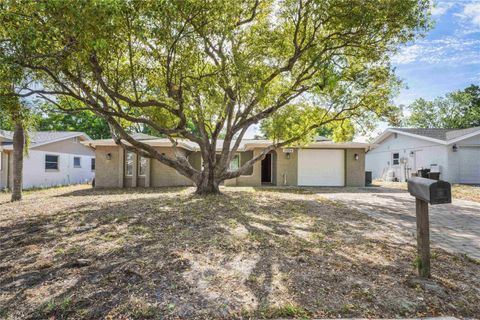
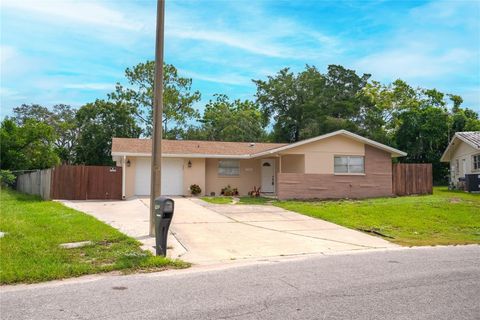
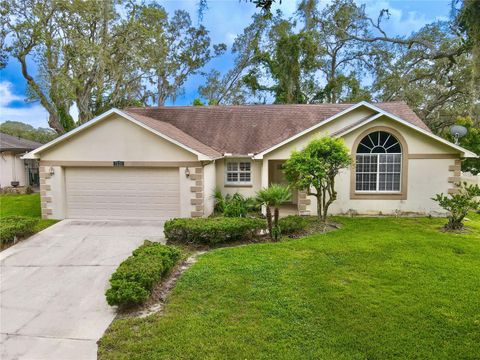
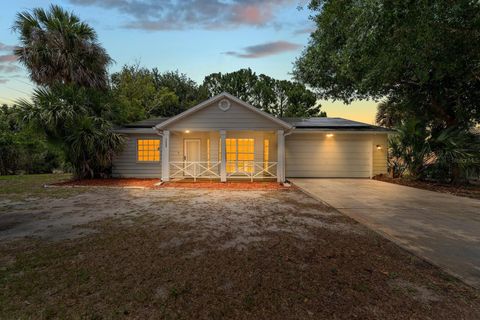
$299,000
2
bds
|
2
ba
|
1,254
sqft
|
built
1979
9005 Hermitage Ln, Port Richey, FL 34668
$-495
Cash flow
-8.6%
Cash-on-Cash Return
4.2%
Cap rate
0.6%
Rent to Value Ratio
Active
$279,000
3
bds
|
2
ba
|
1,467
sqft
|
built
1977
7311 San Moritz Dr, Port Richey, FL 34668
$-220
Cash flow
-4.1%
Cash-on-Cash Return
5.2%
Cap rate
0.8%
Rent to Value Ratio
Active
$325,000
3
bds
|
2
ba
|
1,442
sqft
|
built
1978
9720 Gray Fox Ln, Port Richey, FL 34668
$-618
Cash flow
-9.9%
Cash-on-Cash Return
3.9%
Cap rate
0.6%
Rent to Value Ratio
Active
$289,000
2
bds
|
2
ba
|
1,260
sqft
|
built
1977
10404 Loquat Dr, Port Richey, FL 34668
$-240
Cash flow
-4.3%
Cash-on-Cash Return
5.1%
Cap rate
0.8%
Rent to Value Ratio
Active
$285,000
3
bds
|
2
ba
|
1,454
sqft
|
built
1973
10824 Oldham Rd, Port Richey, FL 34668
$-169
Cash flow
-3.1%
Cash-on-Cash Return
5.4%
Cap rate
0.8%
Rent to Value Ratio
Active
$179,900
2
bds
|
1
ba
|
744
sqft
|
built
1984
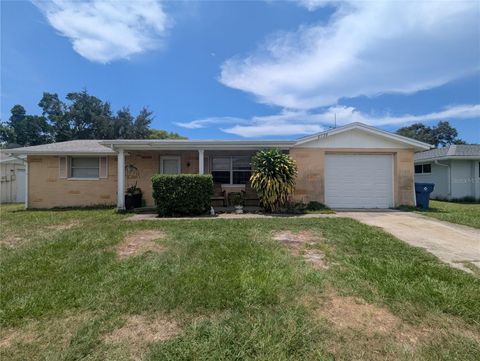
10320 County Lake Dr, Port Richey, FL 34668
$-36
Cash flow
-1.0%
Cash-on-Cash Return
5.9%
Cap rate
0.9%
Rent to Value Ratio
Active
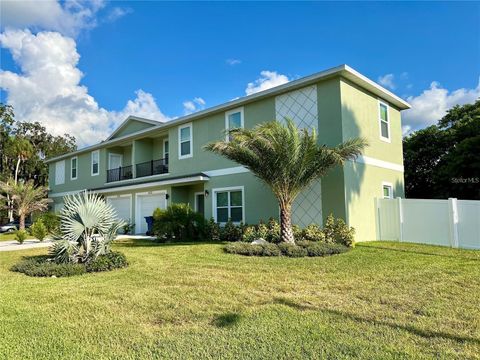
$669,000
4
bds
|
6
ba
|
3,104
sqft
|
built
2023
5630 Queener Ave, Port Richey, FL 34668
$-2,533
Cash flow
-19.8%
Cash-on-Cash Return
1.6%
Cap rate
0.4%
Rent to Value Ratio
Active
$240,000
2
bds
|
2
ba
|
1,184
sqft
|
built
1977
8739 Lido Ln, Port Richey, FL 34668
$-344
Cash flow
-7.5%
Cash-on-Cash Return
4.4%
Cap rate
0.7%
Rent to Value Ratio
Active
$1,150,000
5
bds
|
4
ba
|
3,761
sqft
|
built
1994
8100 Brighton Dr, Port Richey, FL 34668
$-4,149
Cash flow
-18.8%
Cash-on-Cash Return
1.8%
Cap rate
0.3%
Rent to Value Ratio
Active
$209,900
2
bds
|
2
ba
|
1,051
sqft
|
built
1973
6840 Mesa Verde St, Port Richey, FL 34668
$-128
Cash flow
-3.2%
Cash-on-Cash Return
5.4%
Cap rate
0.8%
Rent to Value Ratio
Active
$219,900
3
bds
|
2
ba
|
1,190
sqft
|
built
1974
7015 Oakshire Dr, Port Richey, FL 34668
$-11
Cash flow
-0.3%
Cash-on-Cash Return
6.1%
Cap rate
0.8%
Rent to Value Ratio
Active
$325,000
3
bds
|
2
ba
|
1,479
sqft
|
built
1975
9239 Palm Ave, Port Richey, FL 34668
$-530
Cash flow
-8.5%
Cash-on-Cash Return
4.2%
Cap rate
0.6%
Rent to Value Ratio
Active
$242,000
3
bds
|
1
ba
|
1,256
sqft
|
built
1967
11031 Martha Ave, Port Richey, FL 34668
$-71
Cash flow
-1.5%
Cash-on-Cash Return
5.8%
Cap rate
0.7%
Rent to Value Ratio
Active
$250,000
2
bds
|
2
ba
|
1,413
sqft
|
built
1982
9641 Morehead Ln, Port Richey, FL 34668
$-296
Cash flow
-6.2%
Cash-on-Cash Return
4.7%
Cap rate
0.7%
Rent to Value Ratio
Active
$199,500
2
bds
|
1
ba
|
846
sqft
|
built
1974
7311 Brentwood Dr, Port Richey, FL 34668
$-121
Cash flow
-3.2%
Cash-on-Cash Return
5.4%
Cap rate
0.8%
Rent to Value Ratio
Active
$425,000
2
bds
|
2
ba
|
1,500
sqft
|
built
1982
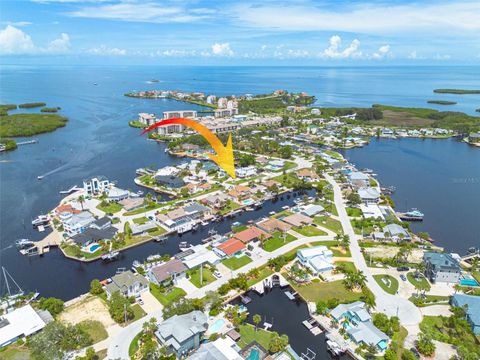
9910 Island Harbor Dr, Port Richey, FL 34668
$-1,139
Cash flow
-14.0%
Cash-on-Cash Return
2.9%
Cap rate
0.5%
Rent to Value Ratio
Active
$335,000
3
bds
|
2
ba
|
1,282
sqft
|
built
1970
7931 Bracken Dr, Port Richey, FL 34668
$-663
Cash flow
-10.3%
Cash-on-Cash Return
3.8%
Cap rate
0.5%
Rent to Value Ratio
Active
$305,000
3
bds
|
2
ba
|
1,423
sqft
|
built
1978
7102 Cherry Laurel Dr, Port Richey, FL 34668
$-473
Cash flow
-8.1%
Cash-on-Cash Return
4.3%
Cap rate
0.7%
Rent to Value Ratio
Active
$236,500
3
bds
|
2
ba
|
1,100
sqft
|
built
1971
10226 Willow Dr, Port Richey, FL 34668
$-308
Cash flow
-6.8%
Cash-on-Cash Return
4.6%
Cap rate
0.7%
Rent to Value Ratio
Active
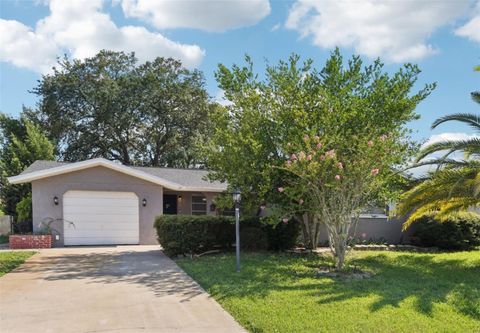
$359,000
3
bds
|
2
ba
|
1,720
sqft
|
built
1979
9125 Lunar Ln, Port Richey, FL 34668
$-473
Cash flow
-6.9%
Cash-on-Cash Return
4.6%
Cap rate
0.7%
Rent to Value Ratio
Active
$225,000
3
bds
|
1
ba
|
1,274
sqft
|
built
1973
7021 Mayfield Dr, Port Richey, FL 34668
$-227
Cash flow
-5.3%
Cash-on-Cash Return
4.9%
Cap rate
0.7%
Rent to Value Ratio
Active
$264,900
2
bds
|
2
ba
|
1,201
sqft
|
built
1972
7730 Chapel Ave, Port Richey, FL 34668
$-242
Cash flow
-4.8%
Cash-on-Cash Return
5.1%
Cap rate
0.6%
Rent to Value Ratio
Active
$427,000
3
bds
|
2
ba
|
1,516
sqft
|
built
1974
5411 Quist Dr, Port Richey, FL 34668
$-958
Cash flow
-11.7%
Cash-on-Cash Return
3.5%
Cap rate
0.5%
Rent to Value Ratio
Active
$210,000
2
bds
|
1
ba
|
807
sqft
|
built
1968
10824 Hillcrest Ave, Port Richey, FL 34668
$-175
Cash flow
-4.3%
Cash-on-Cash Return
5.1%
Cap rate
0.8%
Rent to Value Ratio
Active
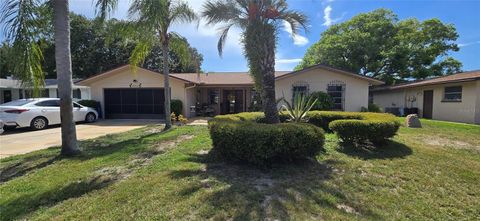
$300,000
3
bds
|
2
ba
|
1,845
sqft
|
built
1985
7624 Lake Forest Cir, Port Richey, FL 34668
$-497
Cash flow
-8.6%
Cash-on-Cash Return
4.2%
Cap rate
0.7%
Rent to Value Ratio
Active
$299,999
2
bds
|
3
ba
|
1,434
sqft
|
built
1976
10211 Oleander Dr, Port Richey, FL 34668
$-7
Cash flow
-0.1%
Cash-on-Cash Return
6.1%
Cap rate
0.8%
Rent to Value Ratio
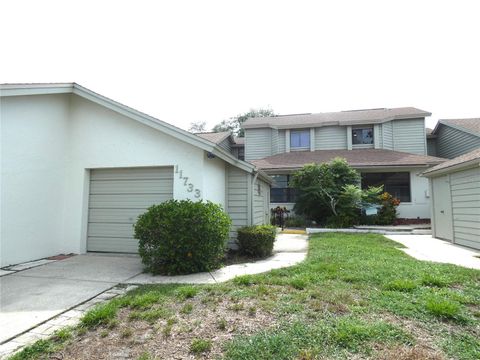
Active
$209,900
2
bds
|
2
ba
|
1,720
sqft
|
built
1985
11733 Rolling Pine Ln, Port Richey, FL 34668
$-172
Cash flow
-4.3%
Cash-on-Cash Return
5.2%
Cap rate
0.9%
Rent to Value Ratio
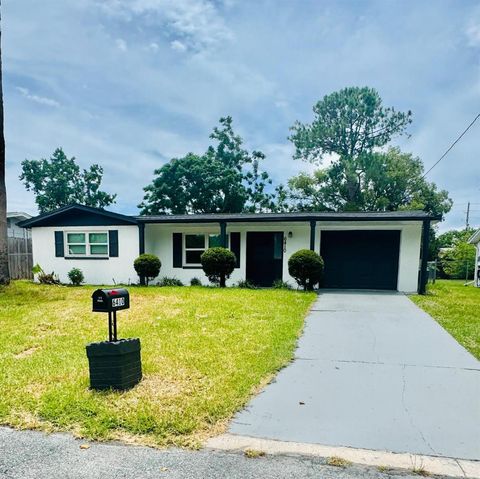
Active
$235,000
2
bds
|
2
ba
|
1,044
sqft
|
built
1969
6410 Gainsboro Dr, Port Richey, FL 34668
$-177
Cash flow
-3.9%
Cash-on-Cash Return
5.2%
Cap rate
0.7%
Rent to Value Ratio
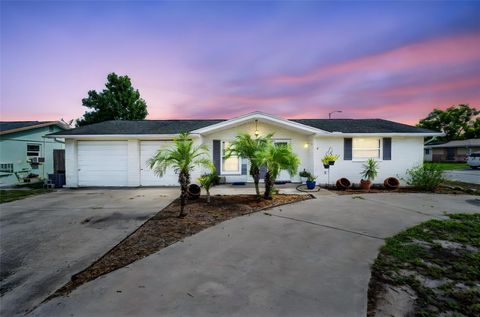
Active
$275,000
3
bds
|
2
ba
|
1,496
sqft
|
built
1978
7923 Foxbloom Dr, Port Richey, FL 34668
$-317
Cash flow
-6.0%
Cash-on-Cash Return
4.8%
Cap rate
0.7%
Rent to Value Ratio
Active
$214,900
2
bds
|
1
ba
|
825
sqft
|
built
1950
5151 Behms Ct, Port Richey, FL 34668
$-323
Cash flow
-7.8%
Cash-on-Cash Return
4.3%
Cap rate
0.7%
Rent to Value Ratio
Active
$410,000
2
bds
|
2
ba
|
1,172
sqft
|
built
1971
8633 Old Post Rd, Port Richey, FL 34668
$-464
Cash flow
-5.9%
Cash-on-Cash Return
4.8%
Cap rate
0.6%
Rent to Value Ratio
Active
$255,000
3
bds
|
2
ba
|
1,360
sqft
|
built
2005
7635 Sailwinds Pass, Port Richey, FL 34668
$-176
Cash flow
-3.6%
Cash-on-Cash Return
5.3%
Cap rate
0.8%
Rent to Value Ratio
Active
$310,000
3
bds
|
2
ba
|
1,310
sqft
|
built
1973
7140 Gulf Highlands Dr, Port Richey, FL 34668
$-343
Cash flow
-5.8%
Cash-on-Cash Return
4.8%
Cap rate
0.7%
Rent to Value Ratio
Active
$325,000
3
bds
|
2
ba
|
1,296
sqft
|
built
1997
7804 Wilmar Ct, Port Richey, FL 34668
$-689
Cash flow
-11.1%
Cash-on-Cash Return
3.6%
Cap rate
0.6%
Rent to Value Ratio
Active
$259,000
3
bds
|
2
ba
|
1,516
sqft
|
built
1972
5614 Bay Blvd, Port Richey, FL 34668
$-387
Cash flow
-7.8%
Cash-on-Cash Return
4.4%
Cap rate
0.7%
Rent to Value Ratio
Active
$435,000
5
bds
|
4
ba
|
1,928
sqft
|
built
1968
5117 Mallett Dr, Port Richey, FL 34668
$-1,793
Cash flow
-21.5%
Cash-on-Cash Return
1.2%
Cap rate
0.3%
Rent to Value Ratio
Active
$329,900
2
bds
|
2
ba
|
1,510
sqft
|
built
1985
7505 Bramblewood Dr, Port Richey, FL 34668
$-460
Cash flow
-7.3%
Cash-on-Cash Return
4.5%
Cap rate
0.7%
Rent to Value Ratio