34786 Investment Properties for Sale
Browse homes for sale and investment properties in 34786. Refine your search by price, property type, or more.
Best cash flowing properties in 34786
Active
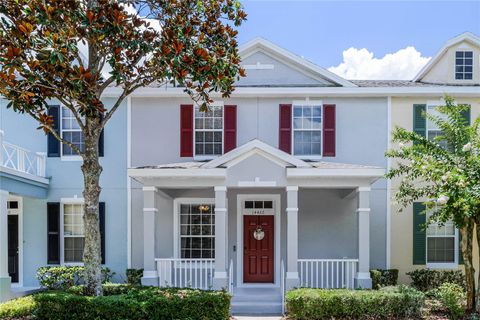
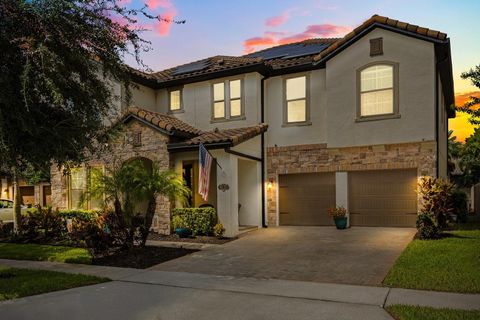
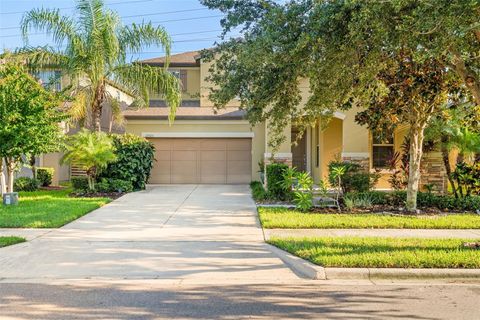
$418,000
4
bds
|
3
ba
|
1,642
sqft
|
built
2006
14466 Bridgewater Crossings Blvd, Windermere, FL 34786
$-849
Cash flow
-10.6%
Cash-on-Cash Return
3.7%
Cap rate
0.7%
Rent to Value Ratio
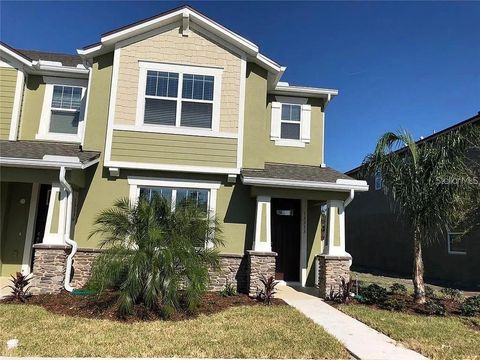
Active
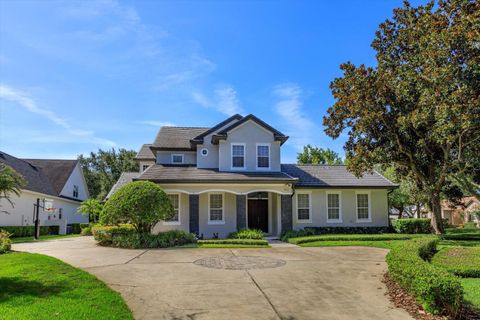
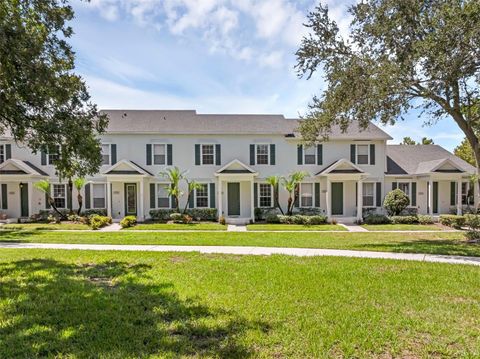
$480,000
3
bds
|
3
ba
|
1,779
sqft
|
built
2019
13333 Gorgona Isle Dr, Windermere, FL 34786
$-859
Cash flow
-9.3%
Cash-on-Cash Return
4.0%
Cap rate
0.6%
Rent to Value Ratio
88 out of 98 properties for sale in 34786
Limited Results Shown
Create a free account, or log in to reveal all property listings and enjoy the complete experience.
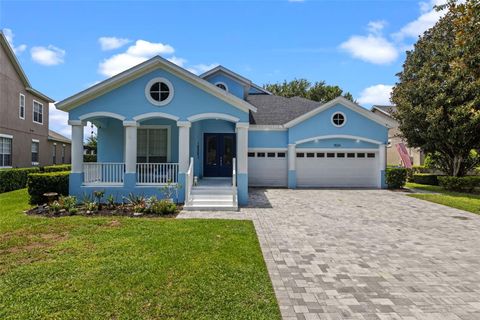
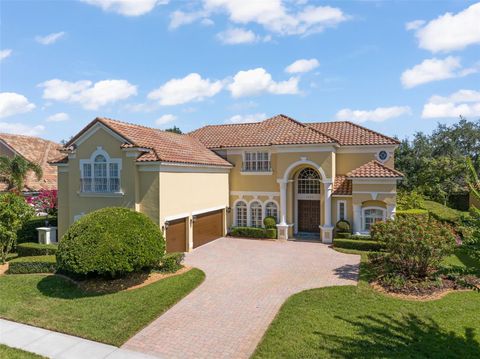
Active
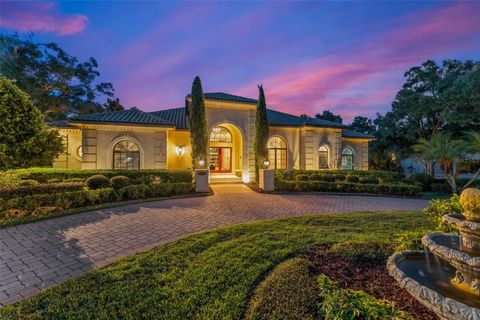
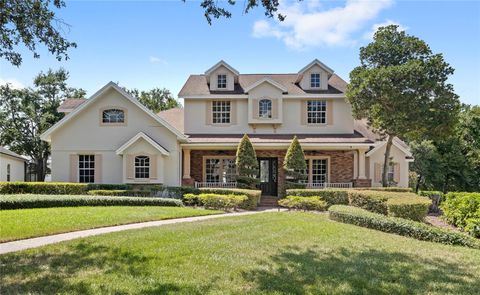
$1,448,000
5
bds
|
4
ba
|
3,358
sqft
|
built
2003
11524 Claymont Cir, Windermere, FL 34786
$-3,491
Cash flow
-12.6%
Cash-on-Cash Return
3.3%
Cap rate
0.4%
Rent to Value Ratio
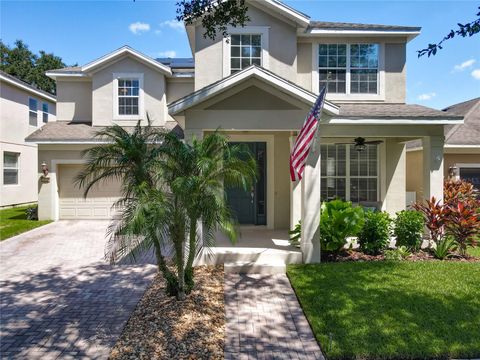
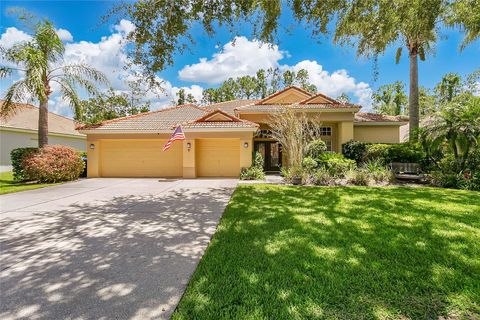
Active
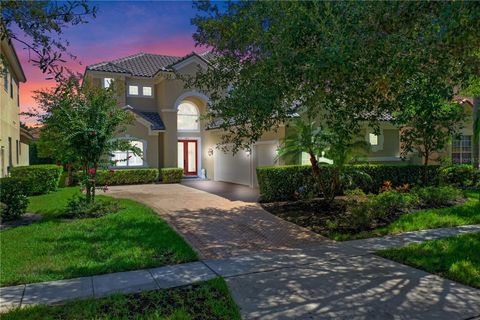
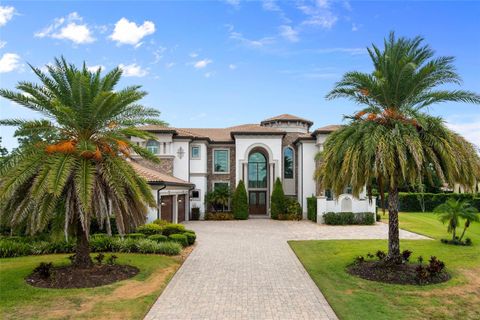
$649,000
4
bds
|
4
ba
|
2,628
sqft
|
built
2008
13225 Charfield St, Windermere, FL 34786
$-1,766
Cash flow
-14.2%
Cash-on-Cash Return
2.9%
Cap rate
0.5%
Rent to Value Ratio
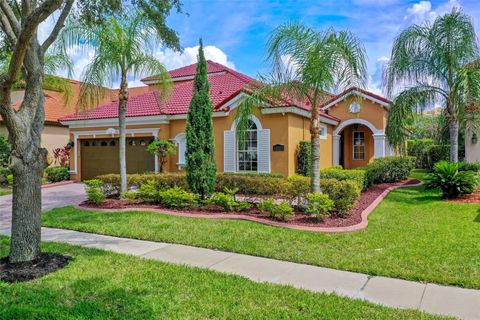
Active
$1,150,000
5
bds
|
5
ba
|
4,061
sqft
|
built
2018
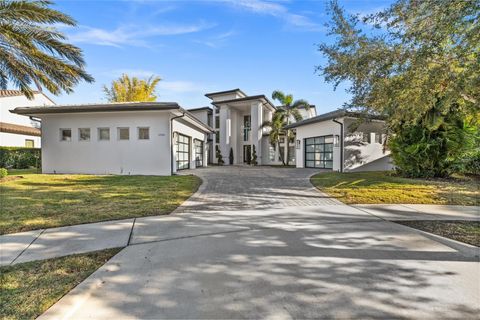
8420 Vivaro Isle Way, Windermere, FL 34786
$-3,714
Cash flow
-16.8%
Cash-on-Cash Return
2.3%
Cap rate
0.4%
Rent to Value Ratio
Active
$1,890,000
6
bds
|
4
ba
|
3,894
sqft
|
built
2000
9922 Brentford Ct, Windermere, FL 34786
$-5,832
Cash flow
-16.1%
Cash-on-Cash Return
2.4%
Cap rate
0.5%
Rent to Value Ratio
Active
$3,400,000
4
bds
|
4
ba
|
4,877
sqft
|
built
1986
9731 Chestnut Ridge Dr, Windermere, FL 34786
$-16,182
Cash flow
-24.8%
Cash-on-Cash Return
0.4%
Cap rate
0.2%
Rent to Value Ratio
Active
$990,000
4
bds
|
4
ba
|
3,938
sqft
|
built
2003
1451 Whitney Isles Dr, Windermere, FL 34786
$-2,923
Cash flow
-15.4%
Cash-on-Cash Return
2.6%
Cap rate
0.5%
Rent to Value Ratio
Active
$625,000
4
bds
|
3
ba
|
2,981
sqft
|
built
2013
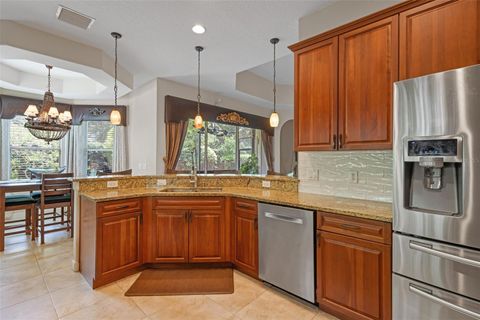
12925 Holdenbury Ln, Windermere, FL 34786
$-1,343
Cash flow
-11.2%
Cash-on-Cash Return
3.6%
Cap rate
0.6%
Rent to Value Ratio
Active
$378,800
3
bds
|
3
ba
|
1,461
sqft
|
built
2005
5318 Kumquat Loop, Windermere, FL 34786
$-1,032
Cash flow
-14.2%
Cash-on-Cash Return
2.9%
Cap rate
0.7%
Rent to Value Ratio
Active
$1,170,000
4
bds
|
4
ba
|
4,676
sqft
|
built
1999
2107 Westover Reserve Blvd, Windermere, FL 34786
$-1,955
Cash flow
-8.7%
Cash-on-Cash Return
4.1%
Cap rate
0.6%
Rent to Value Ratio
Active
$3,450,000
6
bds
|
8
ba
|
7,559
sqft
|
built
2016
4077 Isabella Cir, Windermere, FL 34786
$-15,371
Cash flow
-23.2%
Cash-on-Cash Return
0.8%
Cap rate
0.3%
Rent to Value Ratio
Active
$1,750,000
5
bds
|
4
ba
|
3,805
sqft
|
built
1913
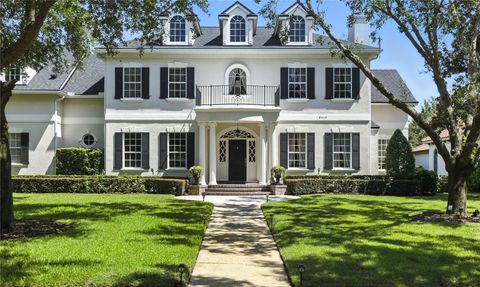
311 E 8th Ave, Windermere, FL 34786
$-5,855
Cash flow
-17.5%
Cash-on-Cash Return
2.1%
Cap rate
0.4%
Rent to Value Ratio
Active
$679,000
3
bds
|
3
ba
|
2,463
sqft
|
built
2018
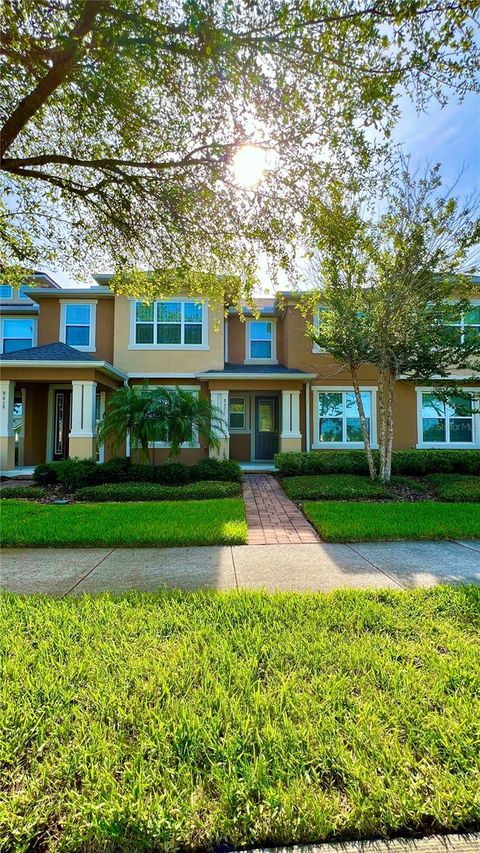
12815 Westside Village Loop, Windermere, FL 34786
$-2,035
Cash flow
-15.6%
Cash-on-Cash Return
2.6%
Cap rate
0.5%
Rent to Value Ratio
Active
$570,000
3
bds
|
3
ba
|
1,984
sqft
|
built
2012
6266 Golden Dewdrop Trl, Windermere, FL 34786
$-1,519
Cash flow
-13.9%
Cash-on-Cash Return
2.9%
Cap rate
0.6%
Rent to Value Ratio
Active
$3,200,000
4
bds
|
5
ba
|
3,745
sqft
|
built
2006
4819 Alexandra Garden Ct, Windermere, FL 34786
$-17,540
Cash flow
-28.6%
Cash-on-Cash Return
-0.4%
Cap rate
0.2%
Rent to Value Ratio
Active
$1,596,027
7
bds
|
5
ba
|
4,940
sqft
|
built
2004
1524 Lake Rhea Dr, Windermere, FL 34786
$-3,071
Cash flow
-10.0%
Cash-on-Cash Return
3.8%
Cap rate
0.6%
Rent to Value Ratio
Active
$974,900
5
bds
|
5
ba
|
3,285
sqft
|
built
2003
11096 Ledgement Ln, Windermere, FL 34786
$-2,961
Cash flow
-15.8%
Cash-on-Cash Return
2.5%
Cap rate
0.5%
Rent to Value Ratio
Active
$630,000
4
bds
|
2
ba
|
2,505
sqft
|
built
2005
11520 Via Lucerna Cir, Windermere, FL 34786
$-1,665
Cash flow
-13.8%
Cash-on-Cash Return
3.0%
Cap rate
0.6%
Rent to Value Ratio
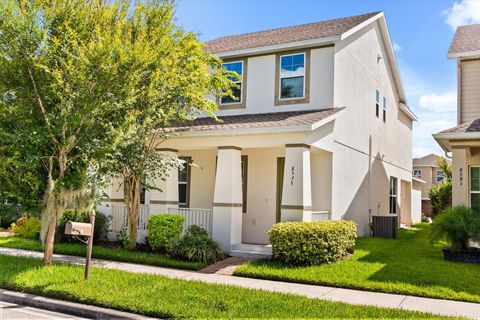
Active
$539,900
3
bds
|
3
ba
|
2,154
sqft
|
built
2015
8575 Lookout Pointe Dr, Windermere, FL 34786
$-1,440
Cash flow
-13.9%
Cash-on-Cash Return
2.9%
Cap rate
0.5%
Rent to Value Ratio
Active
$895,000
4
bds
|
5
ba
|
3,051
sqft
|
built
2004
11660 Delwick Dr, Windermere, FL 34786
$-1,981
Cash flow
-11.5%
Cash-on-Cash Return
3.5%
Cap rate
0.6%
Rent to Value Ratio
Active
$2,895,000
5
bds
|
7
ba
|
6,105
sqft
|
built
2003
11209 Macaw Ct, Windermere, FL 34786
$-11,128
Cash flow
-20.1%
Cash-on-Cash Return
1.5%
Cap rate
0.3%
Rent to Value Ratio
Active
$530,000
3
bds
|
3
ba
|
1,826
sqft
|
built
2015
10750 Reams Rd, Windermere, FL 34786
$-867
Cash flow
-8.5%
Cash-on-Cash Return
4.2%
Cap rate
0.7%
Rent to Value Ratio
Active
$1,200,000
7
bds
|
4
ba
|
3,928
sqft
|
built
2012
12023 Gold Creek Trl, Windermere, FL 34786
$-2,239
Cash flow
-9.7%
Cash-on-Cash Return
3.9%
Cap rate
0.6%
Rent to Value Ratio
Active
$1,050,000
4
bds
|
3
ba
|
2,224
sqft
|
built
2018
13542 Gorgona Isle Dr, Windermere, FL 34786
$-3,977
Cash flow
-19.8%
Cash-on-Cash Return
1.6%
Cap rate
0.3%
Rent to Value Ratio
Active
$3,799,000
4
bds
|
5
ba
|
6,054
sqft
|
built
2007
12812 Jacob Grace Ct, Windermere, FL 34786
$-15,887
Cash flow
-21.8%
Cash-on-Cash Return
1.1%
Cap rate
0.2%
Rent to Value Ratio
Active
$585,000
4
bds
|
2
ba
|
2,159
sqft
|
built
2002
11322 Rapallo Ln, Windermere, FL 34786
$-1,834
Cash flow
-16.4%
Cash-on-Cash Return
2.4%
Cap rate
0.5%
Rent to Value Ratio
Active
$3,795,000
5
bds
|
7
ba
|
7,263
sqft
|
built
1987
10545 Down Lakeview Cir, Windermere, FL 34786
$-19,548
Cash flow
-26.9%
Cash-on-Cash Return
0.0%
Cap rate
0.1%
Rent to Value Ratio
Active
$5,890,000
4
bds
|
7
ba
|
7,872
sqft
|
built
2017
12264 Montalcino Cir, Windermere, FL 34786
$-31,638
Cash flow
-28.0%
Cash-on-Cash Return
-0.3%
Cap rate
0.2%
Rent to Value Ratio
Active
$401,990
3
bds
|
3
ba
|
1,554
sqft
|
built
2016
8625 Coventry Park Way, Windermere, FL 34786
$-1,035
Cash flow
-13.4%
Cash-on-Cash Return
3.1%
Cap rate
0.7%
Rent to Value Ratio
Active
$2,195,000
5
bds
|
5
ba
|
5,052
sqft
|
built
2006
9210 Tibet Pointe Cir, Windermere, FL 34786
$-8,259
Cash flow
-19.6%
Cash-on-Cash Return
1.6%
Cap rate
0.3%
Rent to Value Ratio
Active
$659,900
3
bds
|
3
ba
|
2,433
sqft
|
built
2005
1656 Whitney Isles Dr, Windermere, FL 34786
$-1,481
Cash flow
-11.7%
Cash-on-Cash Return
3.5%
Cap rate
0.5%
Rent to Value Ratio
Active
$1,350,000
4
bds
|
3
ba
|
3,888
sqft
|
built
1985
10506 Down Lakeview Cir, Windermere, FL 34786
$-4,419
Cash flow
-17.1%
Cash-on-Cash Return
2.2%
Cap rate
0.4%
Rent to Value Ratio
Active
$3,250,000
4
bds
|
6
ba
|
4,849
sqft
|
built
2002
6186 Louise Cove Dr, Windermere, FL 34786
$-13,560
Cash flow
-21.8%
Cash-on-Cash Return
1.1%
Cap rate
0.3%
Rent to Value Ratio
Active
$389,990
3
bds
|
3
ba
|
1,520
sqft
|
built
2012
7621 Sutherton Ln, Windermere, FL 34786
$-869
Cash flow
-11.6%
Cash-on-Cash Return
3.5%
Cap rate
0.6%
Rent to Value Ratio
Active
$389,000
3
bds
|
3
ba
|
1,369
sqft
|
built
2004
12744 Langstaff Dr, Windermere, FL 34786
$-902
Cash flow
-12.1%
Cash-on-Cash Return
3.4%
Cap rate
0.6%
Rent to Value Ratio
Active
$1,399,000
4
bds
|
4
ba
|
2,681
sqft
|
built
1987
3417 Bay Meadow Ct, Windermere, FL 34786
$-5,392
Cash flow
-20.1%
Cash-on-Cash Return
1.5%
Cap rate
0.3%
Rent to Value Ratio
Active
$409,000
3
bds
|
3
ba
|
1,584
sqft
|
built
2017
11686 Water Run Aly, Windermere, FL 34786
$-936
Cash flow
-11.9%
Cash-on-Cash Return
3.4%
Cap rate
0.6%
Rent to Value Ratio
Active
$399,990
3
bds
|
3
ba
|
1,462
sqft
|
built
2004
5235 Keenes Pheasant Dr, Windermere, FL 34786
$-1,162
Cash flow
-15.2%
Cash-on-Cash Return
2.7%
Cap rate
0.6%
Rent to Value Ratio
Active
$1,499,900
5
bds
|
5
ba
|
4,477
sqft
|
built
2007
1450 Belfiore Way, Windermere, FL 34786
$-4,190
Cash flow
-14.6%
Cash-on-Cash Return
2.8%
Cap rate
0.5%
Rent to Value Ratio