35203 Investment Properties for Sale
Browse homes for sale and investment properties in 35203. Refine your search by price, property type, or more.
Best cash flowing properties in 35203
Active
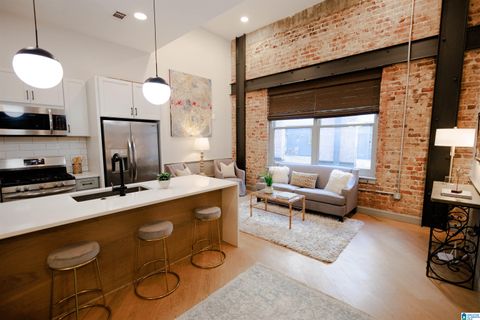
$189,900
1
bds
|
1
ba
|
984
sqft
|
built
1925
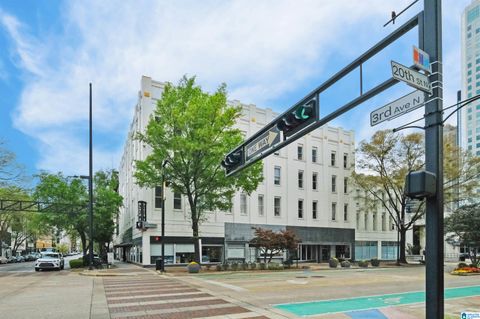
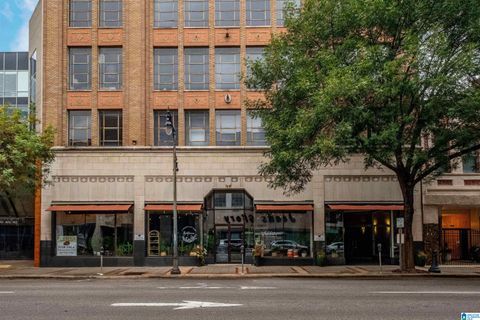
2008 3rd Ave N, Birmingham, AL 35203
$274
Cash flow
7.5%
Cash-on-Cash Return
7.4%
Cap rate
0.9%
Rent to Value Ratio
Active
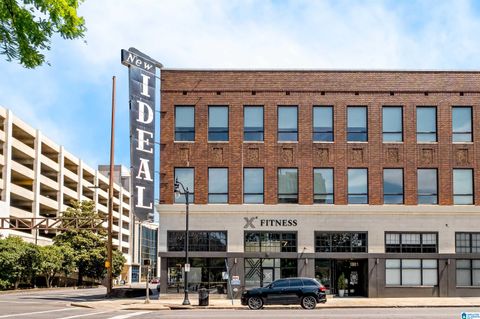
$154,900
1
bds
|
1
ba
|
276
sqft
|
built
1887
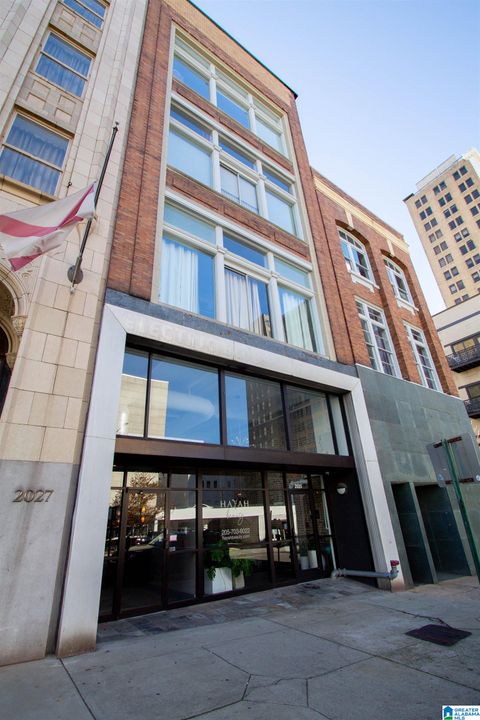
2015 1st Ave N, Birmingham, AL 35203
$219
Cash flow
7.4%
Cash-on-Cash Return
7.4%
Cap rate
1.0%
Rent to Value Ratio
32 out of 39 properties for sale in 35203
Limited Results Shown
Create a free account, or log in to reveal all property listings and enjoy the complete experience.
Active
$344,900
2
bds
|
2
ba
|
1,340
sqft
|
built
1913
2024 2nd Ave N, Birmingham, AL 35203
$-604
Cash flow
-9.1%
Cash-on-Cash Return
3.6%
Cap rate
0.8%
Rent to Value Ratio
Active
$400,000
2
bds
|
1.5
ba
|
1,822
sqft
|
built
1924
1921 3rd Ave N, Birmingham, AL 35203
$-168
Cash flow
-2.2%
Cash-on-Cash Return
5.2%
Cap rate
0.6%
Rent to Value Ratio
Active
$299,000
1
bds
|
1
ba
|
608
sqft
|
built
1905
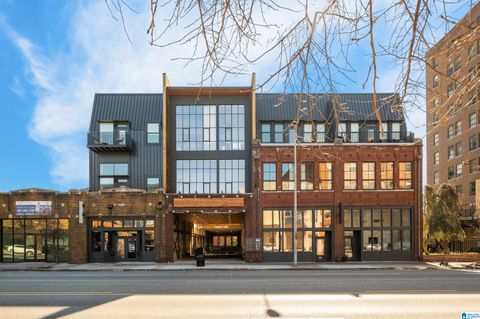
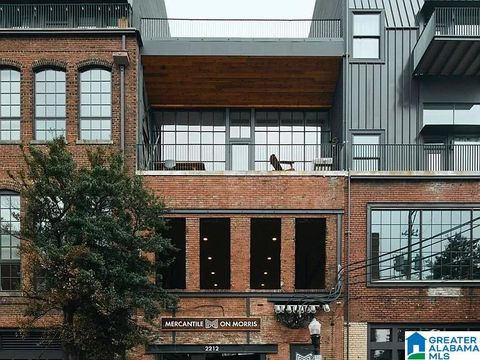
2212 Morris Ave, Birmingham, AL 35203
$-416
Cash flow
-7.3%
Cash-on-Cash Return
4.0%
Cap rate
0.6%
Rent to Value Ratio
Active
$365,000
2
bds
|
1
ba
|
1,139
sqft
|
built
1920
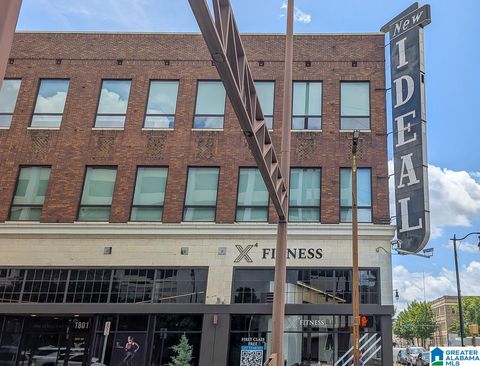
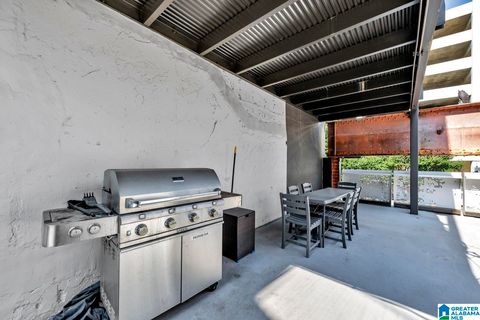
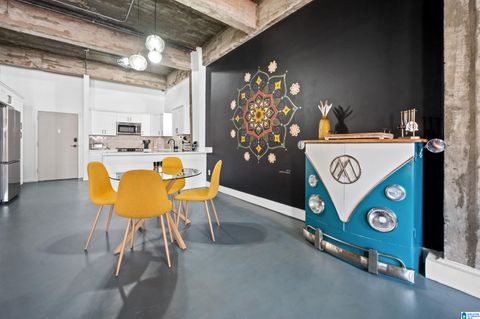
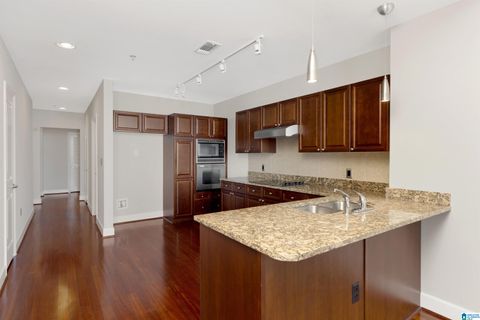
1801 2nd Ave N, Birmingham, AL 35203
$-280
Cash flow
-4.0%
Cash-on-Cash Return
4.8%
Cap rate
0.7%
Rent to Value Ratio
Active
$399,000
2
bds
|
1
ba
|
1,395
sqft
|
built
1926
2301 1st Ave N, Birmingham, AL 35203
$-307
Cash flow
-4.0%
Cash-on-Cash Return
4.8%
Cap rate
0.7%
Rent to Value Ratio
Active
$499,000
1
bds
|
1
ba
|
2,362
sqft
|
built
1910
2321 1st Ave N, Birmingham, AL 35203
$-1,022
Cash flow
-10.7%
Cash-on-Cash Return
3.2%
Cap rate
0.6%
Rent to Value Ratio
Active
$244,900
2
bds
|
1
ba
|
1,125
sqft
|
built
1925
2008 3rd Ave N, Birmingham, AL 35203
$-334
Cash flow
-7.1%
Cash-on-Cash Return
4.0%
Cap rate
0.8%
Rent to Value Ratio
Active
$369,900
1
bds
|
1
ba
|
650
sqft
|
built
1905
2212 Morris Ave, Birmingham, AL 35203
$-689
Cash flow
-9.7%
Cash-on-Cash Return
3.4%
Cap rate
0.5%
Rent to Value Ratio
Active
$310,000
2
bds
|
1
ba
|
1,285
sqft
|
built
1926
2301 1st Ave N, Birmingham, AL 35203
$-93
Cash flow
-1.6%
Cash-on-Cash Return
5.3%
Cap rate
0.8%
Rent to Value Ratio
Active
$339,000
2
bds
|
1
ba
|
1,042
sqft
|
built
1924
2301 Morris Ave, Birmingham, AL 35203
$121
Cash flow
1.9%
Cash-on-Cash Return
6.1%
Cap rate
0.7%
Rent to Value Ratio
Active
$294,900
1
bds
|
1
ba
|
477
sqft
|
built
1905
2212 Morris Ave, Birmingham, AL 35203
$-663
Cash flow
-11.7%
Cash-on-Cash Return
3.0%
Cap rate
0.5%
Rent to Value Ratio
Active
$289,000
1
bds
|
1
ba
|
609
sqft
|
built
2021
2212 Morris Ave, Birmingham, AL 35203
$-126
Cash flow
-2.3%
Cash-on-Cash Return
5.2%
Cap rate
0.6%
Rent to Value Ratio
Active
$1,195,000
2
bds
|
2
ba
|
2,618
sqft
|
built
2020
1801 2nd Ave N, Birmingham, AL 35203
$-3,445
Cash flow
-15.0%
Cash-on-Cash Return
2.2%
Cap rate
0.3%
Rent to Value Ratio
Active
$322,000
1
bds
|
1
ba
|
735
sqft
|
built
2021
2212 Morris Ave, Birmingham, AL 35203
$-411
Cash flow
-6.7%
Cash-on-Cash Return
4.1%
Cap rate
0.6%
Rent to Value Ratio
Active
$314,900
1
bds
|
1
ba
|
810
sqft
|
built
1920
1801 2nd Ave N, Birmingham, AL 35203
$-234
Cash flow
-3.9%
Cash-on-Cash Return
4.8%
Cap rate
0.7%
Rent to Value Ratio
Active
$280,000
1
bds
|
1
ba
|
731
sqft
|
built
1920
1801 2nd Ave N, Birmingham, AL 35203
$-160
Cash flow
-3.0%
Cash-on-Cash Return
5.0%
Cap rate
0.7%
Rent to Value Ratio
Active
$309,900
1
bds
|
1
ba
|
1,039
sqft
|
built
1910
2327 Morris Ave, Birmingham, AL 35203
$-401
Cash flow
-6.8%
Cash-on-Cash Return
4.1%
Cap rate
0.6%
Rent to Value Ratio
Active
$290,000
2
bds
|
2
ba
|
1,136
sqft
|
built
1913
2024 2nd Ave N, Birmingham, AL 35203
$-481
Cash flow
-8.7%
Cash-on-Cash Return
3.7%
Cap rate
0.8%
Rent to Value Ratio
Active
$227,500
1
bds
|
1
ba
|
770
sqft
|
built
2020
1801 2nd Ave N, Birmingham, AL 35203
$-188
Cash flow
-4.3%
Cash-on-Cash Return
4.7%
Cap rate
0.7%
Rent to Value Ratio
Active
$295,999
1
bds
|
1
ba
|
1,004
sqft
|
built
1924
2301 Morris Ave, Birmingham, AL 35203
$117
Cash flow
2.1%
Cash-on-Cash Return
6.2%
Cap rate
0.7%
Rent to Value Ratio
Active
$325,000
1
bds
|
1
ba
|
1,132
sqft
|
built
1920
113 22nd St N, Birmingham, AL 35203
$-153
Cash flow
-2.5%
Cash-on-Cash Return
5.1%
Cap rate
0.8%
Rent to Value Ratio
Active
$449,900
2
bds
|
2
ba
|
1,375
sqft
|
built
1920
113 22nd St N, Birmingham, AL 35203
$-197
Cash flow
-2.3%
Cash-on-Cash Return
5.2%
Cap rate
0.6%
Rent to Value Ratio
Active
$339,900
1
bds
|
1
ba
|
1,046
sqft
|
built
2021
300 20th St N, Birmingham, AL 35203
$-570
Cash flow
-8.7%
Cash-on-Cash Return
3.7%
Cap rate
0.6%
Rent to Value Ratio
Active
$439,000
2
bds
|
2
ba
|
1,453
sqft
|
built
2021
300 20th St N, Birmingham, AL 35203
$62
Cash flow
0.7%
Cash-on-Cash Return
5.8%
Cap rate
0.7%
Rent to Value Ratio
Active
$349,999
1
bds
|
1
ba
|
1,046
sqft
|
built
2021
300 20th St N, Birmingham, AL 35203
$-274
Cash flow
-4.1%
Cash-on-Cash Return
4.7%
Cap rate
0.7%
Rent to Value Ratio
Active
$325,000
1
bds
|
1
ba
|
1,070
sqft
|
built
1946
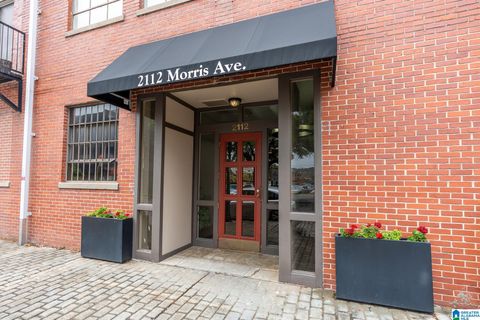
2112 Morris Ave, Birmingham, AL 35203
$-20
Cash flow
-0.3%
Cash-on-Cash Return
5.6%
Cap rate
0.7%
Rent to Value Ratio
Active
$399,900
2
bds
|
2
ba
|
1,444
sqft
|
built
1937
1914 3rd Ave N, Birmingham, AL 35203
$-633
Cash flow
-8.3%
Cash-on-Cash Return
3.8%
Cap rate
0.7%
Rent to Value Ratio
Active
$368,000
2
bds
|
2
ba
|
1,161
sqft
|
built
1924
2025 1st Ave N, Birmingham, AL 35203
$-506
Cash flow
-7.2%
Cash-on-Cash Return
4.0%
Cap rate
0.7%
Rent to Value Ratio
Active
$549,900
2
bds
|
2
ba
|
1,751
sqft
|
built
2020
1801 2nd Ave N, Birmingham, AL 35203
$-573
Cash flow
-5.4%
Cash-on-Cash Return
4.4%
Cap rate
0.7%
Rent to Value Ratio
Active
$365,000
1
bds
|
1
ba
|
1,050
sqft
|
built
1910
2327 Morris Ave, Birmingham, AL 35203
$-388
Cash flow
-5.5%
Cash-on-Cash Return
4.4%
Cap rate
0.6%
Rent to Value Ratio