35206 Investment Properties for Sale
Browse homes for sale and investment properties in 35206. Refine your search by price, property type, or more.
Best cash flowing properties in 35206

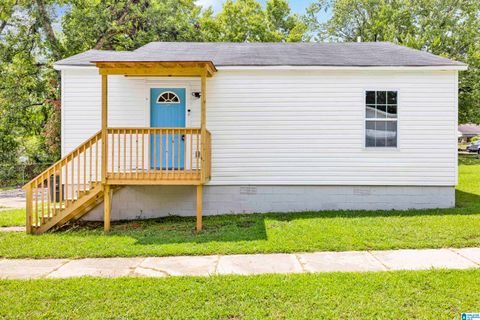
Active
$70,000
2
bds
|
1
ba
|
936
sqft
|
built
1949
429 86th Pl S, Birmingham, AL 35206
$690
Cash flow
11.5%
Cash-on-Cash Return
11.8%
Cap rate
1.4%
Rent to Value Ratio
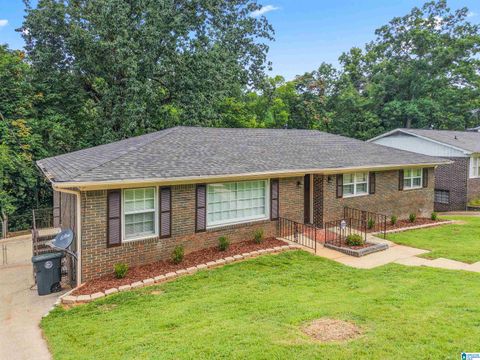
Active
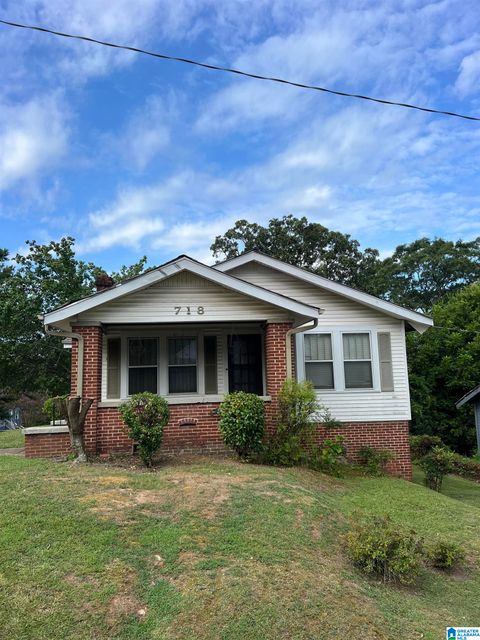
$80,000
2
bds
|
1
ba
|
1,037
sqft
|
built
1930
718 78th St S, Birmingham, AL 35206
$587
Cash flow
38.3%
Cash-on-Cash Return
14.5%
Cap rate
1.8%
Rent to Value Ratio
51 out of 53 properties for sale in 35206
Limited Results Shown
Create a free account, or log in to reveal all property listings and enjoy the complete experience.

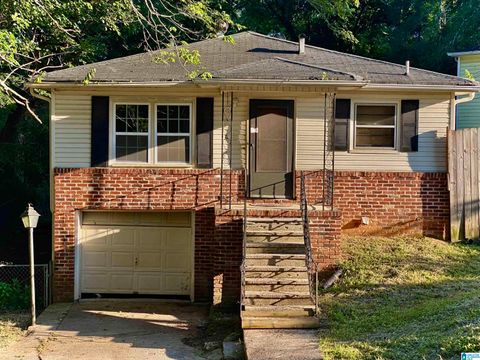
Active
$189,900
3
bds
|
2
ba
|
1,561
sqft
|
built
1920
7305 Division Ave, Birmingham, AL 35206
$67
Cash flow
1.8%
Cash-on-Cash Return
6.1%
Cap rate
0.7%
Rent to Value Ratio
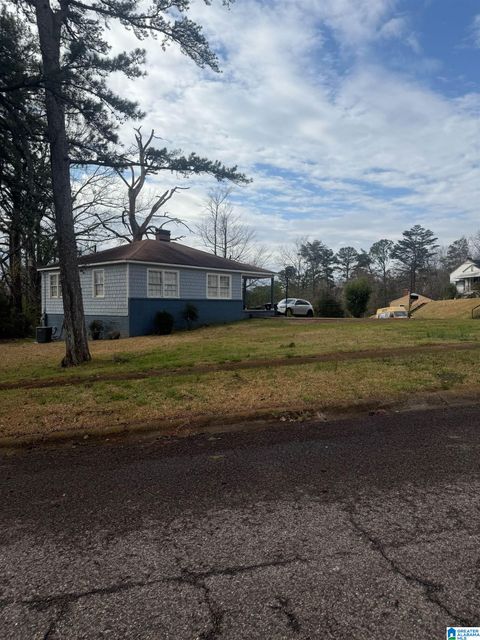
Active
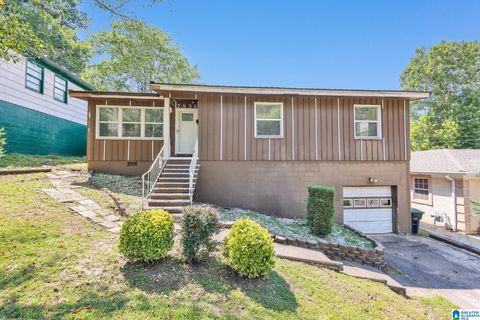
$110,000
3
bds
|
1.5
ba
|
1,148
sqft
|
built
1961
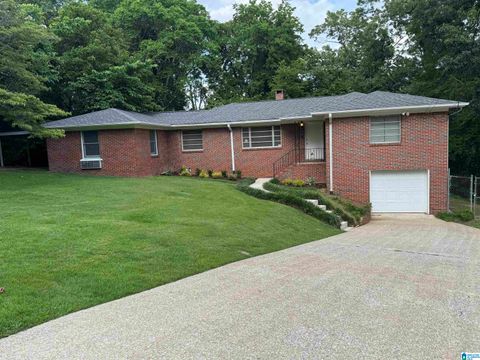
7836 10th Ave S, Birmingham, AL 35206
$445
Cash flow
21.1%
Cash-on-Cash Return
10.5%
Cap rate
1.3%
Rent to Value Ratio
Active
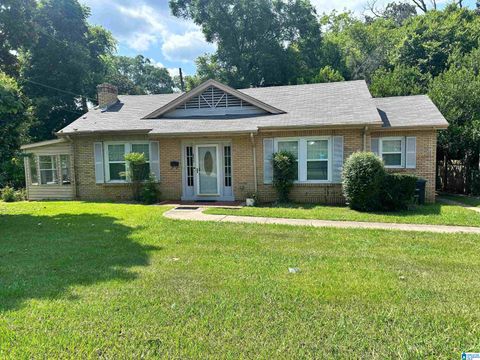
$185,000
3
bds
|
2
ba
|
1,938
sqft
|
built
1940
8512 4th Ave S, Birmingham, AL 35206
$160
Cash flow
4.5%
Cash-on-Cash Return
6.7%
Cap rate
0.8%
Rent to Value Ratio

Active
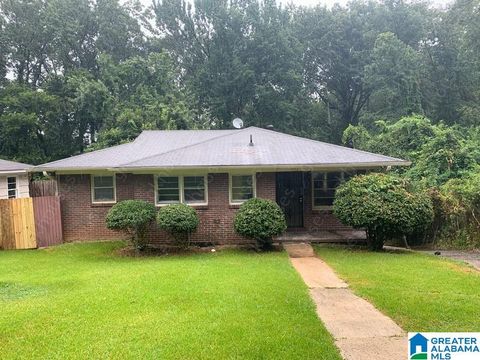
$145,000
3
bds
|
2
ba
|
1,858
sqft
|
built
1930
7116 Division Ave, Birmingham, AL 35206
$4
Cash flow
0.1%
Cash-on-Cash Return
5.7%
Cap rate
0.7%
Rent to Value Ratio
Active
$95,000
3
bds
|
1.5
ba
|
1,238
sqft
|
built
1963
913 77th St S, Birmingham, AL 35206
$516
Cash flow
28.3%
Cash-on-Cash Return
12.2%
Cap rate
1.5%
Rent to Value Ratio
Active
$120,000
2
bds
|
1
ba
|
1,150
sqft
|
built
1955
7931 6th Ave N, Birmingham, AL 35206
$260
Cash flow
11.3%
Cash-on-Cash Return
8.3%
Cap rate
1.0%
Rent to Value Ratio

Active
$144,900
3
bds
|
1.5
ba
|
1,304
sqft
|
built
1960
8311 12th Ave S, Birmingham, AL 35206
$280
Cash flow
10.1%
Cash-on-Cash Return
8.0%
Cap rate
1.0%
Rent to Value Ratio

Active
$105,000
2
bds
|
1
ba
|
890
sqft
|
built
1948
425 87th St S, Birmingham, AL 35206
$400
Cash flow
19.9%
Cash-on-Cash Return
10.3%
Cap rate
1.2%
Rent to Value Ratio
Active
$260,000
3
bds
|
2
ba
|
2,420
sqft
|
built
1964
833 86th Pl S, Birmingham, AL 35206
$-195
Cash flow
-3.9%
Cash-on-Cash Return
4.8%
Cap rate
0.6%
Rent to Value Ratio
Active
$107,000
3
bds
|
2
ba
|
1,026
sqft
|
built
1964
600 74th St S, Birmingham, AL 35206
$322
Cash flow
15.7%
Cash-on-Cash Return
9.3%
Cap rate
1.1%
Rent to Value Ratio

Active
$82,900
3
bds
|
1
ba
|
1,394
sqft
|
built
1935
8412 3rd Ave S, Birmingham, AL 35206
$574
Cash flow
36.1%
Cash-on-Cash Return
14.0%
Cap rate
1.7%
Rent to Value Ratio

Active
$95,500
4
bds
|
1.5
ba
|
2,037
sqft
|
built
1920
7428 1st Ave S, Birmingham, AL 35206
$514
Cash flow
28.1%
Cash-on-Cash Return
12.1%
Cap rate
1.5%
Rent to Value Ratio

Active
$143,000
3
bds
|
2
ba
|
1,350
sqft
|
built
1966
901 Glenvalley Dr, Birmingham, AL 35206
$289
Cash flow
10.5%
Cash-on-Cash Return
8.1%
Cap rate
1.0%
Rent to Value Ratio

Active
$220,000
4
bds
|
2.5
ba
|
1,673
sqft
|
built
1959
604 Gravlee Ln, Birmingham, AL 35206
$-144
Cash flow
-3.4%
Cash-on-Cash Return
4.9%
Cap rate
0.6%
Rent to Value Ratio

Active
$172,500
3
bds
|
2
ba
|
1,546
sqft
|
built
1957
709 Highland Ave, Birmingham, AL 35206
$219
Cash flow
6.6%
Cash-on-Cash Return
7.2%
Cap rate
0.9%
Rent to Value Ratio

Active
$200,000
3
bds
|
2
ba
|
1,127
sqft
|
built
1950
7432 Queenstown Ave, Birmingham, AL 35206
$-256
Cash flow
-6.7%
Cash-on-Cash Return
4.1%
Cap rate
0.5%
Rent to Value Ratio

Active
$80,000
4
bds
|
1
ba
|
1,092
sqft
|
built
1950
620 83rd Pl S, Birmingham, AL 35206
$311
Cash flow
20.3%
Cash-on-Cash Return
10.4%
Cap rate
1.3%
Rent to Value Ratio

Active
$145,000
3
bds
|
2
ba
|
1,461
sqft
|
built
1935
507 80th St S, Birmingham, AL 35206
$349
Cash flow
12.6%
Cash-on-Cash Return
8.6%
Cap rate
1.0%
Rent to Value Ratio

Active
$94,900
3
bds
|
1
ba
|
1,053
sqft
|
built
1950
448 86th St S, Birmingham, AL 35206
$517
Cash flow
28.4%
Cash-on-Cash Return
12.2%
Cap rate
1.5%
Rent to Value Ratio
Active
$100,000
3
bds
|
1
ba
|
999
sqft
|
built
1950
9001 Belvoir Dr, Birmingham, AL 35206
$355
Cash flow
18.5%
Cash-on-Cash Return
9.9%
Cap rate
1.2%
Rent to Value Ratio

Active
$234,900
3
bds
|
1.5
ba
|
1,680
sqft
|
built
1940
528 85th St S, Birmingham, AL 35206
$130
Cash flow
2.9%
Cash-on-Cash Return
6.3%
Cap rate
0.8%
Rent to Value Ratio

Active
$120,000
3
bds
|
2
ba
|
2,204
sqft
|
built
1980
8319 12th Ave S, Birmingham, AL 35206
$329
Cash flow
14.3%
Cash-on-Cash Return
9.0%
Cap rate
1.1%
Rent to Value Ratio

Active
$128,999
3
bds
|
1
ba
|
1,438
sqft
|
built
1948
7416 Rome Ave, Birmingham, AL 35206
$494
Cash flow
20.0%
Cash-on-Cash Return
10.3%
Cap rate
1.2%
Rent to Value Ratio
Active
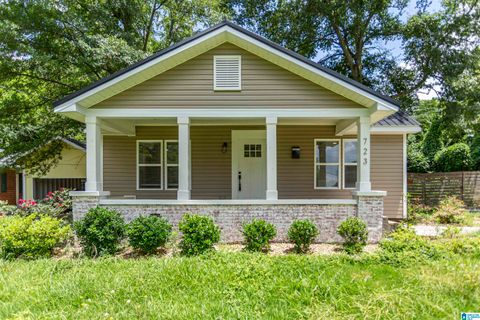
$214,900
3
bds
|
1
ba
|
1,380
sqft
|
built
1937
723 84th Pl S, Birmingham, AL 35206
$363
Cash flow
8.8%
Cash-on-Cash Return
7.7%
Cap rate
0.9%
Rent to Value Ratio
Active
$130,000
3
bds
|
2
ba
|
1,572
sqft
|
built
1935
7236 Oporto Ave, Birmingham, AL 35206
$489
Cash flow
19.6%
Cash-on-Cash Return
10.2%
Cap rate
1.2%
Rent to Value Ratio
Active
$79,900
2
bds
|
1
ba
|
904
sqft
|
built
1952
7808 Vienna Ave, Birmingham, AL 35206
$381
Cash flow
24.9%
Cash-on-Cash Return
11.4%
Cap rate
1.4%
Rent to Value Ratio

Active
$110,000
3
bds
|
1
ba
|
1,202
sqft
|
built
1931
117 67th Pl N, Birmingham, AL 35206
$307
Cash flow
14.6%
Cash-on-Cash Return
9.0%
Cap rate
1.1%
Rent to Value Ratio
Active
$129,900
4
bds
|
2
ba
|
1,976
sqft
|
built
1935
8300 7th Ter S, Birmingham, AL 35206
$351
Cash flow
14.1%
Cash-on-Cash Return
8.9%
Cap rate
1.1%
Rent to Value Ratio
Active
$244,900
4
bds
|
3
ba
|
2,815
sqft
|
built
1956
601 Elm St, Birmingham, AL 35206
$83
Cash flow
1.8%
Cash-on-Cash Return
6.1%
Cap rate
0.7%
Rent to Value Ratio

Active
$174,900
3
bds
|
2
ba
|
1,329
sqft
|
built
1973
413 Lance Ln, Birmingham, AL 35206
$276
Cash flow
8.2%
Cash-on-Cash Return
7.6%
Cap rate
0.9%
Rent to Value Ratio

Active
$123,900
3
bds
|
1
ba
|
1,108
sqft
|
built
1935
7908 5th Ave N, Birmingham, AL 35206
$311
Cash flow
13.1%
Cash-on-Cash Return
8.7%
Cap rate
1.0%
Rent to Value Ratio

Active
$330,000
2
bds
|
0
ba
|
0
sqft
|
built
1964
7728 Rugby Ave, Birmingham, AL 35206
$-872
Cash flow
-13.8%
Cash-on-Cash Return
2.5%
Cap rate
0.3%
Rent to Value Ratio
Active
$135,000
3
bds
|
2
ba
|
1,515
sqft
|
built
1982
7116 6th Ct S, Birmingham, AL 35206
$258
Cash flow
10.0%
Cash-on-Cash Return
8.0%
Cap rate
1.0%
Rent to Value Ratio
Active
$130,000
3
bds
|
1
ba
|
1,304
sqft
|
built
1946
8321 Vassar Ave, Birmingham, AL 35206
$282
Cash flow
11.3%
Cash-on-Cash Return
8.3%
Cap rate
1.0%
Rent to Value Ratio

Active
$129,000
3
bds
|
1
ba
|
1,418
sqft
|
built
1940
412 85th St S, Birmingham, AL 35206
$218
Cash flow
8.8%
Cash-on-Cash Return
7.7%
Cap rate
0.9%
Rent to Value Ratio

Active
$139,000
4
bds
|
1
ba
|
1,143
sqft
|
built
1955
8311 7th Ave S, Birmingham, AL 35206
$308
Cash flow
11.6%
Cash-on-Cash Return
8.3%
Cap rate
1.0%
Rent to Value Ratio

Active
$80,000
3
bds
|
1
ba
|
1,264
sqft
|
built
1955
8133 9th Ave S, Birmingham, AL 35206
$380
Cash flow
24.8%
Cash-on-Cash Return
11.4%
Cap rate
1.4%
Rent to Value Ratio

Active
$88,900
2
bds
|
1
ba
|
940
sqft
|
built
1948
9048 Bel Aire Dr, Birmingham, AL 35206
$338
Cash flow
19.8%
Cash-on-Cash Return
10.2%
Cap rate
1.2%
Rent to Value Ratio