35211 Investment Properties for Sale
Browse homes for sale and investment properties in 35211. Refine your search by price, property type, or more.
Best cash flowing properties in 35211
Active
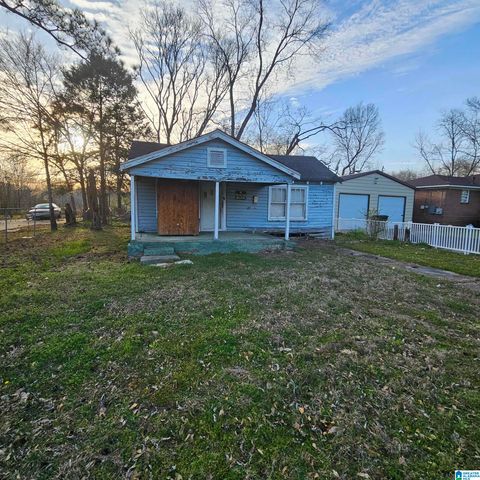
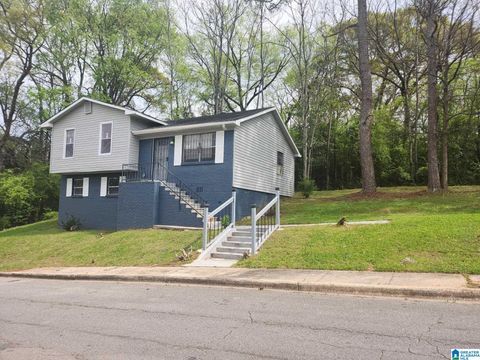
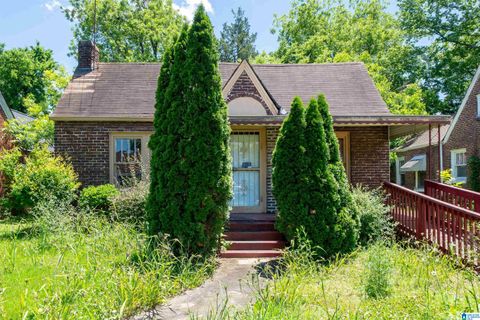
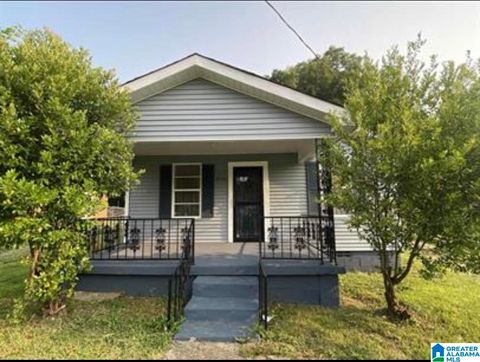
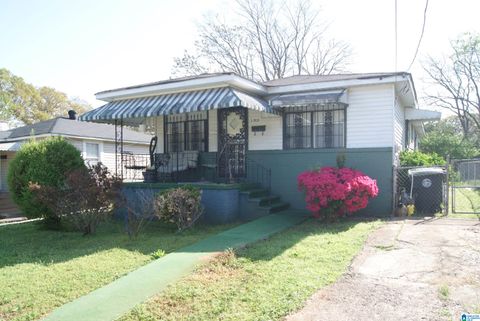
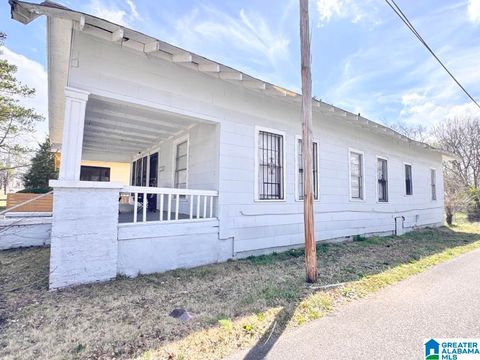
$14,888
3
bds
|
0
ba
|
1,040
sqft
|
built
1940
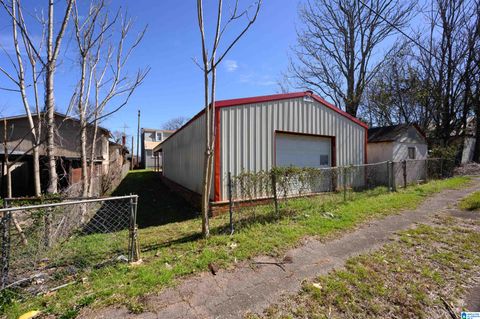
716 30th Pl SW, Birmingham, AL 35211
$828
Cash flow
64.8%
Cash-on-Cash Return
66.7%
Cap rate
8.1%
Rent to Value Ratio

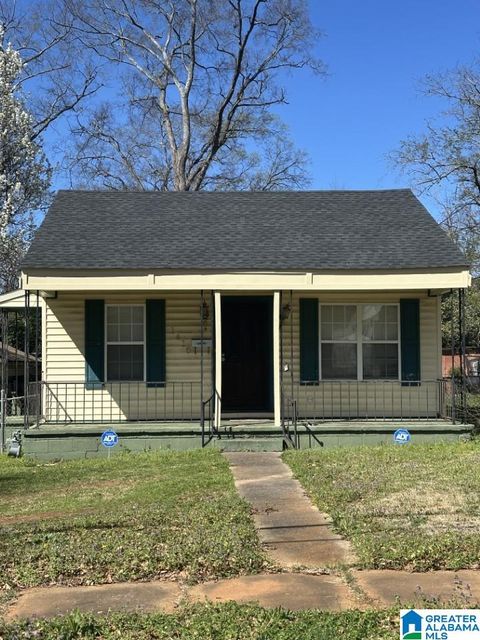
Active
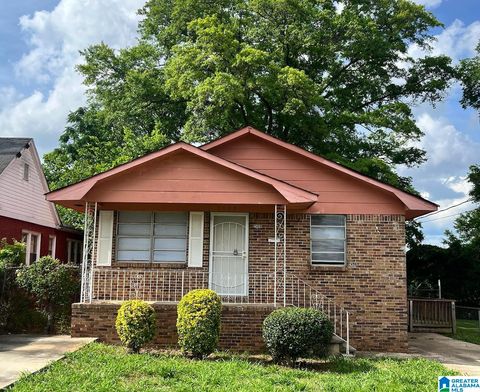
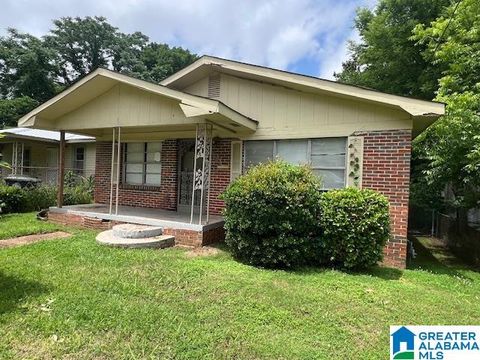
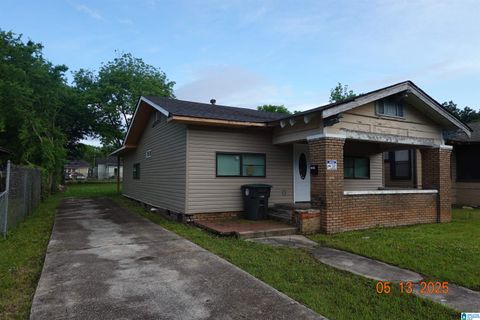
$45,000
3
bds
|
0
ba
|
1,068
sqft
|
built
1945
2100 Dawson Ave SW, Birmingham, AL 35211
$828
Cash flow
21.4%
Cash-on-Cash Return
22.1%
Cap rate
2.7%
Rent to Value Ratio
63 out of 72 properties for sale in 35211
Limited Results Shown
Create a free account, or log in to reveal all property listings and enjoy the complete experience.
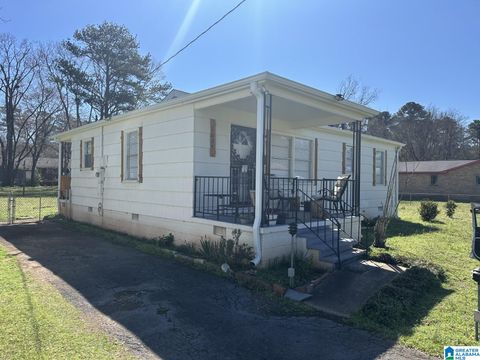
Active
$45,000
3
bds
|
0
ba
|
1,068
sqft
|
built
1945
2100 Dawson Ave SW, Birmingham, AL 35211
$828
Cash flow
21.4%
Cash-on-Cash Return
22.1%
Cap rate
2.7%
Rent to Value Ratio

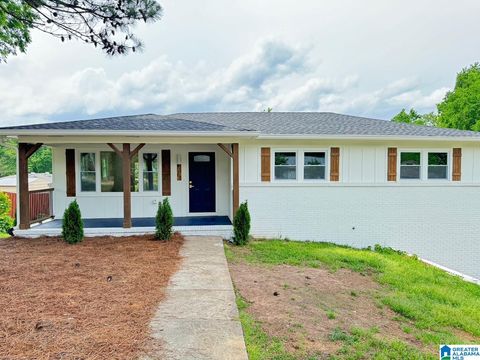
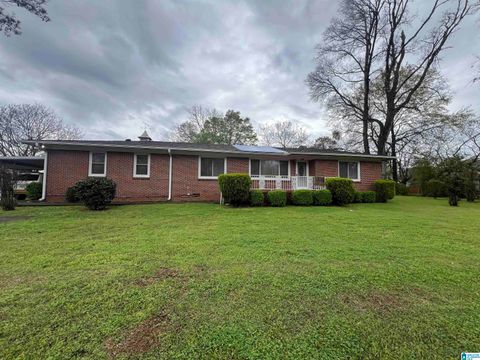
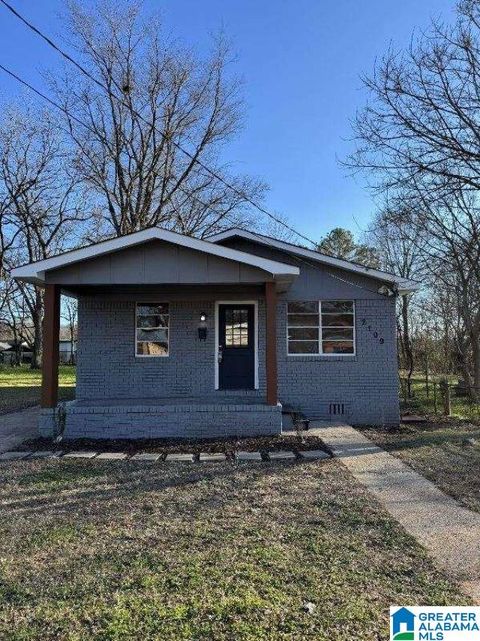
Active
$159,900
3
bds
|
0
ba
|
1,101
sqft
|
built
1940
741 Center Pl SW, Birmingham, AL 35211
$-76
Cash flow
-2.5%
Cash-on-Cash Return
5.7%
Cap rate
0.7%
Rent to Value Ratio
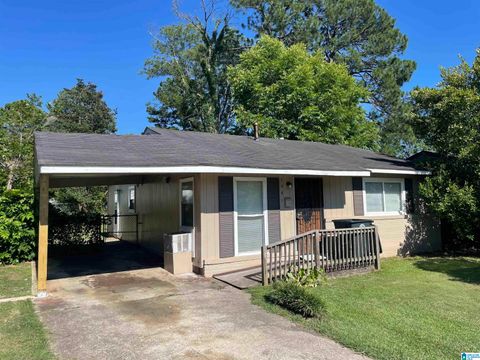
Active
$100,000
4
bds
|
0
ba
|
1,335
sqft
|
built
1975
2408 Powderly Ave SW, Birmingham, AL 35211
$444
Cash flow
23.2%
Cash-on-Cash Return
11.6%
Cap rate
1.4%
Rent to Value Ratio
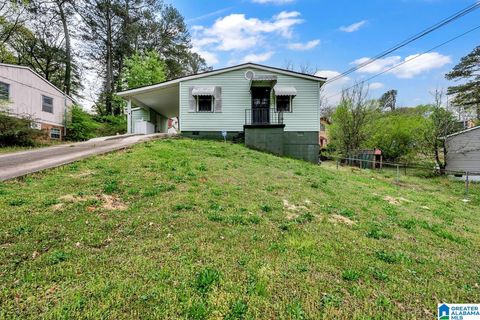
Active
$159,900
3
bds
|
0
ba
|
1,960
sqft
|
built
1955
517 22nd St SW, Birmingham, AL 35211
$407
Cash flow
13.3%
Cash-on-Cash Return
9.3%
Cap rate
1.1%
Rent to Value Ratio
Active
$150,000
2
bds
|
0
ba
|
2,174
sqft
|
built
1925
1100 16th St SW, Birmingham, AL 35211
$183
Cash flow
6.4%
Cash-on-Cash Return
7.7%
Cap rate
0.9%
Rent to Value Ratio
Active
$130,000
3
bds
|
0
ba
|
1,286
sqft
|
built
1970
2125 Henry Crumpton Dr, Birmingham, AL 35211
$218
Cash flow
8.7%
Cash-on-Cash Return
8.3%
Cap rate
1.0%
Rent to Value Ratio
Active
$99,900
5
bds
|
0
ba
|
2,896
sqft
|
built
1940
2304 Mayfield Ave SW, Birmingham, AL 35211
$513
Cash flow
26.8%
Cash-on-Cash Return
12.4%
Cap rate
1.5%
Rent to Value Ratio
Active
$250,000
4
bds
|
0
ba
|
2,818
sqft
|
built
1965
1604 Francis Ave SW, Birmingham, AL 35211
$-408
Cash flow
-8.5%
Cash-on-Cash Return
4.3%
Cap rate
0.5%
Rent to Value Ratio
Active
$159,000
4
bds
|
0
ba
|
2,172
sqft
|
built
1969
1904 14th Pl SW, Birmingham, AL 35211
$343
Cash flow
11.3%
Cash-on-Cash Return
8.9%
Cap rate
1.1%
Rent to Value Ratio
Active
$90,000
3
bds
|
0
ba
|
1,481
sqft
|
built
1927
1809 Saint Charles Ct SW, Birmingham, AL 35211
$358
Cash flow
20.8%
Cash-on-Cash Return
11.0%
Cap rate
1.3%
Rent to Value Ratio

Active
$104,900
3
bds
|
0
ba
|
710
sqft
|
built
1956
118 3rd Ave SW, Birmingham, AL 35211
$211
Cash flow
10.5%
Cash-on-Cash Return
8.7%
Cap rate
1.0%
Rent to Value Ratio

Active
$59,900
3
bds
|
0
ba
|
864
sqft
|
built
1959
1541 Dennison Ave SW, Birmingham, AL 35211
$690
Cash flow
13.4%
Cash-on-Cash Return
13.8%
Cap rate
1.7%
Rent to Value Ratio

Active
$65,000
3
bds
|
0
ba
|
1,110
sqft
|
built
1910
1012 15th St SW, Birmingham, AL 35211
$759
Cash flow
13.6%
Cash-on-Cash Return
14.0%
Cap rate
1.7%
Rent to Value Ratio

Active
$114,999
3
bds
|
0
ba
|
1,248
sqft
|
built
1947
1861 Woodland Ave SW, Birmingham, AL 35211
$159
Cash flow
7.2%
Cash-on-Cash Return
7.9%
Cap rate
1.0%
Rent to Value Ratio
Active
$65,000
3
bds
|
0
ba
|
1,244
sqft
|
built
1930
1521 Alabama Ave SW, Birmingham, AL 35211
$621
Cash flow
11.1%
Cash-on-Cash Return
11.5%
Cap rate
1.4%
Rent to Value Ratio

Active
$289,999
4
bds
|
0
ba
|
1,780
sqft
|
built
1940
1233 Mays Village Rd, Birmingham, AL 35211
$-410
Cash flow
-7.4%
Cash-on-Cash Return
4.6%
Cap rate
0.6%
Rent to Value Ratio

Active
$169,900
3
bds
|
0
ba
|
1,975
sqft
|
built
1960
2901 Jefferson Ave SW, Birmingham, AL 35211
$217
Cash flow
6.7%
Cash-on-Cash Return
7.8%
Cap rate
0.9%
Rent to Value Ratio
Active
$85,000
3
bds
|
0
ba
|
975
sqft
|
built
1965
2412 Lawn Ave SW, Birmingham, AL 35211
$315
Cash flow
19.3%
Cash-on-Cash Return
10.7%
Cap rate
1.3%
Rent to Value Ratio

Active
$40,000
2
bds
|
0
ba
|
768
sqft
|
built
1949
348 21st St SW, Birmingham, AL 35211
$621
Cash flow
18.1%
Cash-on-Cash Return
18.6%
Cap rate
2.3%
Rent to Value Ratio
Active
$209,900
3
bds
|
0
ba
|
1,278
sqft
|
built
1949
830 1st St SW, Birmingham, AL 35211
$8
Cash flow
0.2%
Cash-on-Cash Return
6.3%
Cap rate
0.8%
Rent to Value Ratio
Active
$95,000
3
bds
|
0
ba
|
856
sqft
|
built
1989
2129 Northland Ave SW, Birmingham, AL 35211
$332
Cash flow
18.2%
Cash-on-Cash Return
10.5%
Cap rate
1.3%
Rent to Value Ratio
Active
$225,900
3
bds
|
0
ba
|
1,053
sqft
|
built
1982
1448 Matt Leonard Dr SW, Birmingham, AL 35211
$-282
Cash flow
-6.5%
Cash-on-Cash Return
4.8%
Cap rate
0.6%
Rent to Value Ratio

Active
$85,000
2
bds
|
0
ba
|
716
sqft
|
built
1962
1808 Jefferson Ave SW, Birmingham, AL 35211
$177
Cash flow
10.9%
Cash-on-Cash Return
8.8%
Cap rate
1.1%
Rent to Value Ratio
Active
$109,099
3
bds
|
0
ba
|
841
sqft
|
built
1960
1341 16th Pl SW, Birmingham, AL 35211
$258
Cash flow
12.3%
Cash-on-Cash Return
9.1%
Cap rate
1.1%
Rent to Value Ratio
Active
$79,500
3
bds
|
0
ba
|
1,275
sqft
|
built
1961
2404 Ishkooda Rd SW, Birmingham, AL 35211
$413
Cash flow
27.1%
Cash-on-Cash Return
12.5%
Cap rate
1.5%
Rent to Value Ratio
Active
$84,900
4
bds
|
0
ba
|
1,126
sqft
|
built
1963
1513 20th Pl SW, Birmingham, AL 35211
$316
Cash flow
19.4%
Cash-on-Cash Return
10.7%
Cap rate
1.3%
Rent to Value Ratio

Active
$77,500
3
bds
|
0
ba
|
1,100
sqft
|
built
1947
2101 Fulton Ave SW, Birmingham, AL 35211
$354
Cash flow
23.8%
Cash-on-Cash Return
11.8%
Cap rate
1.4%
Rent to Value Ratio
Active
$160,000
3
bds
|
0
ba
|
2,288
sqft
|
built
1965
3000 Jefferson Ave SW, Birmingham, AL 35211
$407
Cash flow
13.3%
Cash-on-Cash Return
9.3%
Cap rate
1.1%
Rent to Value Ratio
Active
$63,500
2
bds
|
0
ba
|
846
sqft
|
built
1948
340 22nd St SW, Birmingham, AL 35211
$759
Cash flow
13.9%
Cash-on-Cash Return
14.3%
Cap rate
1.7%
Rent to Value Ratio
Active
$105,000
2
bds
|
0
ba
|
1,595
sqft
|
built
1950
1235 18th Way SW, Birmingham, AL 35211
$418
Cash flow
20.8%
Cash-on-Cash Return
11.0%
Cap rate
1.3%
Rent to Value Ratio
Active
$94,900
3
bds
|
0
ba
|
1,444
sqft
|
built
1920
416 12th St SW, Birmingham, AL 35211
$264
Cash flow
14.5%
Cash-on-Cash Return
9.6%
Cap rate
1.2%
Rent to Value Ratio
Active
$14,888
3
bds
|
0
ba
|
1,040
sqft
|
built
1940
716 30th Pl SW, Birmingham, AL 35211
$828
Cash flow
64.8%
Cash-on-Cash Return
66.7%
Cap rate
8.1%
Rent to Value Ratio

Active
$94,500
3
bds
|
0
ba
|
1,074
sqft
|
built
1935
2725 Parklawn Ave SW, Birmingham, AL 35211
$404
Cash flow
22.3%
Cash-on-Cash Return
11.4%
Cap rate
1.4%
Rent to Value Ratio
Active
$85,000
3
bds
|
0
ba
|
1,000
sqft
|
built
1948
1416 18th Way SW, Birmingham, AL 35211
$246
Cash flow
15.1%
Cash-on-Cash Return
9.7%
Cap rate
1.2%
Rent to Value Ratio
Active
$120,000
3
bds
|
0
ba
|
962
sqft
|
built
1955
1625 17th St SW, Birmingham, AL 35211
$-5
Cash flow
-0.2%
Cash-on-Cash Return
6.2%
Cap rate
0.8%
Rent to Value Ratio
Active
$110,000
3
bds
|
0
ba
|
864
sqft
|
built
1950
2109 Powderly Ave SW, Birmingham, AL 35211
$185
Cash flow
8.8%
Cash-on-Cash Return
8.3%
Cap rate
1.0%
Rent to Value Ratio
Active
$144,000
4
bds
|
0
ba
|
1,980
sqft
|
built
1930
1124 15th Pl SW, Birmingham, AL 35211
$214
Cash flow
7.8%
Cash-on-Cash Return
8.1%
Cap rate
1.0%
Rent to Value Ratio

Active
$124,000
3
bds
|
0
ba
|
1,604
sqft
|
built
1925
1753 Lee Ave SW, Birmingham, AL 35211
$250
Cash flow
10.5%
Cash-on-Cash Return
8.7%
Cap rate
1.0%
Rent to Value Ratio
Active
$429,900
3
bds
|
0
ba
|
2,305
sqft
|
built
2022
3931 Sydney Dr, Birmingham, AL 35211
$-278
Cash flow
-3.4%
Cash-on-Cash Return
5.5%
Cap rate
0.7%
Rent to Value Ratio
Active
$158,000
3
bds
|
0
ba
|
1,120
sqft
|
built
1945
1130 16th St SW, Birmingham, AL 35211
$-135
Cash flow
-4.5%
Cash-on-Cash Return
5.2%
Cap rate
0.6%
Rent to Value Ratio