35211 Investment Properties for Sale
Browse homes for sale and investment properties in 35211. Refine your search by price, property type, or more.
Best cash flowing properties in 35211
Active
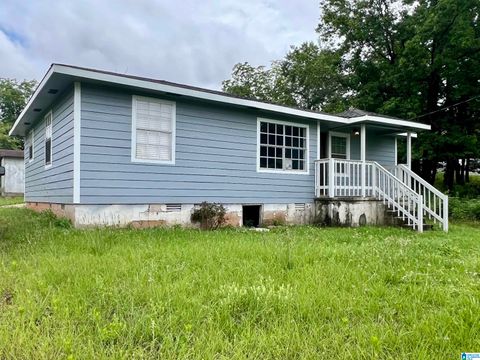
$74,900
5
bds
|
3
ba
|
2,896
sqft
|
built
1940
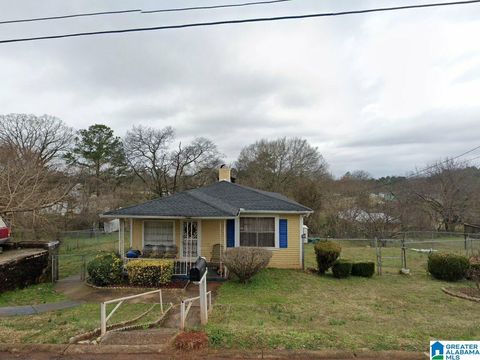
2304 Mayfield Ave SW, Birmingham, AL 35211
$1,035
Cash flow
16.1%
Cash-on-Cash Return
16.6%
Cap rate
2.0%
Rent to Value Ratio
Active
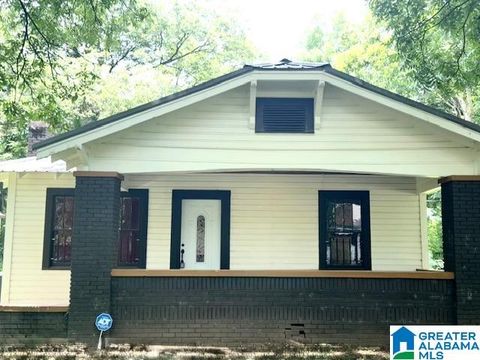
$40,000
4
bds
|
2
ba
|
2,012
sqft
|
built
1910
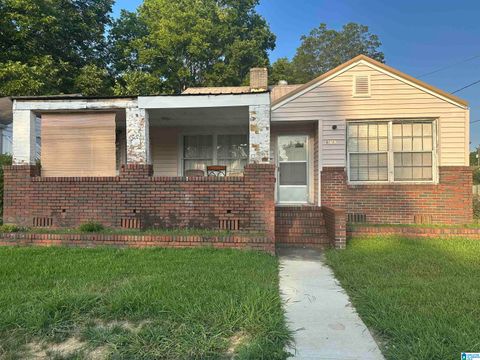
412 Princeton Ave SW, Birmingham, AL 35211
$1,035
Cash flow
30.1%
Cash-on-Cash Return
31.1%
Cap rate
3.8%
Rent to Value Ratio
63 out of 71 properties for sale in 35211
Limited Results Shown
Create a free account, or log in to reveal all property listings and enjoy the complete experience.
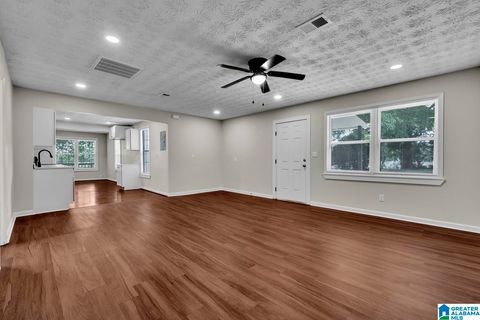
Active
$137,900
3
bds
|
2
ba
|
1,109
sqft
|
built
1955
1812 15th St SW, Birmingham, AL 35211
$313
Cash flow
11.8%
Cash-on-Cash Return
8.4%
Cap rate
1.0%
Rent to Value Ratio
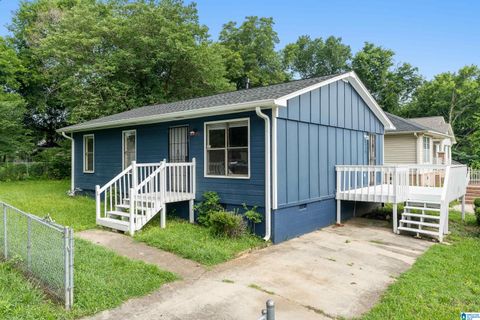
Active
$72,500
2
bds
|
1
ba
|
813
sqft
|
built
1947
2028 Lee Ter SW, Birmingham, AL 35211
$621
Cash flow
10.0%
Cash-on-Cash Return
10.3%
Cap rate
1.2%
Rent to Value Ratio
Active
$69,900
2
bds
|
1
ba
|
820
sqft
|
built
1915
724 Alabama Ave SW, Birmingham, AL 35211
$621
Cash flow
10.4%
Cash-on-Cash Return
10.7%
Cap rate
1.3%
Rent to Value Ratio
Active
$165,000
3
bds
|
1
ba
|
2,731
sqft
|
built
1964
1612 Laurel Ave SW, Birmingham, AL 35211
$185
Cash flow
5.8%
Cash-on-Cash Return
7.0%
Cap rate
0.8%
Rent to Value Ratio
Active
$144,900
4
bds
|
2
ba
|
1,378
sqft
|
built
1932
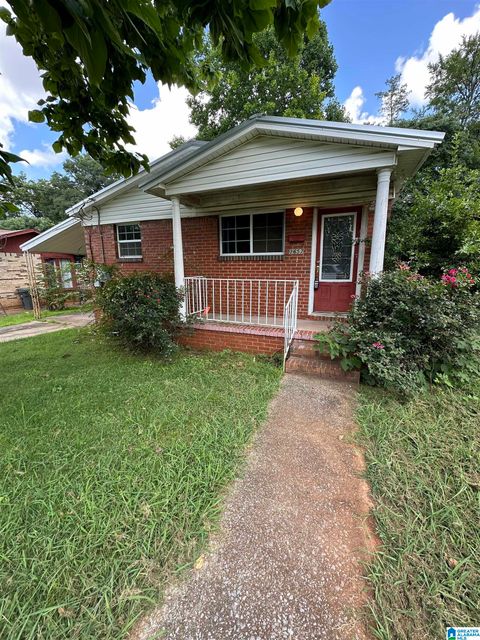
657 29th St SW, Birmingham, AL 35211
$280
Cash flow
10.1%
Cash-on-Cash Return
8.0%
Cap rate
1.0%
Rent to Value Ratio
Active
$17,000
2
bds
|
1
ba
|
990
sqft
|
built
1920
820 19th St SW, Birmingham, AL 35211
$759
Cash flow
52.0%
Cash-on-Cash Return
53.6%
Cap rate
6.5%
Rent to Value Ratio
Active
$265,000
2
bds
|
2
ba
|
1,140
sqft
|
built
2008
140 Singapore Cir, Birmingham, AL 35211
$28
Cash flow
0.6%
Cash-on-Cash Return
5.8%
Cap rate
0.7%
Rent to Value Ratio
Active
$113,000
3
bds
|
2
ba
|
1,690
sqft
|
built
1935
1828 Saint Charles Ave SW, Birmingham, AL 35211
$362
Cash flow
16.7%
Cash-on-Cash Return
9.5%
Cap rate
1.2%
Rent to Value Ratio
Active
$110,000
3
bds
|
1
ba
|
957
sqft
|
built
1957
125 11th Ave SW, Birmingham, AL 35211
$307
Cash flow
14.6%
Cash-on-Cash Return
9.0%
Cap rate
1.1%
Rent to Value Ratio
Active
$50,000
3
bds
|
1
ba
|
784
sqft
|
built
1949
914 21st St SW, Birmingham, AL 35211
$759
Cash flow
17.7%
Cash-on-Cash Return
18.2%
Cap rate
2.2%
Rent to Value Ratio
Active
$234,900
3
bds
|
2
ba
|
1,448
sqft
|
built
2025
537 Princeton Ave SW, Birmingham, AL 35211
$-146
Cash flow
-3.2%
Cash-on-Cash Return
4.9%
Cap rate
0.6%
Rent to Value Ratio
Active
$72,500
4
bds
|
2
ba
|
2,012
sqft
|
built
1930
537 17th St SW, Birmingham, AL 35211
$897
Cash flow
14.4%
Cash-on-Cash Return
14.8%
Cap rate
1.8%
Rent to Value Ratio
Active
$310,000
3
bds
|
2
ba
|
1,469
sqft
|
built
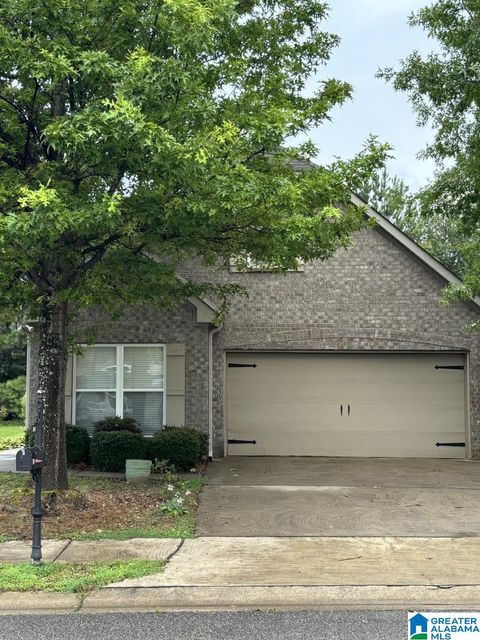
2007
2813 Oxmoor Glen Dr, Birmingham, AL 35211
$26
Cash flow
0.4%
Cash-on-Cash Return
5.8%
Cap rate
0.7%
Rent to Value Ratio
Active
$59,000
3
bds
|
1
ba
|
1,386
sqft
|
built
1960
2436 College Ave SW, Birmingham, AL 35211
$897
Cash flow
17.7%
Cash-on-Cash Return
18.2%
Cap rate
2.2%
Rent to Value Ratio
Active
$95,000
3
bds
|
1
ba
|
912
sqft
|
built
1960
1657 18th Way SW, Birmingham, AL 35211
$309
Cash flow
17.0%
Cash-on-Cash Return
9.6%
Cap rate
1.2%
Rent to Value Ratio
Active
$280,000
3
bds
|
2.5
ba
|
2,663
sqft
|
built
1962
944 Center Pl SW, Birmingham, AL 35211
$-83
Cash flow
-1.5%
Cash-on-Cash Return
5.3%
Cap rate
0.6%
Rent to Value Ratio
Active
$78,000
3
bds
|
2
ba
|
1,212
sqft
|
built
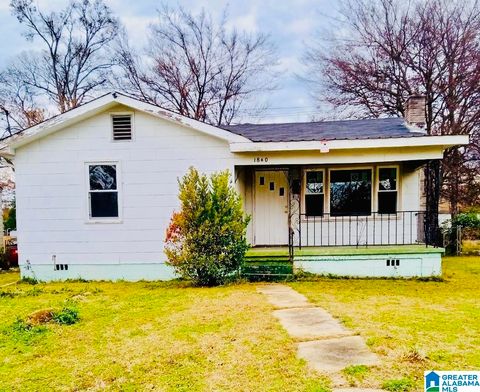
1948
1860 Fulton Ave SW, Birmingham, AL 35211
$390
Cash flow
26.1%
Cash-on-Cash Return
11.7%
Cap rate
1.4%
Rent to Value Ratio
Active
$90,000
3
bds
|
1
ba
|
1,824
sqft
|
built
1950
232 Flora St SW, Birmingham, AL 35211
$333
Cash flow
19.3%
Cash-on-Cash Return
10.1%
Cap rate
1.2%
Rent to Value Ratio
Active
$125,000
3
bds
|
1
ba
|
1,120
sqft
|
built
1955
2839 31st St SW, Birmingham, AL 35211
$305
Cash flow
12.7%
Cash-on-Cash Return
8.6%
Cap rate
1.0%
Rent to Value Ratio
Active
$150,000
3
bds
|
2
ba
|
1,650
sqft
|
built
1926
1608 28th St SW, Birmingham, AL 35211
$532
Cash flow
18.5%
Cash-on-Cash Return
9.9%
Cap rate
1.2%
Rent to Value Ratio
Active
$184,900
4
bds
|
2
ba
|
1,764
sqft
|
built
1950
1332 14th Pl SW, Birmingham, AL 35211
$-116
Cash flow
-3.3%
Cash-on-Cash Return
4.9%
Cap rate
0.6%
Rent to Value Ratio
Active
$112,000
3
bds
|
2
ba
|
972
sqft
|
built
1987
1920 15th Way SW, Birmingham, AL 35211
$160
Cash flow
7.5%
Cash-on-Cash Return
7.4%
Cap rate
0.9%
Rent to Value Ratio
Active
$60,000
3
bds
|
1
ba
|
1,207
sqft
|
built
1920
1760 Matt Leonard Dr SW, Birmingham, AL 35211
$966
Cash flow
18.8%
Cash-on-Cash Return
19.3%
Cap rate
2.3%
Rent to Value Ratio
Active
$59,900
3
bds
|
1
ba
|
1,318
sqft
|
built
1949
613 27th St SW, Birmingham, AL 35211
$621
Cash flow
12.1%
Cash-on-Cash Return
12.4%
Cap rate
1.5%
Rent to Value Ratio
Active
$334,999
4
bds
|
2
ba
|
1,638
sqft
|
built
2007
2801 Oxmoor Glen Dr, Birmingham, AL 35211
$115
Cash flow
1.8%
Cash-on-Cash Return
6.1%
Cap rate
0.7%
Rent to Value Ratio
Active
$96,900
3
bds
|
1
ba
|
1,537
sqft
|
built
1925
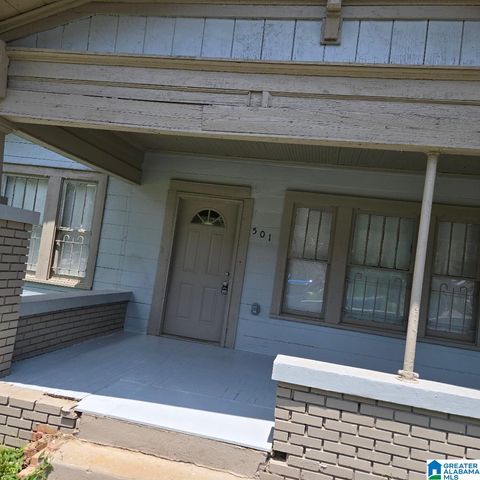
501 5th St SW, Birmingham, AL 35211
$231
Cash flow
12.4%
Cash-on-Cash Return
8.5%
Cap rate
1.0%
Rent to Value Ratio
Active
$125,000
2
bds
|
1
ba
|
988
sqft
|
built
1956
1669 18th St SW, Birmingham, AL 35211
$236
Cash flow
9.9%
Cash-on-Cash Return
7.9%
Cap rate
1.0%
Rent to Value Ratio
Active
$112,000
3
bds
|
1
ba
|
1,518
sqft
|
built
1955
1633 Mims St SW, Birmingham, AL 35211
$298
Cash flow
13.9%
Cash-on-Cash Return
8.9%
Cap rate
1.1%
Rent to Value Ratio
Active
$99,900
3
bds
|
1
ba
|
1,010
sqft
|
built
1955
1641 17th Pl SW, Birmingham, AL 35211
$355
Cash flow
18.5%
Cash-on-Cash Return
9.9%
Cap rate
1.2%
Rent to Value Ratio
Active
$159,900
3
bds
|
1
ba
|
1,101
sqft
|
built
1940
741 Center Pl SW, Birmingham, AL 35211
$2
Cash flow
0.1%
Cash-on-Cash Return
5.7%
Cap rate
0.7%
Rent to Value Ratio
Active
$100,000
4
bds
|
1.5
ba
|
1,335
sqft
|
built
1975
2408 Powderly Ave SW, Birmingham, AL 35211
$493
Cash flow
25.7%
Cash-on-Cash Return
11.6%
Cap rate
1.4%
Rent to Value Ratio
Active
$159,900
3
bds
|
1
ba
|
980
sqft
|
built
1955
517 22nd St SW, Birmingham, AL 35211
$485
Cash flow
15.8%
Cash-on-Cash Return
9.3%
Cap rate
1.1%
Rent to Value Ratio
Active
$130,000
3
bds
|
1
ba
|
1,286
sqft
|
built
1970
2125 Henry Crumpton Dr, Birmingham, AL 35211
$282
Cash flow
11.3%
Cash-on-Cash Return
8.3%
Cap rate
1.0%
Rent to Value Ratio
Active
$104,900
3
bds
|
1
ba
|
710
sqft
|
built
1956
118 3rd Ave SW, Birmingham, AL 35211
$263
Cash flow
13.1%
Cash-on-Cash Return
8.7%
Cap rate
1.0%
Rent to Value Ratio
Active
$65,000
3
bds
|
1
ba
|
1,244
sqft
|
built
1930
1521 Alabama Ave SW, Birmingham, AL 35211
$621
Cash flow
11.1%
Cash-on-Cash Return
11.5%
Cap rate
1.4%
Rent to Value Ratio
Active
$79,500
3
bds
|
1
ba
|
978
sqft
|
built
1949
1228 19th Pl SW, Birmingham, AL 35211
$314
Cash flow
20.6%
Cash-on-Cash Return
10.4%
Cap rate
1.3%
Rent to Value Ratio
Active
$74,900
3
bds
|
1
ba
|
975
sqft
|
built
1965
2412 Lawn Ave SW, Birmingham, AL 35211
$759
Cash flow
11.8%
Cash-on-Cash Return
12.2%
Cap rate
1.5%
Rent to Value Ratio
Active
$99,500
2
bds
|
1
ba
|
1,476
sqft
|
built
1920
1629 Steiner Ave SW, Birmingham, AL 35211
$495
Cash flow
26.0%
Cash-on-Cash Return
11.7%
Cap rate
1.4%
Rent to Value Ratio