35211 Investment Properties for Sale
Browse homes for sale and investment properties in 35211. Refine your search by price, property type, or more.
Best cash flowing properties in 35211
Active
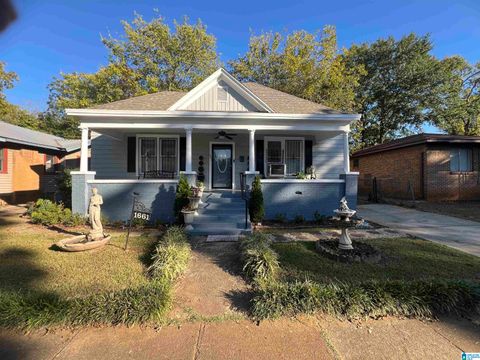
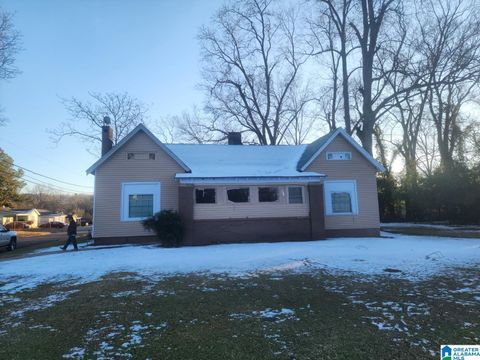
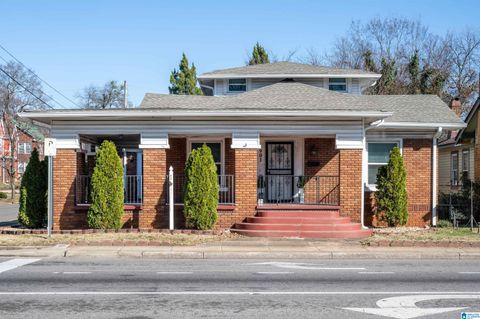
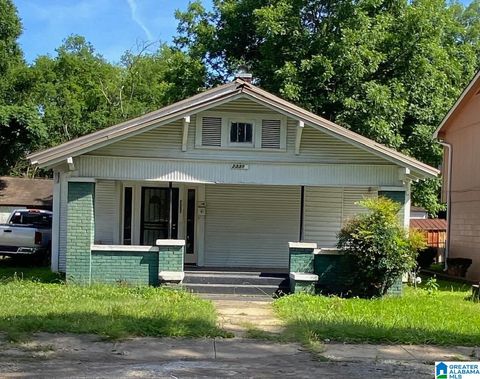
$72,500
3
bds
|
0
ba
|
1,226
sqft
|
built
1925
1661 Lee Ave SW, Birmingham, AL 35211
$828
Cash flow
13.3%
Cash-on-Cash Return
13.7%
Cap rate
1.7%
Rent to Value Ratio
Active
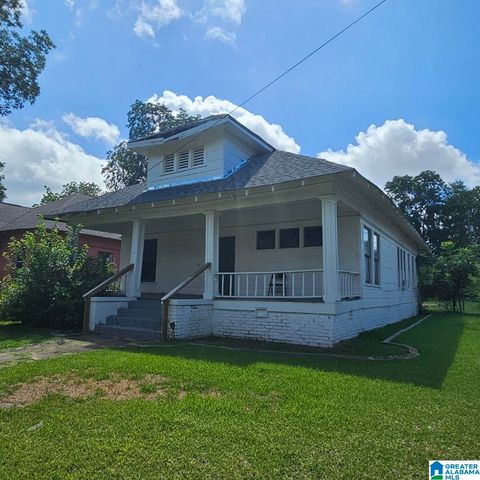
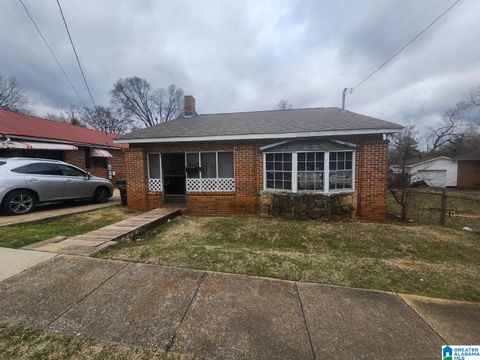
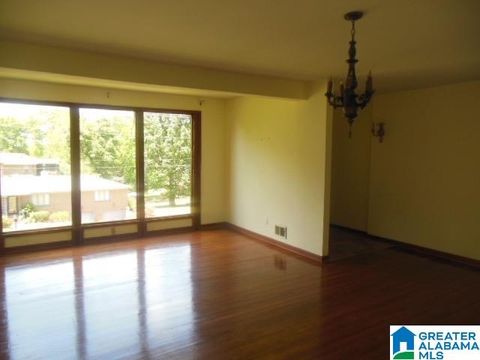
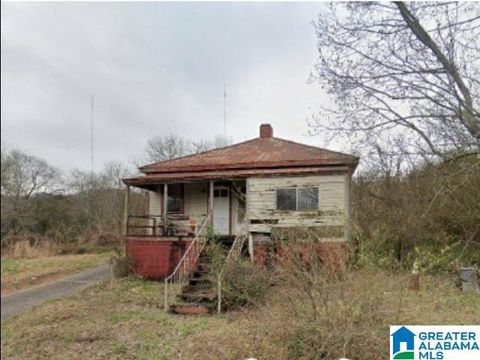
$74,900
3
bds
|
0
ba
|
1,662
sqft
|
built
1930
1443 Princeton Ave SW, Birmingham, AL 35211
$759
Cash flow
11.8%
Cash-on-Cash Return
12.2%
Cap rate
1.5%
Rent to Value Ratio
69 out of 71 properties for sale in 35211
Limited Results Shown
Create a free account, or log in to reveal all property listings and enjoy the complete experience.
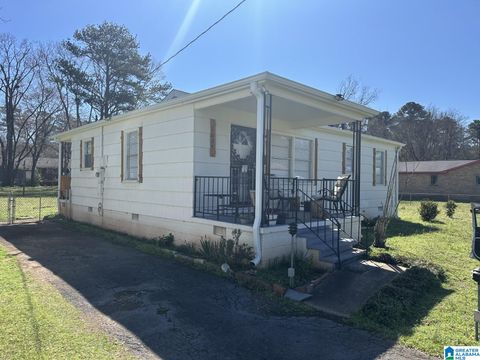
Active
$120,000
3
bds
|
0
ba
|
962
sqft
|
built
1955
1625 17th St SW, Birmingham, AL 35211
$-5
Cash flow
-0.2%
Cash-on-Cash Return
6.2%
Cap rate
0.8%
Rent to Value Ratio
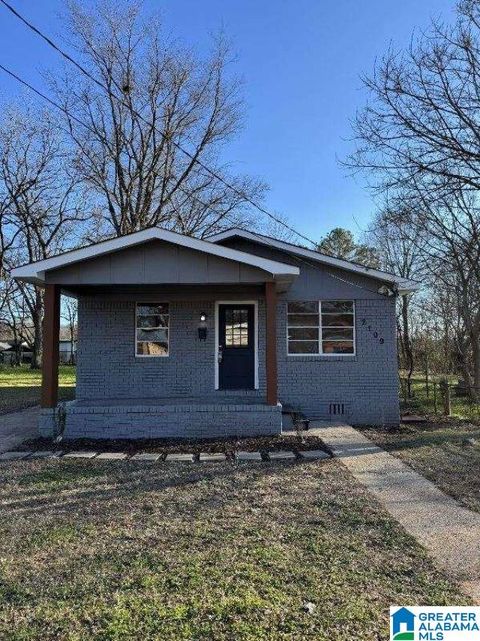
Active
$110,000
3
bds
|
0
ba
|
864
sqft
|
built
1950
2109 Powderly Ave SW, Birmingham, AL 35211
$185
Cash flow
8.8%
Cash-on-Cash Return
8.3%
Cap rate
1.0%
Rent to Value Ratio
Active
$144,000
4
bds
|
0
ba
|
1,980
sqft
|
built
1930
1124 15th Pl SW, Birmingham, AL 35211
$214
Cash flow
7.8%
Cash-on-Cash Return
8.1%
Cap rate
1.0%
Rent to Value Ratio

Active
$124,000
3
bds
|
0
ba
|
1,604
sqft
|
built
1925
1753 Lee Ave SW, Birmingham, AL 35211
$250
Cash flow
10.5%
Cash-on-Cash Return
8.7%
Cap rate
1.0%
Rent to Value Ratio
Active
$429,900
3
bds
|
0
ba
|
2,305
sqft
|
built
2022
3931 Sydney Dr, Birmingham, AL 35211
$-278
Cash flow
-3.4%
Cash-on-Cash Return
5.5%
Cap rate
0.7%
Rent to Value Ratio
Active
$158,000
3
bds
|
0
ba
|
1,120
sqft
|
built
1945
1130 16th St SW, Birmingham, AL 35211
$-135
Cash flow
-4.5%
Cash-on-Cash Return
5.2%
Cap rate
0.6%
Rent to Value Ratio

Active
$2,650,000
7
bds
|
0
ba
|
13,142
sqft
|
built
2012
2628 Wenonah Oxmoor Rd, Birmingham, AL 35211
$-11,075
Cash flow
-21.8%
Cash-on-Cash Return
1.2%
Cap rate
0.2%
Rent to Value Ratio
Active
$79,900
3
bds
|
0
ba
|
1,000
sqft
|
built
1950
1845 Henry Crumpton Dr, Birmingham, AL 35211
$273
Cash flow
17.8%
Cash-on-Cash Return
10.4%
Cap rate
1.3%
Rent to Value Ratio
Active
$275,000
7
bds
|
0
ba
|
2,652
sqft
|
built
1925
1731 Mims Ave SW, Birmingham, AL 35211
$-470
Cash flow
-8.9%
Cash-on-Cash Return
4.2%
Cap rate
0.5%
Rent to Value Ratio
Active
$90,000
5
bds
|
0
ba
|
1,953
sqft
|
built
1983
2446 College Ave SW, Birmingham, AL 35211
$496
Cash flow
28.8%
Cash-on-Cash Return
12.9%
Cap rate
1.6%
Rent to Value Ratio
Active
$50,000
2
bds
|
0
ba
|
738
sqft
|
built
1947
129 18th St SW, Birmingham, AL 35211
$690
Cash flow
16.1%
Cash-on-Cash Return
16.6%
Cap rate
2.0%
Rent to Value Ratio
Active
$420,000
4
bds
|
0
ba
|
2,654
sqft
|
built
2022
3905 Sydney Dr, Birmingham, AL 35211
$-54
Cash flow
-0.7%
Cash-on-Cash Return
6.1%
Cap rate
0.7%
Rent to Value Ratio

Active
$110,000
4
bds
|
0
ba
|
1,320
sqft
|
built
1955
1745 Grant Ave SW, Birmingham, AL 35211
$323
Cash flow
15.3%
Cash-on-Cash Return
9.8%
Cap rate
1.2%
Rent to Value Ratio

Active
$129,900
3
bds
|
0
ba
|
1,360
sqft
|
built
1947
208 23rd St SW, Birmingham, AL 35211
$150
Cash flow
6.0%
Cash-on-Cash Return
7.6%
Cap rate
0.9%
Rent to Value Ratio

Active
$95,000
2
bds
|
0
ba
|
672
sqft
|
built
1950
601 19th St SW, Birmingham, AL 35211
$125
Cash flow
6.9%
Cash-on-Cash Return
7.8%
Cap rate
0.9%
Rent to Value Ratio
Active
$210,000
4
bds
|
0
ba
|
2,294
sqft
|
built
1920
901 6th St SW, Birmingham, AL 35211
$284
Cash flow
7.1%
Cash-on-Cash Return
7.9%
Cap rate
1.0%
Rent to Value Ratio
Active
$159,900
4
bds
|
0
ba
|
2,146
sqft
|
built
1966
3109 Wenonah Rd SW, Birmingham, AL 35211
$131
Cash flow
4.3%
Cash-on-Cash Return
7.2%
Cap rate
0.9%
Rent to Value Ratio
Active
$35,000
3
bds
|
0
ba
|
1,253
sqft
|
built
1925
765 30th St SW, Birmingham, AL 35211
$690
Cash flow
23.0%
Cash-on-Cash Return
23.7%
Cap rate
2.9%
Rent to Value Ratio
Active
$105,000
3
bds
|
0
ba
|
782
sqft
|
built
1950
141 W Ann Dr SW, Birmingham, AL 35211
$211
Cash flow
10.5%
Cash-on-Cash Return
8.7%
Cap rate
1.0%
Rent to Value Ratio

Active
$186,000
3
bds
|
0
ba
|
1,336
sqft
|
built
1949
1245 16th St SW, Birmingham, AL 35211
$133
Cash flow
3.7%
Cash-on-Cash Return
7.1%
Cap rate
0.9%
Rent to Value Ratio
Active
$269,900
3
bds
|
0
ba
|
2,368
sqft
|
built
1958
825 Goldwire St SW, Birmingham, AL 35211
$-167
Cash flow
-3.2%
Cash-on-Cash Return
5.5%
Cap rate
0.7%
Rent to Value Ratio
Active
$159,900
3
bds
|
0
ba
|
1,420
sqft
|
built
1982
1317 16th St SW, Birmingham, AL 35211
$131
Cash flow
4.3%
Cash-on-Cash Return
7.2%
Cap rate
0.9%
Rent to Value Ratio
Active
$72,500
3
bds
|
0
ba
|
1,226
sqft
|
built
1925
1661 Lee Ave SW, Birmingham, AL 35211
$828
Cash flow
13.3%
Cash-on-Cash Return
13.7%
Cap rate
1.7%
Rent to Value Ratio
Active
$129,999
3
bds
|
0
ba
|
1,002
sqft
|
built
1953
1255 18th St SW, Birmingham, AL 35211
$149
Cash flow
6.0%
Cash-on-Cash Return
7.6%
Cap rate
0.9%
Rent to Value Ratio
Active
$159,900
4
bds
|
0
ba
|
1,898
sqft
|
built
1932
657 29th St SW, Birmingham, AL 35211
$131
Cash flow
4.3%
Cash-on-Cash Return
7.2%
Cap rate
0.9%
Rent to Value Ratio
Active
$107,000
3
bds
|
0
ba
|
3,596
sqft
|
built
1928
2337 Beulah Ave SW, Birmingham, AL 35211
$614
Cash flow
29.9%
Cash-on-Cash Return
13.2%
Cap rate
1.6%
Rent to Value Ratio
Active
$74,900
3
bds
|
0
ba
|
1,662
sqft
|
built
1930
1443 Princeton Ave SW, Birmingham, AL 35211
$759
Cash flow
11.8%
Cash-on-Cash Return
12.2%
Cap rate
1.5%
Rent to Value Ratio
Active
$19,500
2
bds
|
0
ba
|
1,062
sqft
|
built
1940
1625 Pine Ave SW, Birmingham, AL 35211
$621
Cash flow
37.1%
Cash-on-Cash Return
38.2%
Cap rate
4.6%
Rent to Value Ratio
Active
$19,000
3
bds
|
0
ba
|
992
sqft
|
built
1938
2920 Garrison Ave SW, Birmingham, AL 35211
$621
Cash flow
38.1%
Cash-on-Cash Return
39.2%
Cap rate
4.7%
Rent to Value Ratio