35242 Investment Properties for Sale
Browse homes for sale and investment properties in 35242. Refine your search by price, property type, or more.
Best cash flowing properties in 35242
Active
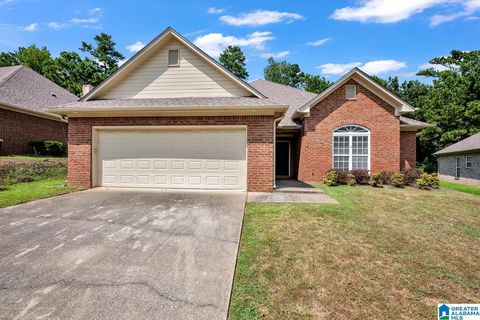
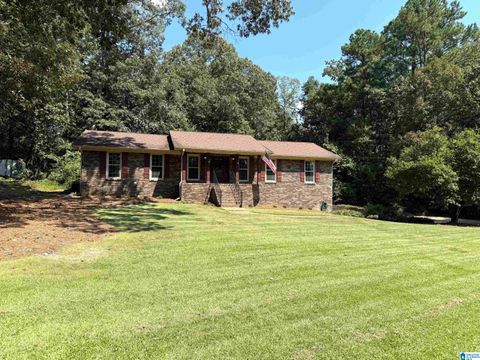
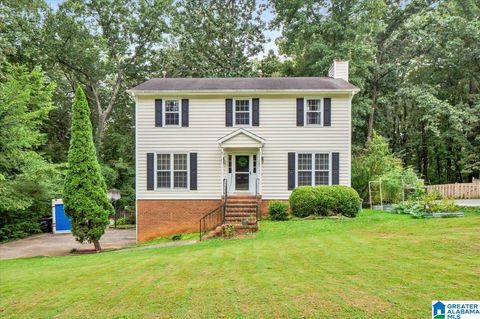
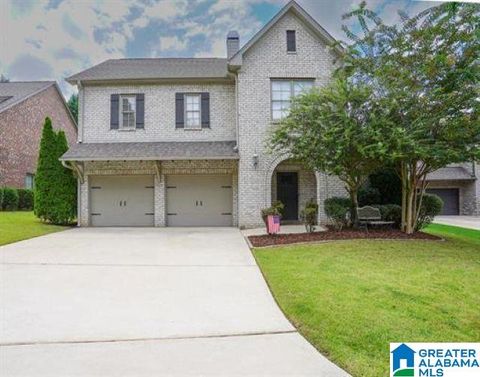
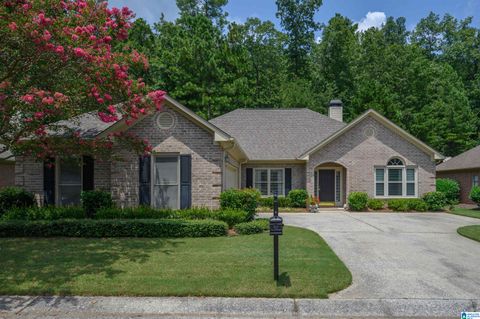
$319,000
3
bds
|
2
ba
|
1,775
sqft
|
built
2000
645 Narrows Point Way, Birmingham, AL 35242
$31
Cash flow
0.5%
Cash-on-Cash Return
5.8%
Cap rate
0.7%
Rent to Value Ratio
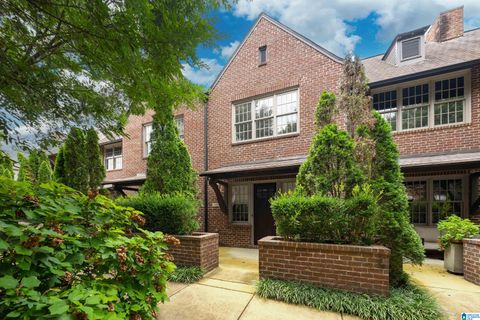
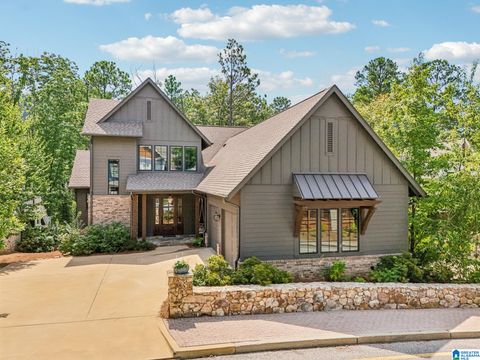
Active
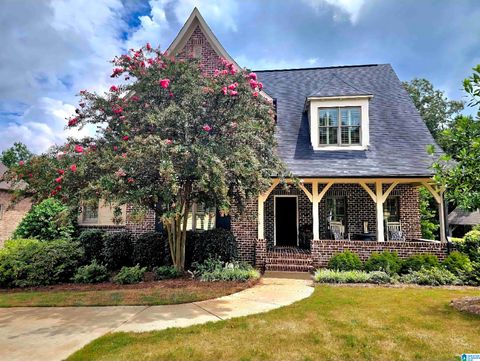
$319,000
2
bds
|
2.5
ba
|
1,666
sqft
|
built
2010
905 Barristers Ct, Birmingham, AL 35242
$8
Cash flow
0.1%
Cash-on-Cash Return
5.7%
Cap rate
0.7%
Rent to Value Ratio
128 out of 189 properties for sale in 35242
Limited Results Shown
Create a free account, or log in to reveal all property listings and enjoy the complete experience.
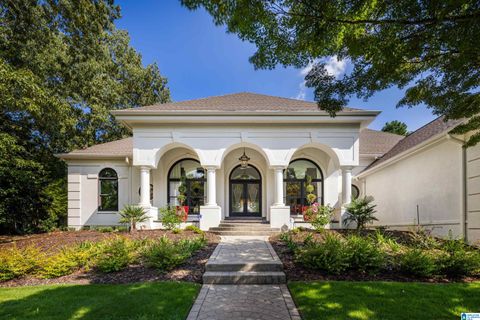
Active
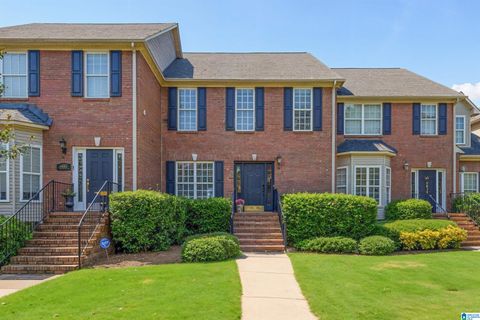
$2,190,000
4
bds
|
3.5
ba
|
4,171
sqft
|
built
1991
3525 Shandwick Pl, Birmingham, AL 35242
$-8,005
Cash flow
-19.1%
Cash-on-Cash Return
1.3%
Cap rate
0.2%
Rent to Value Ratio
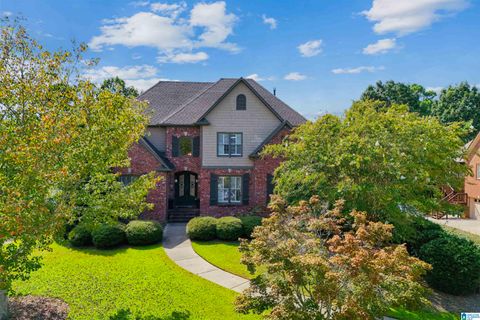
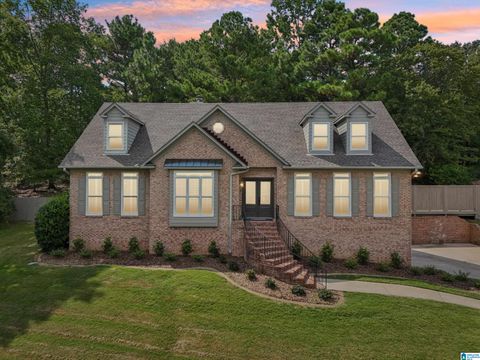
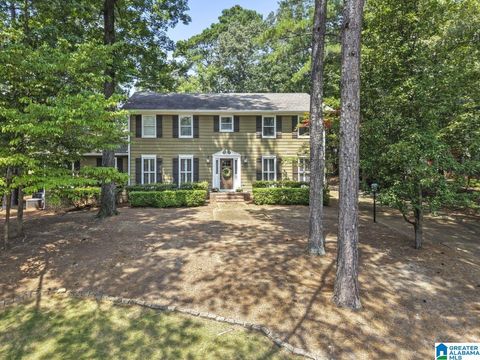
Active
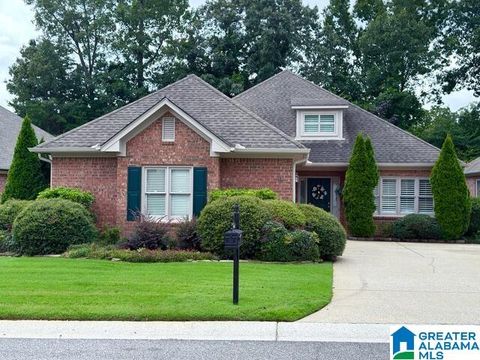
$650,000
4
bds
|
3.5
ba
|
2,790
sqft
|
built
2003
139 Salisbury Ln, Birmingham, AL 35242
$-765
Cash flow
-6.1%
Cash-on-Cash Return
4.3%
Cap rate
0.5%
Rent to Value Ratio
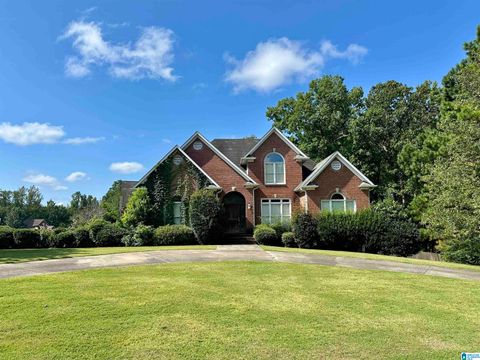
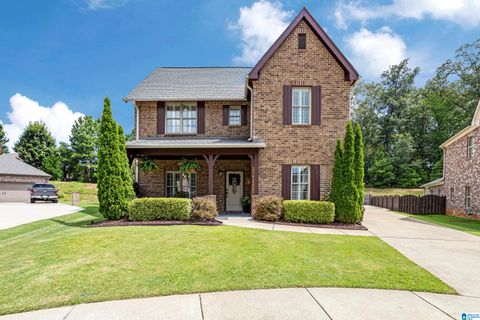
Active
$469,000
3
bds
|
3
ba
|
2,514
sqft
|
built
1979
5081 Pinehurst Ter, Birmingham, AL 35242
$-494
Cash flow
-5.5%
Cash-on-Cash Return
4.4%
Cap rate
0.5%
Rent to Value Ratio
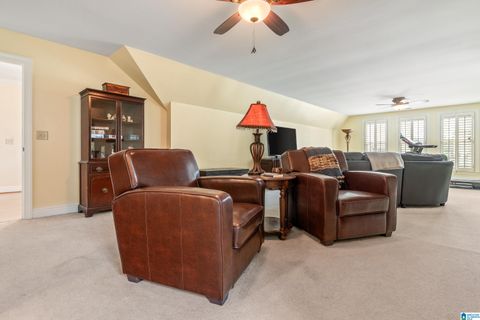
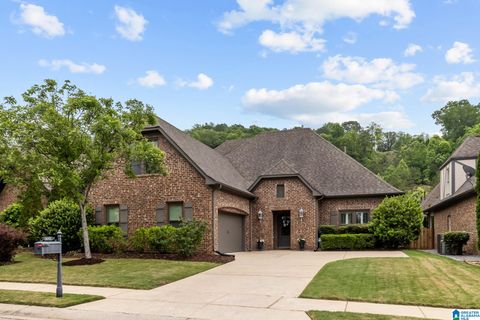
Active
$1,287,500
6
bds
|
5
ba
|
5,297
sqft
|
built
2020
104 Burnham St, Birmingham, AL 35242
$-2,302
Cash flow
-9.3%
Cash-on-Cash Return
3.5%
Cap rate
0.4%
Rent to Value Ratio
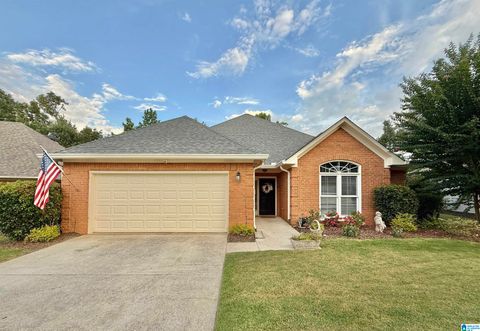
Active
$379,900
3
bds
|
2
ba
|
1,824
sqft
|
built
1996
6567 Mill Creek Cir, Hoover, AL 35242
$-148
Cash flow
-2.0%
Cash-on-Cash Return
5.2%
Cap rate
0.7%
Rent to Value Ratio
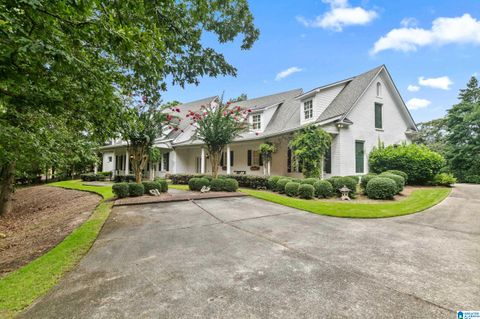
Active
$1,650,000
4
bds
|
5
ba
|
5,702
sqft
|
built
2000
1149 Greystone Crst, Hoover, AL 35242
$-5,575
Cash flow
-17.6%
Cash-on-Cash Return
1.6%
Cap rate
0.2%
Rent to Value Ratio
Active
$415,000
4
bds
|
3.5
ba
|
2,581
sqft
|
built
1985
5349 Harvest Ridge Ln, Birmingham, AL 35242
$-241
Cash flow
-3.0%
Cash-on-Cash Return
5.0%
Cap rate
0.6%
Rent to Value Ratio
Active
$872,000
5
bds
|
5
ba
|
3,871
sqft
|
built
2015
1104 Highland Village Trl, Birmingham, AL 35242
$-2,040
Cash flow
-12.2%
Cash-on-Cash Return
2.9%
Cap rate
0.4%
Rent to Value Ratio
Active
$344,900
3
bds
|
2.5
ba
|
2,146
sqft
|
built
2005
448 Meadow Croft Dr, Birmingham, AL 35242
$-112
Cash flow
-1.7%
Cash-on-Cash Return
5.3%
Cap rate
0.7%
Rent to Value Ratio
Active
$445,000
3
bds
|
2
ba
|
2,310
sqft
|
built
1997
4149 Guilford Rd, Hoover, AL 35242
$-456
Cash flow
-5.3%
Cash-on-Cash Return
4.4%
Cap rate
0.6%
Rent to Value Ratio
Active
$1,175,000
4
bds
|
5.5
ba
|
5,805
sqft
|
built
1996
2096 Brook Highland Rdg, Birmingham, AL 35242
$-2,820
Cash flow
-12.5%
Cash-on-Cash Return
2.8%
Cap rate
0.3%
Rent to Value Ratio
Active
$249,900
2
bds
|
2
ba
|
1,080
sqft
|
built
1983
2933 Riverwood Ter, Birmingham, AL 35242
$-79
Cash flow
-1.6%
Cash-on-Cash Return
5.3%
Cap rate
0.6%
Rent to Value Ratio
Active
$495,000
3
bds
|
2.5
ba
|
2,732
sqft
|
built
2005
4067 Highland Ridge Rd, Hoover, AL 35242
$-453
Cash flow
-4.8%
Cash-on-Cash Return
4.6%
Cap rate
0.6%
Rent to Value Ratio
Active
$1,399,500
5
bds
|
4.5
ba
|
7,891
sqft
|
built
1993
2119 Lake Heather Way, Birmingham, AL 35242
$-4,708
Cash flow
-17.6%
Cash-on-Cash Return
1.6%
Cap rate
0.3%
Rent to Value Ratio
Active
$510,000
4
bds
|
2.5
ba
|
2,561
sqft
|
built
2013
4632 Cotswold Ln, Birmingham, AL 35242
$-329
Cash flow
-3.4%
Cash-on-Cash Return
4.9%
Cap rate
0.6%
Rent to Value Ratio
Active
$635,000
4
bds
|
3.5
ba
|
3,474
sqft
|
built
1987
3028 Brookhill Dr, Birmingham, AL 35242
$-1,073
Cash flow
-8.8%
Cash-on-Cash Return
3.7%
Cap rate
0.4%
Rent to Value Ratio
Active
$487,000
5
bds
|
4.5
ba
|
3,362
sqft
|
built
1997
2000 Eagle Crest Ct, Birmingham, AL 35242
$-126
Cash flow
-1.3%
Cash-on-Cash Return
5.4%
Cap rate
0.7%
Rent to Value Ratio
Active
$589,900
4
bds
|
3.5
ba
|
3,559
sqft
|
built
2000
1148 Barkley Ln, Birmingham, AL 35242
$-398
Cash flow
-3.5%
Cash-on-Cash Return
4.9%
Cap rate
0.6%
Rent to Value Ratio
Active
$432,000
3
bds
|
2.5
ba
|
2,723
sqft
|
built
1985
5207 Harvest Ridge Ln, Birmingham, AL 35242
$-45
Cash flow
-0.5%
Cash-on-Cash Return
5.6%
Cap rate
0.7%
Rent to Value Ratio
Active
$750,000
4
bds
|
3.5
ba
|
3,211
sqft
|
built
2005
1535 Greystone Parc Cir, Birmingham, AL 35242
$-1,259
Cash flow
-8.8%
Cash-on-Cash Return
3.7%
Cap rate
0.5%
Rent to Value Ratio
Active
$385,000
4
bds
|
3
ba
|
2,132
sqft
|
built
1993
1804 Stone Brook Ln, Birmingham, AL 35242
$-124
Cash flow
-1.7%
Cash-on-Cash Return
5.3%
Cap rate
0.6%
Rent to Value Ratio
Active
$579,900
3
bds
|
2.5
ba
|
2,811
sqft
|
built
2009
3012 Regent Park Cir, Birmingham, AL 35242
$-918
Cash flow
-8.3%
Cash-on-Cash Return
3.8%
Cap rate
0.5%
Rent to Value Ratio
Active
$449,900
3
bds
|
2
ba
|
2,304
sqft
|
built
1995
208 Woodbridge Ln, Hoover, AL 35242
$-222
Cash flow
-2.6%
Cash-on-Cash Return
5.1%
Cap rate
0.6%
Rent to Value Ratio
Active
$535,000
5
bds
|
3.5
ba
|
3,516
sqft
|
built
1986
5032 Stone Bridge Ln, Birmingham, AL 35242
$-327
Cash flow
-3.2%
Cash-on-Cash Return
4.9%
Cap rate
0.6%
Rent to Value Ratio
Active
$499,000
3
bds
|
2.5
ba
|
1,872
sqft
|
built
1999
4905 Keith Dr, Birmingham, AL 35242
$-636
Cash flow
-6.6%
Cash-on-Cash Return
4.1%
Cap rate
0.5%
Rent to Value Ratio
Active
$2,599,000
6
bds
|
7
ba
|
9,714
sqft
|
built
2006
987 Garland Cv, Birmingham, AL 35242
$-10,013
Cash flow
-20.1%
Cash-on-Cash Return
1.1%
Cap rate
0.1%
Rent to Value Ratio
Active
$1,400,000
6
bds
|
5.5
ba
|
6,244
sqft
|
built
2001
416 Mc Cormack Way, Birmingham, AL 35242
$-3,239
Cash flow
-12.1%
Cash-on-Cash Return
2.9%
Cap rate
0.4%
Rent to Value Ratio
Active
$468,000
3
bds
|
2.5
ba
|
2,936
sqft
|
built
1984
3304 Sunny Meadows Ct, Birmingham, AL 35242
$-421
Cash flow
-4.7%
Cash-on-Cash Return
4.6%
Cap rate
0.6%
Rent to Value Ratio
Active
$575,000
4
bds
|
2.5
ba
|
2,123
sqft
|
built
2021
1034 Norman Dr, Birmingham, AL 35242
$-627
Cash flow
-5.7%
Cash-on-Cash Return
4.4%
Cap rate
0.6%
Rent to Value Ratio
Active
$789,999
5
bds
|
4
ba
|
4,653
sqft
|
built
1991
4227 Ashington Dr, Birmingham, AL 35242
$-1,063
Cash flow
-7.0%
Cash-on-Cash Return
4.1%
Cap rate
0.5%
Rent to Value Ratio
Active
$450,000
3
bds
|
2
ba
|
2,189
sqft
|
built
1999
633 N Lake Cir, Birmingham, AL 35242
$-513
Cash flow
-5.9%
Cash-on-Cash Return
4.3%
Cap rate
0.6%
Rent to Value Ratio
Active
$547,000
4
bds
|
3
ba
|
2,978
sqft
|
built
1979
5168 Kirkwall Ln, Birmingham, AL 35242
$-403
Cash flow
-3.8%
Cash-on-Cash Return
4.8%
Cap rate
0.6%
Rent to Value Ratio
Active
$724,900
5
bds
|
4
ba
|
3,221
sqft
|
built
2014
5016 Kelham Grove Cir, Birmingham, AL 35242
$-1,328
Cash flow
-9.6%
Cash-on-Cash Return
3.5%
Cap rate
0.4%
Rent to Value Ratio
Active
$499,900
3
bds
|
2.5
ba
|
2,560
sqft
|
built
2005
3057 Valley Ridge Rd, Birmingham, AL 35242
$-408
Cash flow
-4.3%
Cash-on-Cash Return
4.7%
Cap rate
0.6%
Rent to Value Ratio
Active
$685,000
5
bds
|
4.5
ba
|
5,290
sqft
|
built
1988
5501 Afton Dr, Birmingham, AL 35242
$-840
Cash flow
-6.4%
Cash-on-Cash Return
4.2%
Cap rate
0.5%
Rent to Value Ratio
Active
$649,900
3
bds
|
2.5
ba
|
2,577
sqft
|
built
2003
344 Woodward Ct, Birmingham, AL 35242
$-1,244
Cash flow
-10.0%
Cash-on-Cash Return
3.4%
Cap rate
0.5%
Rent to Value Ratio
Active
$285,000
2
bds
|
2.5
ba
|
1,539
sqft
|
built
1985
3051 Old Stone Dr, Birmingham, AL 35242
$-124
Cash flow
-2.3%
Cash-on-Cash Return
5.2%
Cap rate
0.6%
Rent to Value Ratio
Active
$775,000
5
bds
|
4.5
ba
|
4,152
sqft
|
built
2006
27 Nolen St, Birmingham, AL 35242
$-1,056
Cash flow
-7.1%
Cash-on-Cash Return
4.0%
Cap rate
0.5%
Rent to Value Ratio