38103 Investment Properties for Sale
Browse homes for sale and investment properties in 38103. Refine your search by price, property type, or more.
Best cash flowing properties in 38103
Active
$97,000
1
bds
|
1
ba
|
0
sqft
|
built
1924
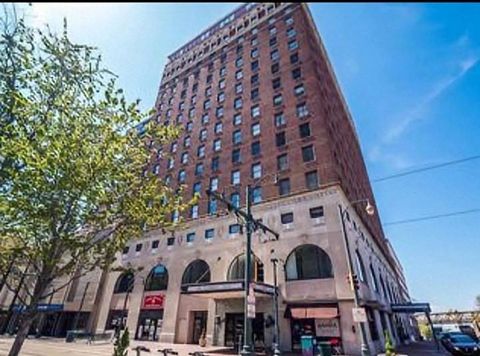
109 N Main St, Memphis, TN 38103
$266
Cash flow
14.3%
Cash-on-Cash Return
9.0%
Cap rate
1.2%
Rent to Value Ratio
Active
$165,000
1
bds
|
1
ba
|
0
sqft
|
built
1923
66 Monroe Ave, Memphis, TN 38103
$235
Cash flow
7.4%
Cash-on-Cash Return
7.4%
Cap rate
1.1%
Rent to Value Ratio
145 out of 154 properties for sale in 38103
Limited Results Shown
Create a free account, or log in to reveal all property listings and enjoy the complete experience.
Active
$185,000
1
bds
|
1
ba
|
0
sqft
|
built
1912
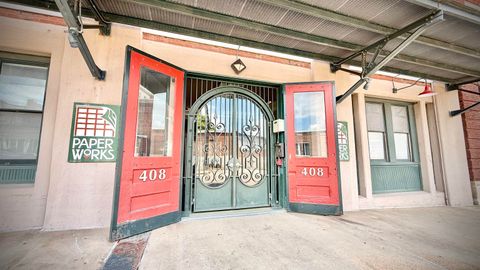
408 S Front St, Memphis, TN 38103
$-101
Cash flow
-2.8%
Cash-on-Cash Return
5.0%
Cap rate
0.8%
Rent to Value Ratio
Active
$165,000
1
bds
|
1
ba
|
0
sqft
|
built
1909
245 Madison Ave, Memphis, TN 38103
$109
Cash flow
3.4%
Cash-on-Cash Return
6.5%
Cap rate
1.0%
Rent to Value Ratio
Active
$345,000
3
bds
|
2.1
ba
|
0
sqft
|
built
2005
1390 Island Pl E, Memphis, TN 38103
$-555
Cash flow
-8.4%
Cash-on-Cash Return
3.7%
Cap rate
0.7%
Rent to Value Ratio
Active
$199,000
1
bds
|
1
ba
|
0
sqft
|
built
1910
420 S Front St, Memphis, TN 38103
$49
Cash flow
1.3%
Cash-on-Cash Return
6.0%
Cap rate
0.9%
Rent to Value Ratio
Active
$725,000
4
bds
|
5
ba
|
3,000
sqft
|
built
2021
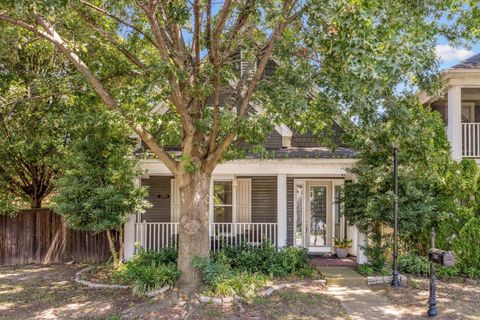
93 Toulouse St, Memphis, TN 38103
$-1,198
Cash flow
-8.6%
Cash-on-Cash Return
3.7%
Cap rate
0.6%
Rent to Value Ratio
Active
$296,000
2
bds
|
2
ba
|
0
sqft
|
built
1932
648 S Riverside Dr, Memphis, TN 38103
$-230
Cash flow
-4.1%
Cash-on-Cash Return
4.7%
Cap rate
0.7%
Rent to Value Ratio
Active
$365,000
3
bds
|
2.1
ba
|
0
sqft
|
built
2005
1250 Island Pl E, Memphis, TN 38103
$-513
Cash flow
-7.3%
Cash-on-Cash Return
4.0%
Cap rate
0.7%
Rent to Value Ratio
Active
$419,000
3
bds
|
2.1
ba
|
0
sqft
|
built
2004
275 Island Village Dr, Memphis, TN 38103
$-689
Cash flow
-8.6%
Cash-on-Cash Return
3.7%
Cap rate
0.6%
Rent to Value Ratio
Active
$715,000
4
bds
|
4
ba
|
0
sqft
|
built
1996
129 Running River Pl, Memphis, TN 38103
$-2,288
Cash flow
-16.7%
Cash-on-Cash Return
1.8%
Cap rate
0.4%
Rent to Value Ratio
Active
$525,000
3
bds
|
3
ba
|
0
sqft
|
built
2001
954 River Landing Dr, Memphis, TN 38103
$-1,182
Cash flow
-11.7%
Cash-on-Cash Return
3.0%
Cap rate
0.5%
Rent to Value Ratio
Active
$256,900
2
bds
|
2.1
ba
|
0
sqft
|
built
2007
665 Tennessee St, Memphis, TN 38103
$-134
Cash flow
-2.7%
Cash-on-Cash Return
5.1%
Cap rate
0.8%
Rent to Value Ratio
Active
$285,000
2
bds
|
2
ba
|
0
sqft
|
built
2007
665 Tennessee St, Memphis, TN 38103
$-346
Cash flow
-6.3%
Cash-on-Cash Return
4.2%
Cap rate
0.7%
Rent to Value Ratio
Active
$675,000
4
bds
|
4
ba
|
0
sqft
|
built
1992
754 Island Dr, Memphis, TN 38103
$-1,189
Cash flow
-9.2%
Cash-on-Cash Return
3.6%
Cap rate
0.6%
Rent to Value Ratio
Active
$259,900
2
bds
|
2
ba
|
0
sqft
|
built
1983
200 Wagner Pl, Memphis, TN 38103
$-382
Cash flow
-7.7%
Cash-on-Cash Return
3.9%
Cap rate
0.7%
Rent to Value Ratio
Active
$289,900
2
bds
|
2
ba
|
0
sqft
|
built
2002
600 S Main St, Memphis, TN 38103
$-241
Cash flow
-4.3%
Cash-on-Cash Return
4.7%
Cap rate
0.7%
Rent to Value Ratio
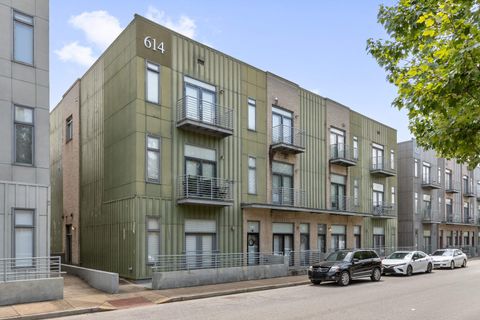
Active
$415,000
3
bds
|
2.5
ba
|
0
sqft
|
built
2005
614 Tennessee St, Memphis, TN 38103
$-581
Cash flow
-7.3%
Cash-on-Cash Return
4.0%
Cap rate
0.6%
Rent to Value Ratio
Active
$285,000
2
bds
|
2.5
ba
|
0
sqft
|
built
2007
75 Shoemaker Ct, Memphis, TN 38103
$-285
Cash flow
-5.2%
Cash-on-Cash Return
4.5%
Cap rate
0.7%
Rent to Value Ratio
Active
$259,000
1
bds
|
1.5
ba
|
0
sqft
|
built
2007
379 Cobalt Bay Loop, Memphis, TN 38103
$-200
Cash flow
-4.0%
Cash-on-Cash Return
4.8%
Cap rate
0.8%
Rent to Value Ratio
Active
$175,000
1
bds
|
1
ba
|
0
sqft
|
built
2006
655 S Riverside Dr, Memphis, TN 38103
$66
Cash flow
2.0%
Cash-on-Cash Return
6.1%
Cap rate
0.9%
Rent to Value Ratio
Active
$299,900
2
bds
|
2
ba
|
0
sqft
|
built
2006
113 Harbor Town Sq, Memphis, TN 38103
$-330
Cash flow
-5.7%
Cash-on-Cash Return
4.4%
Cap rate
0.7%
Rent to Value Ratio
Active
$117,000
1
bds
|
1
ba
|
0
sqft
|
built
1927
109 N Main St, Memphis, TN 38103
$50
Cash flow
2.2%
Cash-on-Cash Return
6.2%
Cap rate
0.9%
Rent to Value Ratio
Active
$589,000
3
bds
|
2.1
ba
|
0
sqft
|
built
2007
717 S Riverside Dr, Memphis, TN 38103
$-852
Cash flow
-7.5%
Cash-on-Cash Return
3.9%
Cap rate
0.6%
Rent to Value Ratio
Active
$395,000
3
bds
|
2.1
ba
|
0
sqft
|
built
2005
1319 Island Pl E, Memphis, TN 38103
$-656
Cash flow
-8.7%
Cash-on-Cash Return
3.7%
Cap rate
0.6%
Rent to Value Ratio
Active
$359,000
2
bds
|
2
ba
|
0
sqft
|
built
1998
1066 Island Pl E, Memphis, TN 38103
$-459
Cash flow
-6.7%
Cash-on-Cash Return
4.1%
Cap rate
0.6%
Rent to Value Ratio
Active
$425,000
1
bds
|
1
ba
|
0
sqft
|
built
1909
505 Tennessee St, Memphis, TN 38103
$-979
Cash flow
-12.0%
Cash-on-Cash Return
2.9%
Cap rate
0.5%
Rent to Value Ratio
Active
$149,900
1
bds
|
1
ba
|
0
sqft
|
built
1923
66 Monroe Ave, Memphis, TN 38103
$-3
Cash flow
-0.1%
Cash-on-Cash Return
5.7%
Cap rate
0.9%
Rent to Value Ratio
Active
$239,000
1
bds
|
1.1
ba
|
0
sqft
|
built
1947
415 S Front St, Memphis, TN 38103
$-47
Cash flow
-1.0%
Cash-on-Cash Return
5.4%
Cap rate
0.8%
Rent to Value Ratio
Active
$465,000
3
bds
|
3
ba
|
0
sqft
|
built
1995
1017 Island Park Cir, Memphis, TN 38103
$-727
Cash flow
-8.2%
Cash-on-Cash Return
3.8%
Cap rate
0.7%
Rent to Value Ratio
Active
$213,000
1
bds
|
1
ba
|
0
sqft
|
built
1983
200 Wagner Pl, Memphis, TN 38103
$-225
Cash flow
-5.5%
Cash-on-Cash Return
4.4%
Cap rate
0.8%
Rent to Value Ratio
Active
$250,000
2
bds
|
2.1
ba
|
0
sqft
|
built
2006
79 Shoemaker Ct, Memphis, TN 38103
$-125
Cash flow
-2.6%
Cash-on-Cash Return
5.1%
Cap rate
0.8%
Rent to Value Ratio
Active
$249,900
2
bds
|
2
ba
|
0
sqft
|
built
1983
200 Wagner Pl, Memphis, TN 38103
$-59
Cash flow
-1.2%
Cash-on-Cash Return
5.4%
Cap rate
0.9%
Rent to Value Ratio
Active
$449,000
2
bds
|
2
ba
|
0
sqft
|
built
1915
262 Wagner Pl, Memphis, TN 38103
$-458
Cash flow
-5.3%
Cash-on-Cash Return
4.5%
Cap rate
0.6%
Rent to Value Ratio
Active
$320,000
2
bds
|
2
ba
|
0
sqft
|
built
2002
139 Harbor Creek Dr, Memphis, TN 38103
$-358
Cash flow
-5.8%
Cash-on-Cash Return
4.3%
Cap rate
0.7%
Rent to Value Ratio
Active
$105,000
1
bds
|
1
ba
|
0
sqft
|
built
1926
109 N Main St, Memphis, TN 38103
$95
Cash flow
4.7%
Cash-on-Cash Return
6.8%
Cap rate
1.0%
Rent to Value Ratio
Active
$185,000
1
bds
|
1.1
ba
|
0
sqft
|
built
2007
92 S Main St, Memphis, TN 38103
$-36
Cash flow
-1.0%
Cash-on-Cash Return
5.4%
Cap rate
0.9%
Rent to Value Ratio
Active
$199,900
2
bds
|
2
ba
|
0
sqft
|
built
1926
109 N Main St, Memphis, TN 38103
$218
Cash flow
5.7%
Cash-on-Cash Return
7.0%
Cap rate
1.0%
Rent to Value Ratio
Active
$155,000
1
bds
|
1
ba
|
0
sqft
|
built
1923
66 Monroe Ave, Memphis, TN 38103
$-25
Cash flow
-0.8%
Cash-on-Cash Return
5.5%
Cap rate
0.8%
Rent to Value Ratio
Active
$1,280,000
4
bds
|
4.1
ba
|
0
sqft
|
built
2006
511 Monteigne Blvd, Memphis, TN 38103
$-4,657
Cash flow
-19.0%
Cash-on-Cash Return
1.3%
Cap rate
0.3%
Rent to Value Ratio