38104 Investment Properties for Sale
Browse homes for sale and investment properties in 38104. Refine your search by price, property type, or more.
Best cash flowing properties in 38104
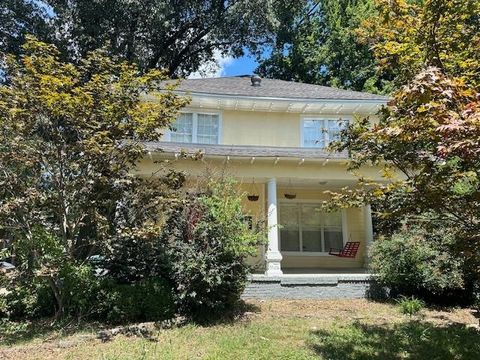
Active
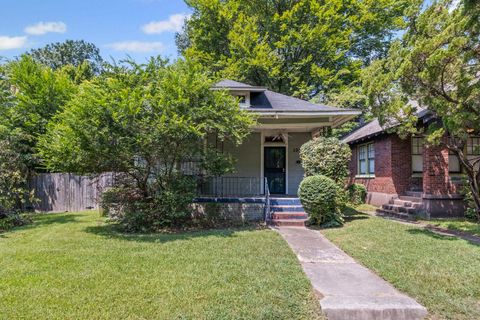
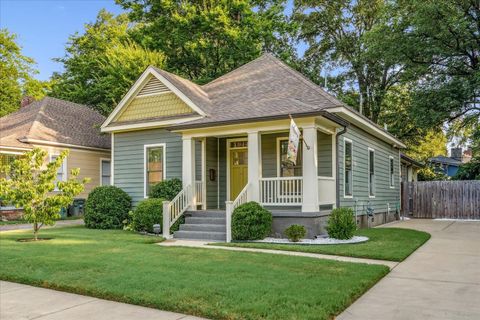
$129,000
2
bds
|
1
ba
|
0
sqft
|
built
1912
1035 Tanglewood St, Memphis, TN 38104
$335
Cash flow
13.5%
Cash-on-Cash Return
8.8%
Cap rate
1.3%
Rent to Value Ratio
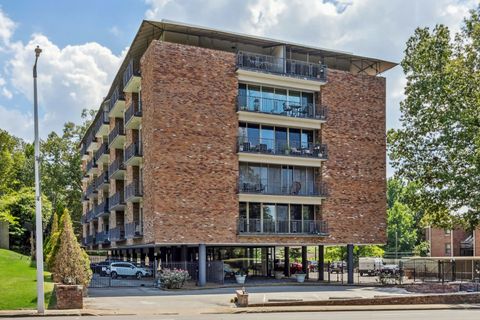
Active
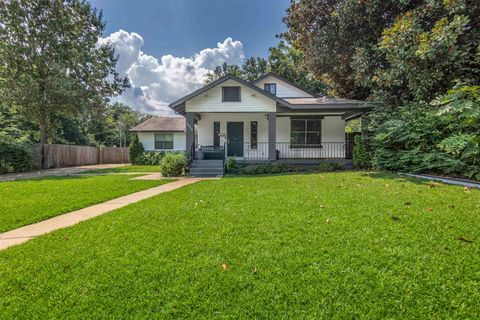
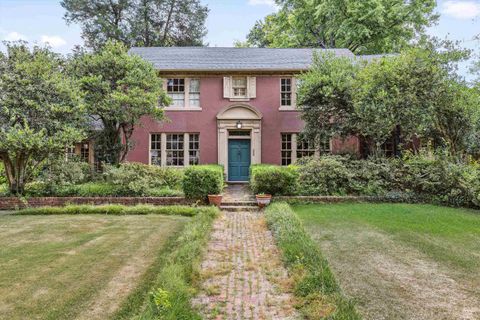
$249,000
5
bds
|
3
ba
|
0
sqft
|
built
1935
1255 Faxon Ave, Memphis, TN 38104
$182
Cash flow
3.8%
Cash-on-Cash Return
6.6%
Cap rate
0.9%
Rent to Value Ratio
143 out of 155 properties for sale in 38104
Limited Results Shown
Create a free account, or log in to reveal all property listings and enjoy the complete experience.
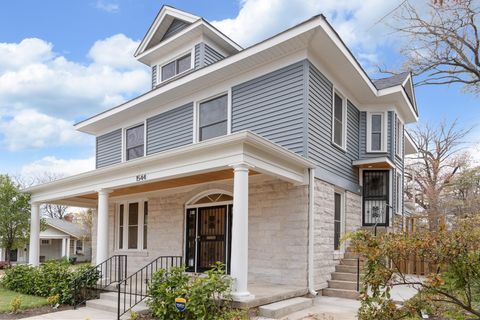
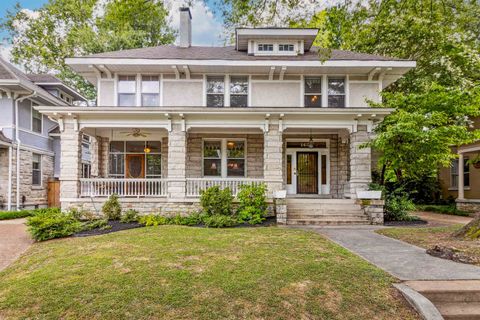
Active
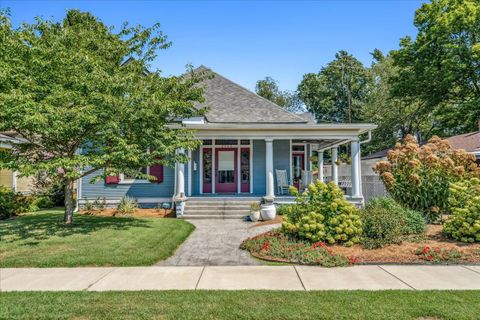
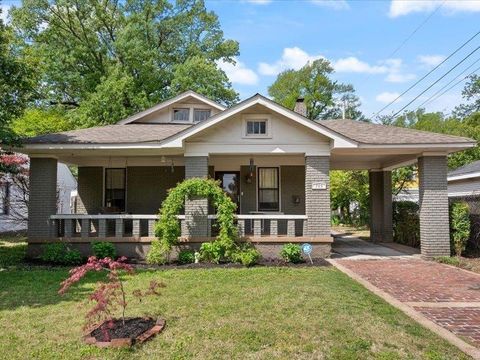
$390,000
3
bds
|
2
ba
|
0
sqft
|
built
1922
2082 Oliver Ave, Memphis, TN 38104
$-350
Cash flow
-4.7%
Cash-on-Cash Return
4.6%
Cap rate
0.7%
Rent to Value Ratio
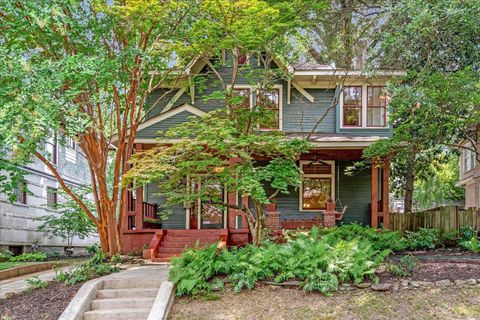
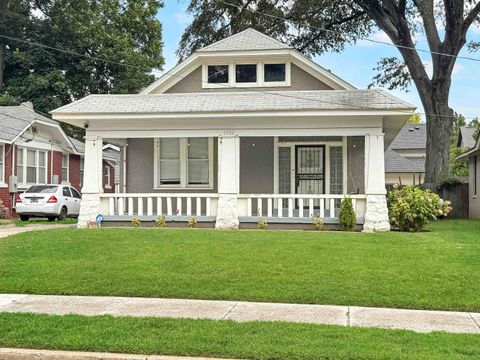
Active
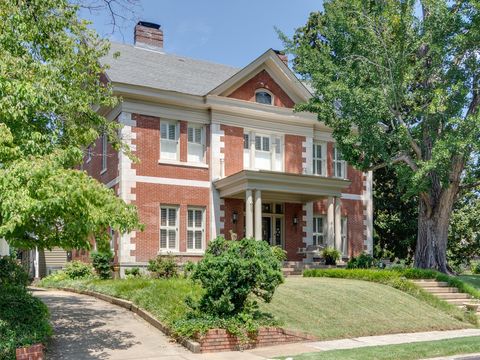
$850,000
4
bds
|
2.1
ba
|
0
sqft
|
built
1900
1544 Vinton Ave, Memphis, TN 38104
$-2,208
Cash flow
-13.6%
Cash-on-Cash Return
2.6%
Cap rate
0.5%
Rent to Value Ratio
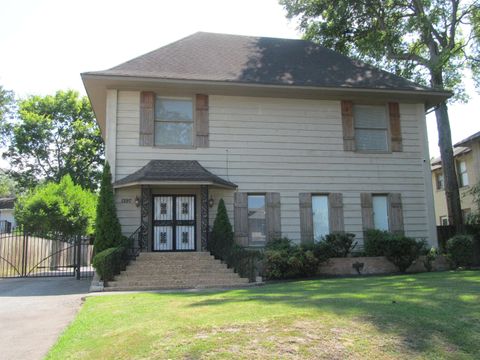
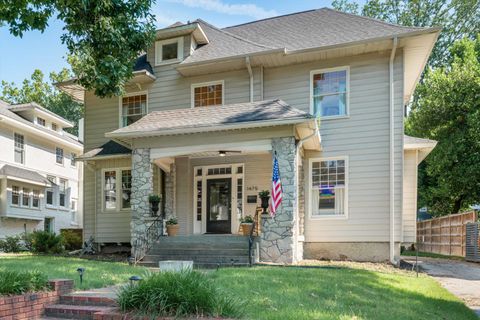
Active
$399,000
5
bds
|
4
ba
|
0
sqft
|
built
1900
1297 Peabody Ave, Memphis, TN 38104
$-580
Cash flow
-7.6%
Cash-on-Cash Return
3.9%
Cap rate
0.6%
Rent to Value Ratio
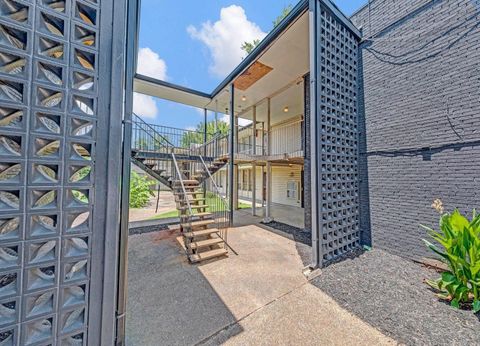
Active
$385,000
4
bds
|
2
ba
|
0
sqft
|
built
1920
1808 Linden Ave, Memphis, TN 38104
$-726
Cash flow
-9.8%
Cash-on-Cash Return
3.4%
Cap rate
0.6%
Rent to Value Ratio
Active
$225,000
2
bds
|
2.1
ba
|
0
sqft
|
built
1990
1993 Eastend Dr, Memphis, TN 38104
$46
Cash flow
1.1%
Cash-on-Cash Return
5.9%
Cap rate
0.9%
Rent to Value Ratio
Active
$595,000
4
bds
|
3.1
ba
|
0
sqft
|
built
1917
1789 Linden Ave, Memphis, TN 38104
$-1,488
Cash flow
-13.0%
Cash-on-Cash Return
2.7%
Cap rate
0.5%
Rent to Value Ratio
Active
$525,000
6
bds
|
4
ba
|
0
sqft
|
built
1915
1464 Peabody Ave, Memphis, TN 38104
$-1,790
Cash flow
-17.8%
Cash-on-Cash Return
1.6%
Cap rate
0.4%
Rent to Value Ratio
Active
$155,000
1
bds
|
1
ba
|
0
sqft
|
built
1982
10 S Idlewild St, Memphis, TN 38104
$119
Cash flow
4.0%
Cash-on-Cash Return
6.6%
Cap rate
0.9%
Rent to Value Ratio
Active
$269,000
2
bds
|
2.1
ba
|
0
sqft
|
built
2020
1619 Monroe Ave, Memphis, TN 38104
$-243
Cash flow
-4.7%
Cash-on-Cash Return
4.6%
Cap rate
0.7%
Rent to Value Ratio
Active
$499,000
3
bds
|
4
ba
|
0
sqft
|
built
1901
2228 Oliver Ave, Memphis, TN 38104
$-823
Cash flow
-8.6%
Cash-on-Cash Return
3.7%
Cap rate
0.5%
Rent to Value Ratio
Active
$400,000
4
bds
|
2.1
ba
|
0
sqft
|
built
1912
1595 Vinton Ave, Memphis, TN 38104
$-353
Cash flow
-4.6%
Cash-on-Cash Return
4.6%
Cap rate
0.8%
Rent to Value Ratio
Active
$440,000
3
bds
|
3
ba
|
0
sqft
|
built
1939
2238 Washington Ave, Memphis, TN 38104
$-499
Cash flow
-5.9%
Cash-on-Cash Return
4.3%
Cap rate
0.7%
Rent to Value Ratio
Active
$399,900
4
bds
|
2
ba
|
0
sqft
|
built
1917
1757 Vinton Ave, Memphis, TN 38104
$-1,015
Cash flow
-13.2%
Cash-on-Cash Return
2.6%
Cap rate
0.5%
Rent to Value Ratio
Active
$349,000
7
bds
|
3.1
ba
|
0
sqft
|
built
1926
1154 Central Ave, Memphis, TN 38104
$-400
Cash flow
-6.0%
Cash-on-Cash Return
4.3%
Cap rate
0.6%
Rent to Value Ratio
Active
$550,000
4
bds
|
3.5
ba
|
0
sqft
|
built
1912
1373 Peabody Ave, Memphis, TN 38104
$-1,440
Cash flow
-13.7%
Cash-on-Cash Return
2.5%
Cap rate
0.5%
Rent to Value Ratio
Active
$425,000
4
bds
|
3
ba
|
0
sqft
|
built
2005
258 S Mc Lean Blvd, Memphis, TN 38104
$-502
Cash flow
-6.2%
Cash-on-Cash Return
4.3%
Cap rate
0.7%
Rent to Value Ratio
Active
$195,900
2
bds
|
1
ba
|
0
sqft
|
built
1912
2197 Cowden Ave, Memphis, TN 38104
$35
Cash flow
0.9%
Cash-on-Cash Return
5.9%
Cap rate
0.9%
Rent to Value Ratio
Active
$324,900
3
bds
|
2
ba
|
0
sqft
|
built
1910
519 Summitt St, Memphis, TN 38104
$-378
Cash flow
-6.1%
Cash-on-Cash Return
4.3%
Cap rate
0.7%
Rent to Value Ratio
Active
$408,000
4
bds
|
2.5
ba
|
0
sqft
|
built
1911
1429 Vinton Ave, Memphis, TN 38104
$-650
Cash flow
-8.3%
Cash-on-Cash Return
3.8%
Cap rate
0.6%
Rent to Value Ratio
Active
$549,000
4
bds
|
2.5
ba
|
0
sqft
|
built
1912
1475 Carr Ave, Memphis, TN 38104
$-248
Cash flow
-2.4%
Cash-on-Cash Return
5.1%
Cap rate
0.8%
Rent to Value Ratio

Active
$178,000
2
bds
|
1
ba
|
0
sqft
|
built
1963
45 N Belvedere Blvd, Memphis, TN 38104
$-220
Cash flow
-6.4%
Cash-on-Cash Return
4.2%
Cap rate
0.6%
Rent to Value Ratio
Active
$178,000
2
bds
|
1
ba
|
0
sqft
|
built
1963
151 N Belvedere Blvd, Memphis, TN 38104
$-215
Cash flow
-6.3%
Cash-on-Cash Return
4.2%
Cap rate
0.6%
Rent to Value Ratio
Active
$599,999
5
bds
|
3
ba
|
0
sqft
|
built
1912
1544 Court Ave, Memphis, TN 38104
$-240
Cash flow
-2.1%
Cash-on-Cash Return
5.2%
Cap rate
0.8%
Rent to Value Ratio
Active
$1,275,000
5
bds
|
4.3
ba
|
0
sqft
|
built
1920
2221 Poplar Ave, Memphis, TN 38104
$-4,017
Cash flow
-16.4%
Cash-on-Cash Return
1.9%
Cap rate
0.4%
Rent to Value Ratio
Active
$349,900
3
bds
|
2
ba
|
0
sqft
|
built
1920
1944 Felix Ave, Memphis, TN 38104
$-482
Cash flow
-7.2%
Cash-on-Cash Return
4.0%
Cap rate
0.7%
Rent to Value Ratio
Active
$699,000
3
bds
|
2.1
ba
|
0
sqft
|
built
1930
532 S Belvedere Blvd, Memphis, TN 38104
$-1,757
Cash flow
-13.1%
Cash-on-Cash Return
2.7%
Cap rate
0.5%
Rent to Value Ratio
Active
$320,000
2
bds
|
2
ba
|
0
sqft
|
built
1924
793 Rozelle St, Memphis, TN 38104
$-616
Cash flow
-10.0%
Cash-on-Cash Return
3.4%
Cap rate
0.6%
Rent to Value Ratio
Active
$250,000
2
bds
|
2
ba
|
0
sqft
|
built
1917
1999 Peabody Ave, Memphis, TN 38104
$-196
Cash flow
-4.1%
Cash-on-Cash Return
4.7%
Cap rate
0.7%
Rent to Value Ratio
Active
$160,000
2
bds
|
2
ba
|
0
sqft
|
built
1962
2277 Union Ave, Memphis, TN 38104
$-55
Cash flow
-1.8%
Cash-on-Cash Return
5.3%
Cap rate
0.8%
Rent to Value Ratio
Active
$274,900
2
bds
|
1
ba
|
0
sqft
|
built
1912
771 Metcalf Pl, Memphis, TN 38104
$-371
Cash flow
-7.0%
Cash-on-Cash Return
4.1%
Cap rate
0.7%
Rent to Value Ratio
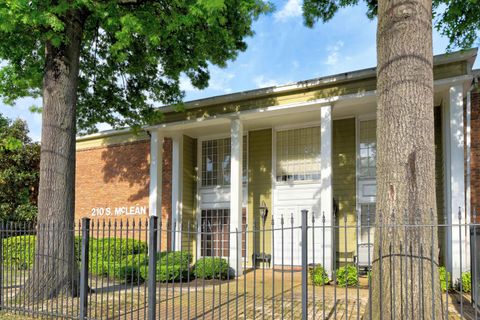
Active
$144,900
2
bds
|
2
ba
|
0
sqft
|
built
1964
210 S Mc Lean Blvd, Memphis, TN 38104
$-1
Cash flow
0.0%
Cash-on-Cash Return
5.7%
Cap rate
1.0%
Rent to Value Ratio
Active
$299,900
4
bds
|
2.1
ba
|
0
sqft
|
built
1912
1962 Walker Ave, Memphis, TN 38104
$-228
Cash flow
-4.0%
Cash-on-Cash Return
4.8%
Cap rate
0.8%
Rent to Value Ratio
Active
$205,000
2
bds
|
2
ba
|
0
sqft
|
built
1965
2195 Poplar Ave, Memphis, TN 38104
$-124
Cash flow
-3.2%
Cash-on-Cash Return
5.0%
Cap rate
0.8%
Rent to Value Ratio
Active
$459,000
4
bds
|
1.2
ba
|
0
sqft
|
built
1904
1431 Carr Ave, Memphis, TN 38104
$-574
Cash flow
-6.5%
Cash-on-Cash Return
4.2%
Cap rate
0.7%
Rent to Value Ratio
Active
$269,900
3
bds
|
1
ba
|
0
sqft
|
built
1920
1962 Evelyn Ave, Memphis, TN 38104
$-104
Cash flow
-2.0%
Cash-on-Cash Return
5.2%
Cap rate
0.8%
Rent to Value Ratio
Active
$580,000
3
bds
|
3.1
ba
|
0
sqft
|
built
2021
2020 Elzey Ave, Memphis, TN 38104
$-892
Cash flow
-8.0%
Cash-on-Cash Return
3.8%
Cap rate
0.6%
Rent to Value Ratio
Active
$300,000
5
bds
|
2
ba
|
0
sqft
|
built
1922
1971 Vinton Ave, Memphis, TN 38104
$-359
Cash flow
-6.2%
Cash-on-Cash Return
4.2%
Cap rate
0.7%
Rent to Value Ratio
Active
$606,000
4
bds
|
2.1
ba
|
0
sqft
|
built
1910
1630 Carr Ave, Memphis, TN 38104
$-886
Cash flow
-7.6%
Cash-on-Cash Return
3.9%
Cap rate
0.6%
Rent to Value Ratio