38106 Investment Properties for Sale
Browse homes for sale and investment properties in 38106. Refine your search by price, property type, or more.
Best cash flowing properties in 38106
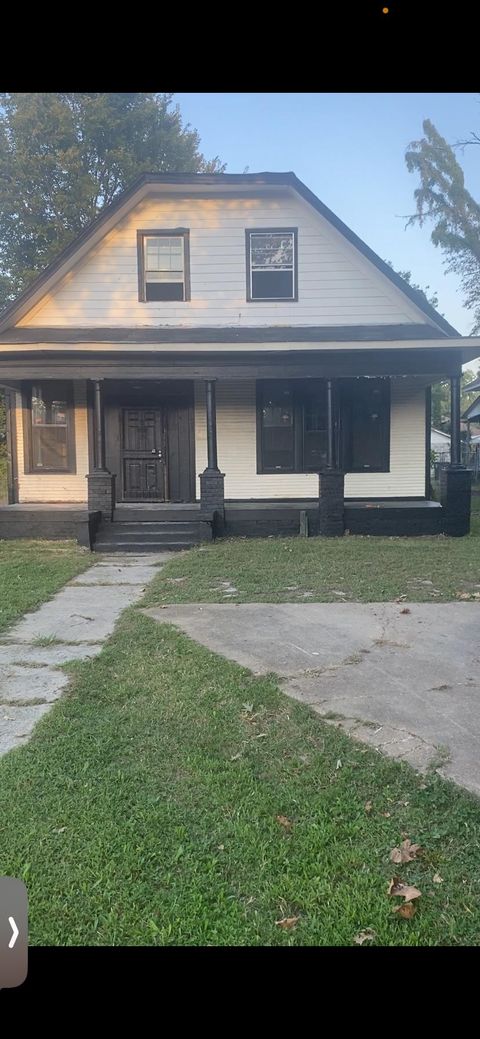
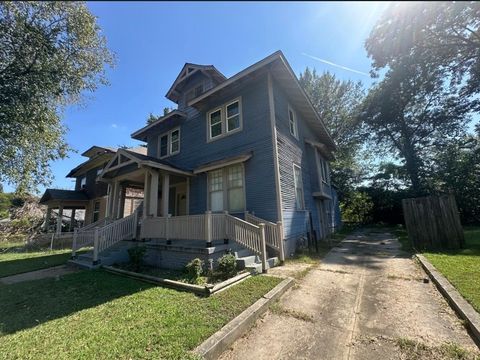
Active
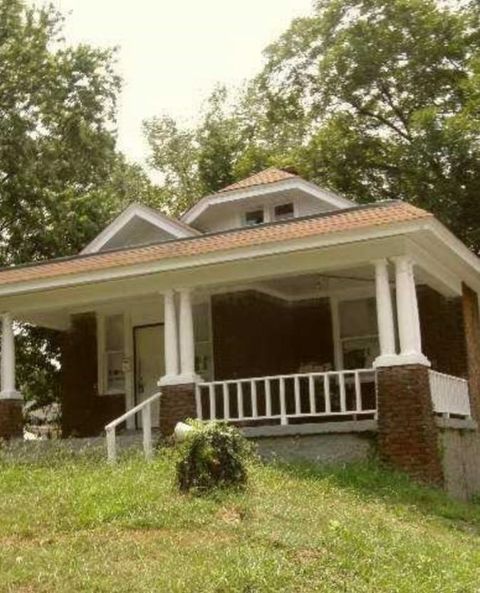
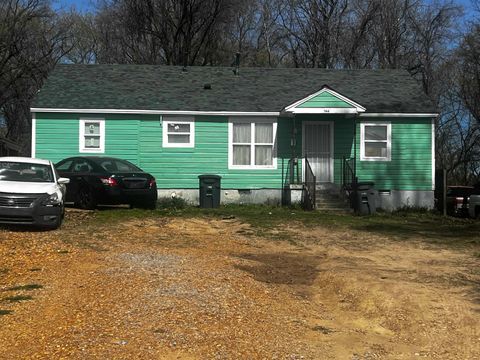
$50,000
8
bds
|
3
ba
|
0
sqft
|
built
1911
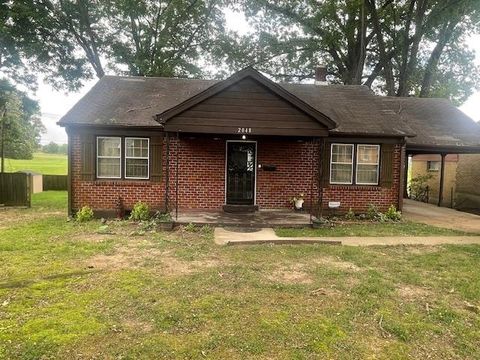
1400 S Lauderdale St, Memphis, TN 38106
$1,102
Cash flow
25.7%
Cash-on-Cash Return
26.4%
Cap rate
3.4%
Rent to Value Ratio
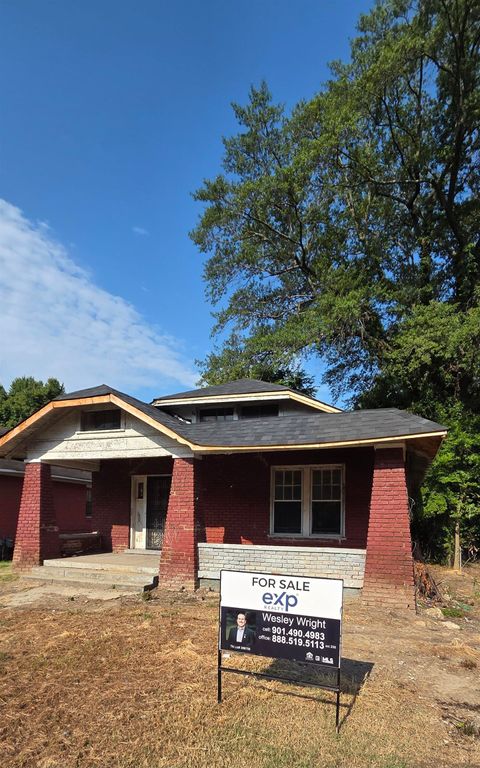
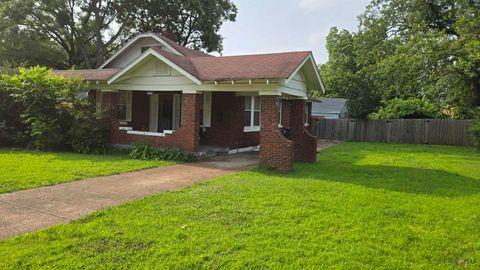
Active
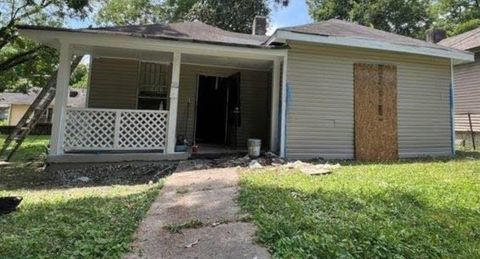
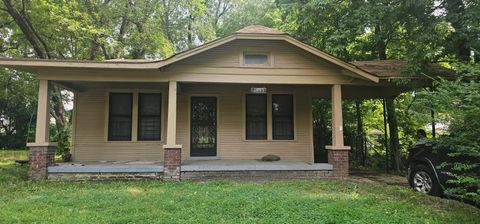
$50,000
2
bds
|
1
ba
|
0
sqft
|
built
1925
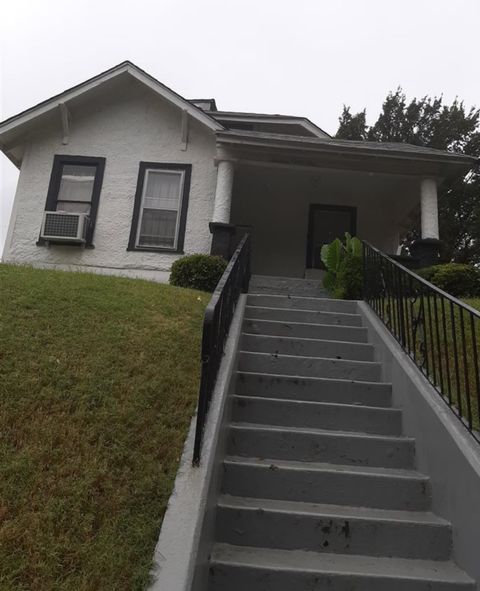
1055 Azalia St, Memphis, TN 38106
$776
Cash flow
18.1%
Cash-on-Cash Return
18.6%
Cap rate
2.4%
Rent to Value Ratio
68 out of 69 properties for sale in 38106
Limited Results Shown
Create a free account, or log in to reveal all property listings and enjoy the complete experience.
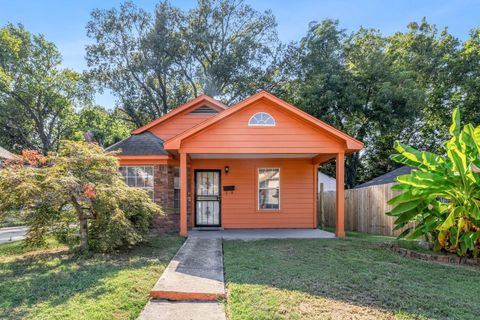
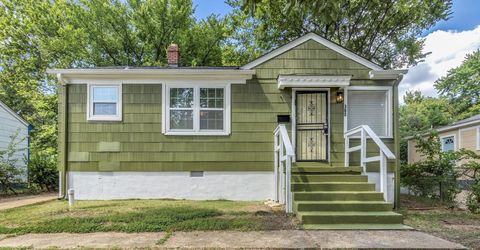
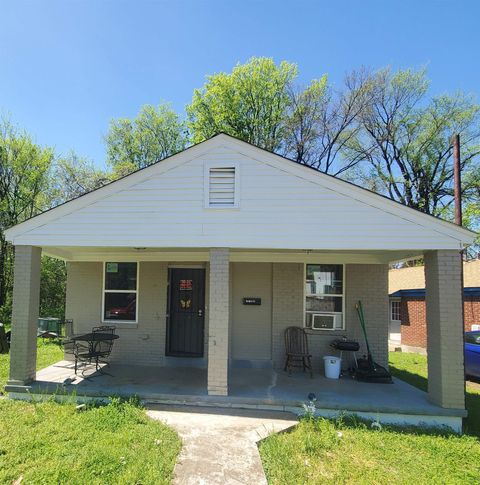
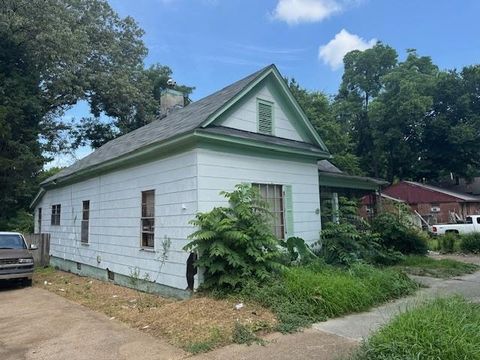
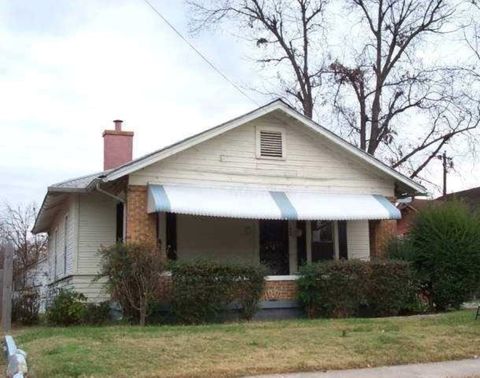
Active
$129,900
3
bds
|
2
ba
|
0
sqft
|
built
2000
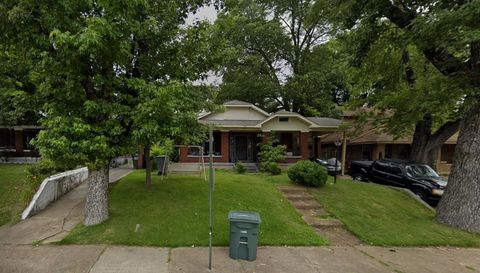
1433 S Wellington St, Memphis, TN 38106
$142
Cash flow
5.7%
Cash-on-Cash Return
7.0%
Cap rate
0.9%
Rent to Value Ratio
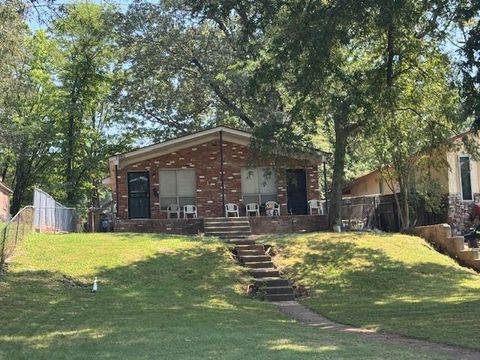
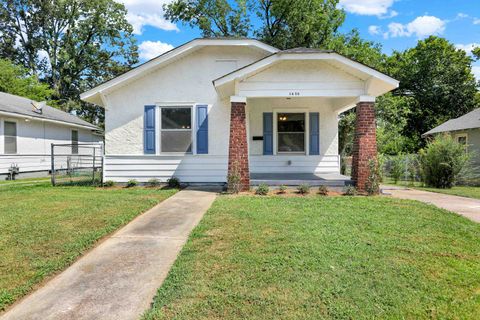
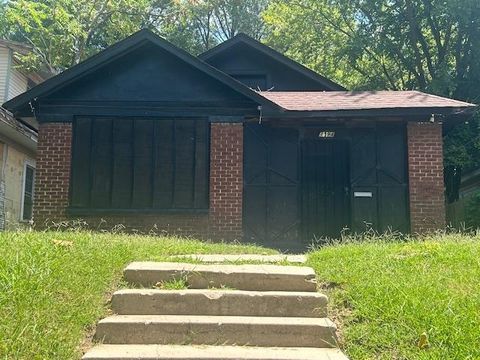
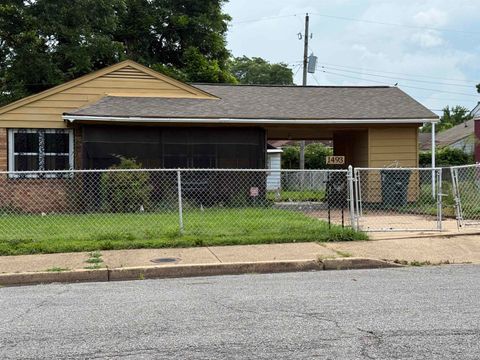
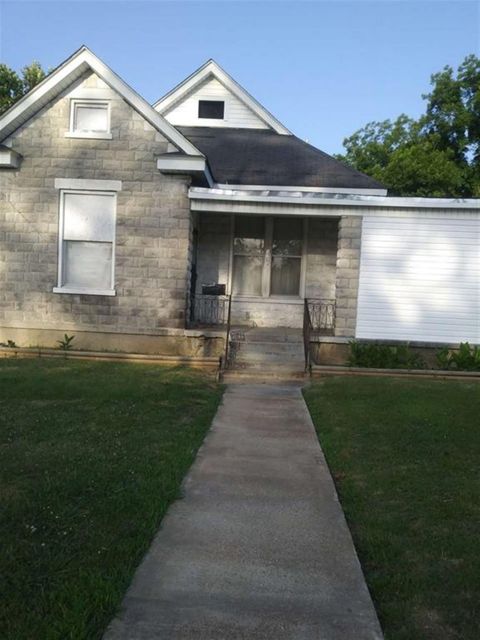
Active
$100,000
4
bds
|
2
ba
|
0
sqft
|
built
1966
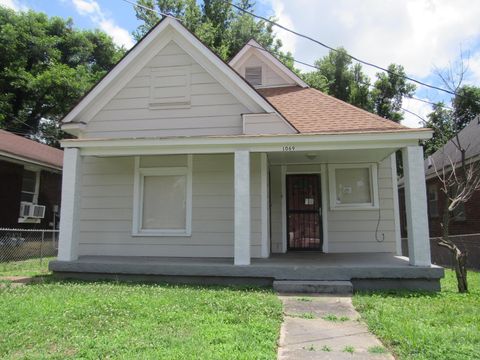
1580 Marjorie St, Memphis, TN 38106
$77
Cash flow
4.0%
Cash-on-Cash Return
6.6%
Cap rate
0.9%
Rent to Value Ratio
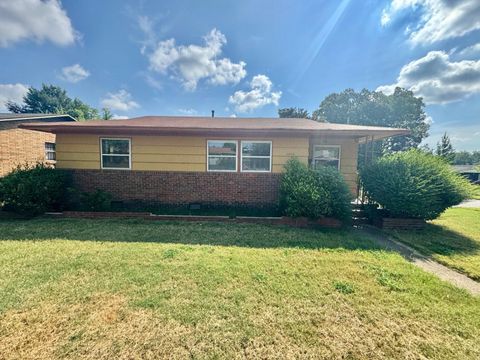
Active
$84,900
3
bds
|
1
ba
|
0
sqft
|
built
1949
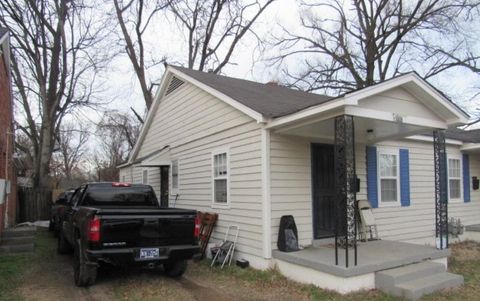
380 E Dison Ave, Memphis, TN 38106
$243
Cash flow
14.9%
Cash-on-Cash Return
9.1%
Cap rate
1.2%
Rent to Value Ratio
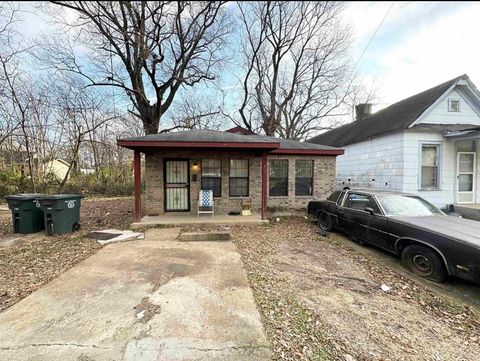
Active
$250,000
3
bds
|
2
ba
|
0
sqft
|
built
1918
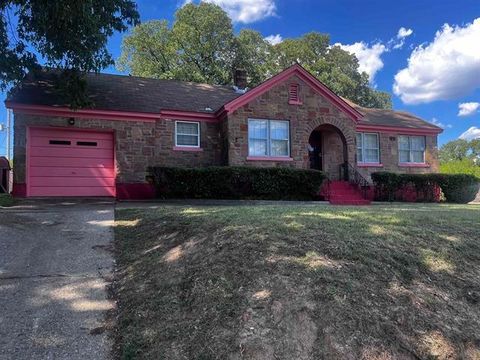
1650 Glenview Ave, Memphis, TN 38106
$-10
Cash flow
-0.2%
Cash-on-Cash Return
5.6%
Cap rate
0.7%
Rent to Value Ratio
Active
$90,000
3
bds
|
1.5
ba
|
0
sqft
|
built
1955
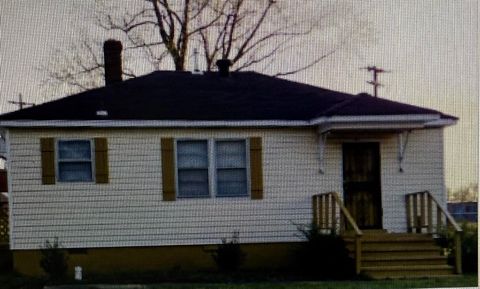
1818 Benton St, Memphis, TN 38106
$456
Cash flow
26.4%
Cash-on-Cash Return
11.8%
Cap rate
1.6%
Rent to Value Ratio
Active
$95,000
3
bds
|
2
ba
|
0
sqft
|
built
2007
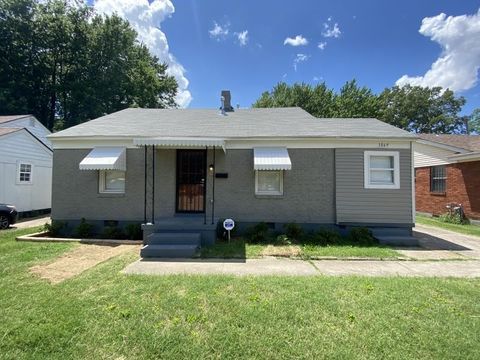
1238 Marksman St, Memphis, TN 38106
$167
Cash flow
9.2%
Cash-on-Cash Return
7.8%
Cap rate
1.1%
Rent to Value Ratio
Active
$89,900
3
bds
|
1
ba
|
0
sqft
|
built
1923
1097 Cummings St, Memphis, TN 38106
$278
Cash flow
16.1%
Cash-on-Cash Return
9.4%
Cap rate
1.2%
Rent to Value Ratio
Active
$65,000
3
bds
|
1
ba
|
0
sqft
|
built
1922
1299 Dunnavant St, Memphis, TN 38106
$579
Cash flow
10.4%
Cash-on-Cash Return
10.7%
Cap rate
1.4%
Rent to Value Ratio
Active
$70,000
3
bds
|
1
ba
|
0
sqft
|
built
1951
1153 Dunnavant St, Memphis, TN 38106
$669
Cash flow
11.1%
Cash-on-Cash Return
11.5%
Cap rate
1.4%
Rent to Value Ratio
Active
$55,000
2
bds
|
1
ba
|
0
sqft
|
built
1900
1194 Latham St, Memphis, TN 38106
$584
Cash flow
12.4%
Cash-on-Cash Return
12.7%
Cap rate
1.6%
Rent to Value Ratio
Active
$85,000
2
bds
|
1
ba
|
0
sqft
|
built
1952
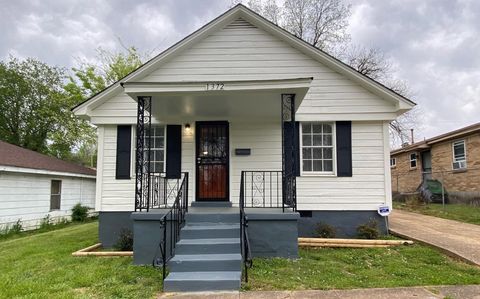
1372 South Ave, Memphis, TN 38106
$295
Cash flow
18.1%
Cash-on-Cash Return
9.8%
Cap rate
1.3%
Rent to Value Ratio
Active
$45,000
2
bds
|
1
ba
|
0
sqft
|
built
1920
1433 Humber St, Memphis, TN 38106
$581
Cash flow
15.0%
Cash-on-Cash Return
15.5%
Cap rate
2.0%
Rent to Value Ratio
Active
$265,000
5
bds
|
2
ba
|
0
sqft
|
built
1920
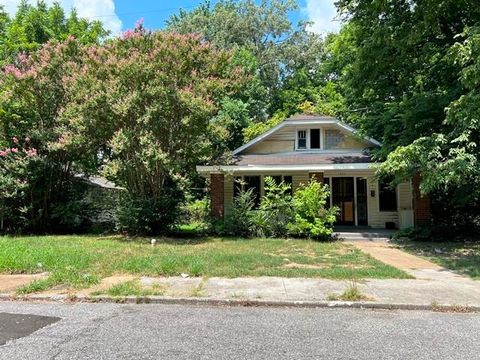
1712 Glenview Ave, Memphis, TN 38106
$25
Cash flow
0.5%
Cash-on-Cash Return
5.8%
Cap rate
0.8%
Rent to Value Ratio
Active
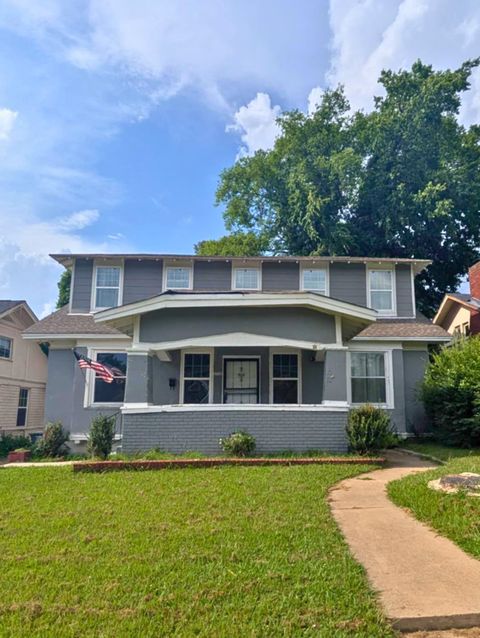
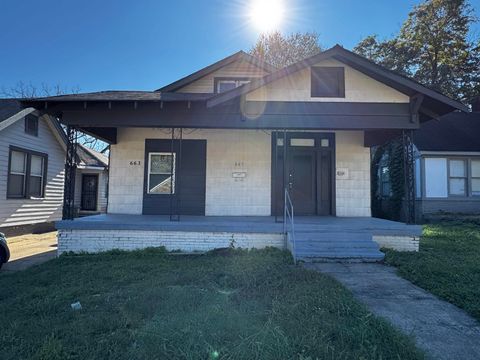
$125,000
3
bds
|
2
ba
|
0
sqft
|
built
1916
661 E Mallory Ave, Memphis, TN 38106
$180
Cash flow
7.5%
Cash-on-Cash Return
7.4%
Cap rate
1.0%
Rent to Value Ratio
Active
$84,900
4
bds
|
2.1
ba
|
0
sqft
|
built
1941
1490 Lockhaven Ave, Memphis, TN 38106
$506
Cash flow
31.1%
Cash-on-Cash Return
12.8%
Cap rate
1.6%
Rent to Value Ratio
Active
$89,900
2
bds
|
1
ba
|
0
sqft
|
built
1927
1420 Cameron St, Memphis, TN 38106
$298
Cash flow
17.3%
Cash-on-Cash Return
9.7%
Cap rate
1.2%
Rent to Value Ratio
Active
$71,000
3
bds
|
1
ba
|
0
sqft
|
built
1927
1434 Cameron St, Memphis, TN 38106
$718
Cash flow
11.8%
Cash-on-Cash Return
12.1%
Cap rate
1.5%
Rent to Value Ratio
Active
$52,000
3
bds
|
1
ba
|
0
sqft
|
built
1920
318 Cambridge Ave, Memphis, TN 38106
$523
Cash flow
11.7%
Cash-on-Cash Return
12.1%
Cap rate
1.5%
Rent to Value Ratio
Active
$259,900
3
bds
|
2
ba
|
0
sqft
|
built
1927
1651 Kendale Ave, Memphis, TN 38106
$-424
Cash flow
-8.5%
Cash-on-Cash Return
3.7%
Cap rate
0.5%
Rent to Value Ratio
Active
$115,000
3
bds
|
1
ba
|
0
sqft
|
built
1950
1322 Sardis St, Memphis, TN 38106
$109
Cash flow
4.9%
Cash-on-Cash Return
6.8%
Cap rate
0.9%
Rent to Value Ratio
Active
$40,000
4
bds
|
2
ba
|
0
sqft
|
built
1925
1630 Latham St, Memphis, TN 38106
$720
Cash flow
21.0%
Cash-on-Cash Return
21.6%
Cap rate
2.8%
Rent to Value Ratio
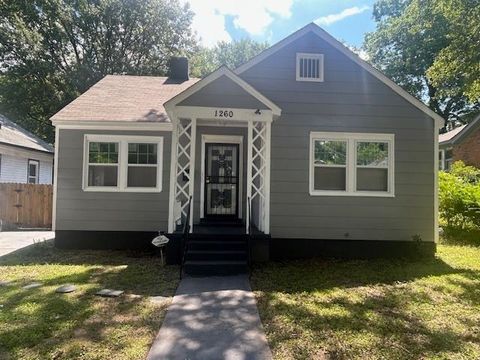
Active
$105,132
3
bds
|
1
ba
|
0
sqft
|
built
1936
1260 Greenwood St, Memphis, TN 38106
$224
Cash flow
11.1%
Cash-on-Cash Return
8.2%
Cap rate
1.0%
Rent to Value Ratio
Active
$77,000
4
bds
|
2
ba
|
0
sqft
|
built
1951
944 Alice Ave, Memphis, TN 38106
$354
Cash flow
24.0%
Cash-on-Cash Return
11.2%
Cap rate
1.4%
Rent to Value Ratio
Active
$69,500
2
bds
|
1
ba
|
0
sqft
|
built
1930
1093 Saxon Ave, Memphis, TN 38106
$581
Cash flow
9.7%
Cash-on-Cash Return
10.0%
Cap rate
1.3%
Rent to Value Ratio
Active
$22,500
3
bds
|
1
ba
|
0
sqft
|
built
1912
1557 Preston St, Memphis, TN 38106
$726
Cash flow
37.6%
Cash-on-Cash Return
38.7%
Cap rate
4.9%
Rent to Value Ratio
Active
$100,000
2
bds
|
1
ba
|
0
sqft
|
built
1957
1493 Ragan St, Memphis, TN 38106
$239
Cash flow
12.5%
Cash-on-Cash Return
8.5%
Cap rate
1.1%
Rent to Value Ratio
Active
$95,000
2
bds
|
1
ba
|
0
sqft
|
built
1947
2048 Benton St, Memphis, TN 38106
$263
Cash flow
14.4%
Cash-on-Cash Return
9.0%
Cap rate
1.2%
Rent to Value Ratio
Active
$27,500
4
bds
|
2
ba
|
0
sqft
|
built
1930
1381 James St, Memphis, TN 38106
$663
Cash flow
28.1%
Cash-on-Cash Return
28.9%
Cap rate
4.0%
Rent to Value Ratio
Active
$62,000
3
bds
|
1
ba
|
0
sqft
|
built
1920
898 S Parkway E, Memphis, TN 38106
$640
Cash flow
12.0%
Cash-on-Cash Return
12.4%
Cap rate
1.6%
Rent to Value Ratio
Active
$59,900
3
bds
|
1
ba
|
0
sqft
|
built
1912
1069 Talley Pl, Memphis, TN 38106
$729
Cash flow
14.2%
Cash-on-Cash Return
14.6%
Cap rate
1.8%
Rent to Value Ratio
Active
$155,000
4
bds
|
1.1
ba
|
0
sqft
|
built
1911
1571 E Mc Lemore Ave, Memphis, TN 38106
$300
Cash flow
10.1%
Cash-on-Cash Return
8.0%
Cap rate
1.0%
Rent to Value Ratio
Active
$85,000
3
bds
|
1
ba
|
0
sqft
|
built
1920
538 E Davant Ave, Memphis, TN 38106
$351
Cash flow
21.5%
Cash-on-Cash Return
10.6%
Cap rate
1.4%
Rent to Value Ratio
Active
$39,670
2
bds
|
1
ba
|
0
sqft
|
built
1930
1404 Preston St, Memphis, TN 38106
$586
Cash flow
17.2%
Cash-on-Cash Return
17.7%
Cap rate
2.3%
Rent to Value Ratio
Active
$49,670
3
bds
|
1
ba
|
0
sqft
|
built
1912
1264 Mississippi Blvd, Memphis, TN 38106
$646
Cash flow
15.2%
Cash-on-Cash Return
15.6%
Cap rate
2.0%
Rent to Value Ratio
Active
$84,900
3
bds
|
2
ba
|
0
sqft
|
built
1940
1092 Talley Pl, Memphis, TN 38106
$227
Cash flow
13.9%
Cash-on-Cash Return
8.9%
Cap rate
1.2%
Rent to Value Ratio
Active
$165,000
3
bds
|
2
ba
|
0
sqft
|
built
1950
760 E Mc Kellar Ave, Memphis, TN 38106
$387
Cash flow
12.2%
Cash-on-Cash Return
8.5%
Cap rate
1.1%
Rent to Value Ratio
Active
$83,000
2
bds
|
1
ba
|
0
sqft
|
built
1950
361 Jacklyn Ave, Memphis, TN 38106
$226
Cash flow
14.2%
Cash-on-Cash Return
8.9%
Cap rate
1.2%
Rent to Value Ratio
Active
$117,900
2
bds
|
2
ba
|
0
sqft
|
built
1950
1869 S Lauderdale St, Memphis, TN 38106
$154
Cash flow
6.8%
Cash-on-Cash Return
7.2%
Cap rate
1.0%
Rent to Value Ratio