38109 Investment Properties for Sale
Browse homes for sale and investment properties in 38109. Refine your search by price, property type, or more.
Best cash flowing properties in 38109
Active
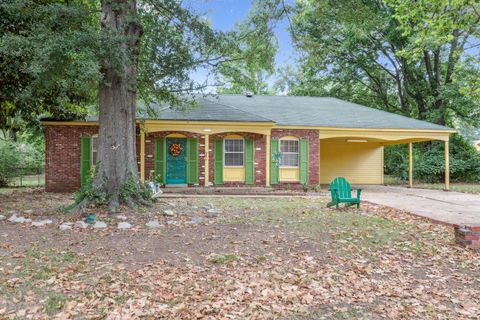
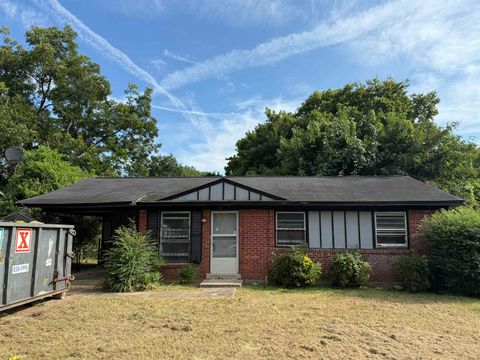
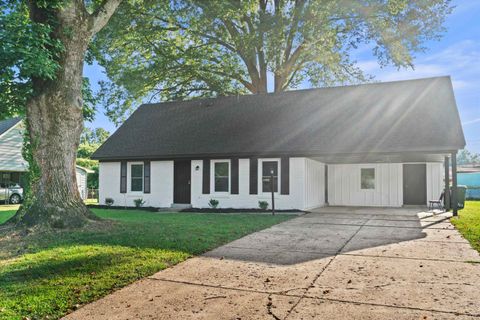
$74,900
3
bds
|
1.1
ba
|
0
sqft
|
built
1971
1221 Tahoe Rd, Memphis, TN 38109
$755
Cash flow
11.7%
Cash-on-Cash Return
12.1%
Cap rate
1.6%
Rent to Value Ratio
Active
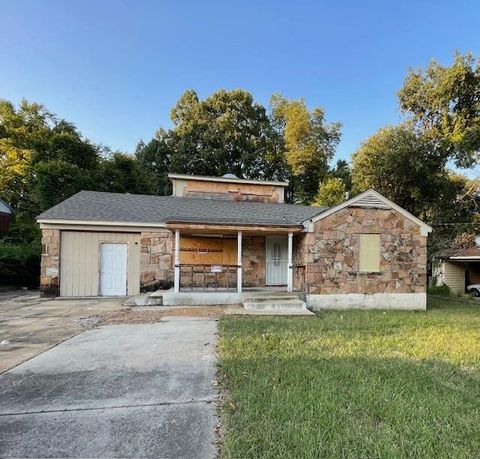
$7,500
2
bds
|
1
ba
|
0
sqft
|
built
1920
26 E Bodley Ave, Memphis, TN 38109
$729
Cash flow
113.2%
Cash-on-Cash Return
116.6%
Cap rate
14.7%
Rent to Value Ratio
80 out of 82 properties for sale in 38109
Limited Results Shown
Create a free account, or log in to reveal all property listings and enjoy the complete experience.
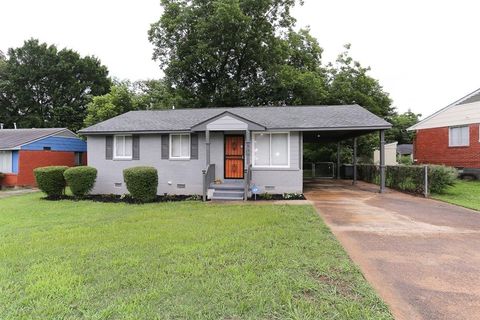
Active
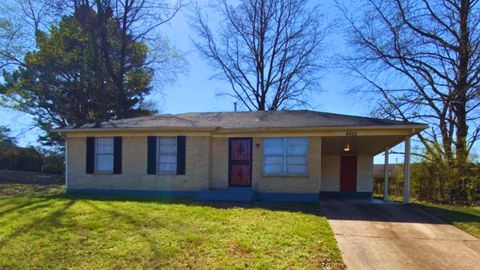
$80,000
3
bds
|
1
ba
|
0
sqft
|
built
1961
140 E Shelby Dr, Memphis, TN 38109
$433
Cash flow
28.2%
Cash-on-Cash Return
12.2%
Cap rate
1.6%
Rent to Value Ratio
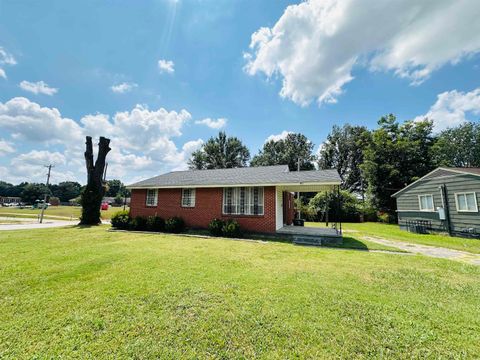
Active
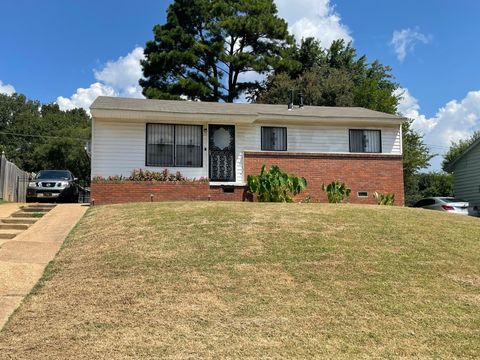
$99,900
3
bds
|
1
ba
|
0
sqft
|
built
1968
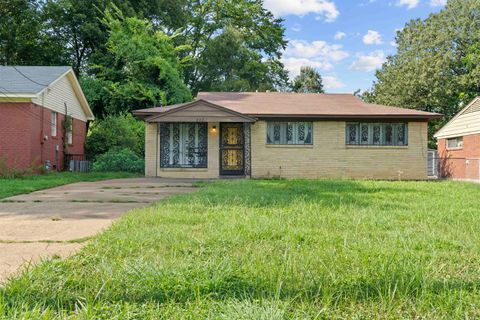
4951 Shayne Ln, Memphis, TN 38109
$272
Cash flow
14.2%
Cash-on-Cash Return
8.9%
Cap rate
1.2%
Rent to Value Ratio
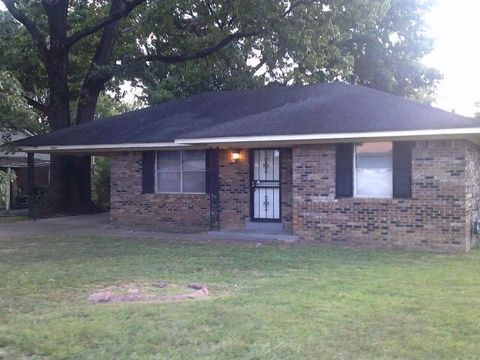
Active
$110,000
3
bds
|
1
ba
|
0
sqft
|
built
1970
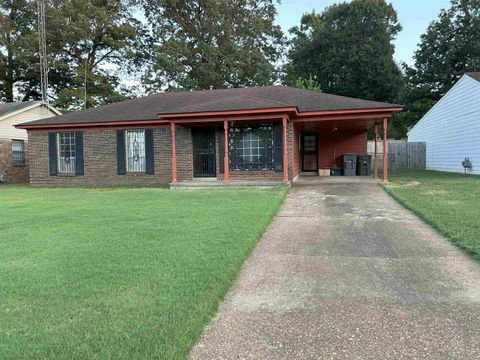
4509 Double Tree Rd, Memphis, TN 38109
$209
Cash flow
9.9%
Cash-on-Cash Return
8.0%
Cap rate
1.1%
Rent to Value Ratio
Active
$129,000
3
bds
|
1
ba
|
0
sqft
|
built
1962
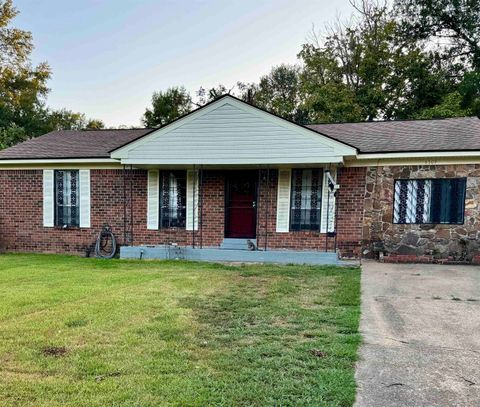
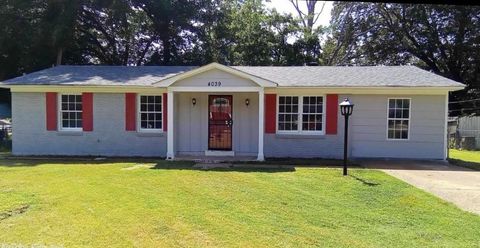
4039 Trevathan Cir, Memphis, TN 38109
$267
Cash flow
10.8%
Cash-on-Cash Return
8.2%
Cap rate
1.1%
Rent to Value Ratio
Active
$124,900
3
bds
|
1.1
ba
|
0
sqft
|
built
1954
253 E Raines Rd, Memphis, TN 38109
$133
Cash flow
5.6%
Cash-on-Cash Return
7.0%
Cap rate
1.0%
Rent to Value Ratio

Active
$115,000
4
bds
|
3
ba
|
0
sqft
|
built
1971
1185 Connemara Ave, Memphis, TN 38109
$551
Cash flow
25.0%
Cash-on-Cash Return
11.4%
Cap rate
1.6%
Rent to Value Ratio
Active
$107,000
3
bds
|
1
ba
|
0
sqft
|
built
1973
70 W Byfield Dr, Memphis, TN 38109
$247
Cash flow
12.0%
Cash-on-Cash Return
8.4%
Cap rate
1.1%
Rent to Value Ratio

Active
$99,500
3
bds
|
1.1
ba
|
0
sqft
|
built
1949
171 E Frank Ave, Memphis, TN 38109
$240
Cash flow
12.6%
Cash-on-Cash Return
8.6%
Cap rate
1.1%
Rent to Value Ratio
Active
$175,000
3
bds
|
2
ba
|
0
sqft
|
built
1969
4428 Namur Cv, Memphis, TN 38109
$129
Cash flow
3.8%
Cash-on-Cash Return
6.6%
Cap rate
0.9%
Rent to Value Ratio

Active
$109,900
4
bds
|
2
ba
|
0
sqft
|
built
1950
631 Nonconnah Rd, Memphis, TN 38109
$373
Cash flow
17.7%
Cash-on-Cash Return
9.8%
Cap rate
1.3%
Rent to Value Ratio
Active
$88,000
3
bds
|
3.1
ba
|
0
sqft
|
built
1954
70 E Belle Haven Rd, Memphis, TN 38109
$482
Cash flow
28.6%
Cash-on-Cash Return
12.2%
Cap rate
1.6%
Rent to Value Ratio
Active
$94,000
3
bds
|
1
ba
|
0
sqft
|
built
1972
4959 Glenarm Cv, Memphis, TN 38109
$213
Cash flow
11.8%
Cash-on-Cash Return
8.4%
Cap rate
1.2%
Rent to Value Ratio
Active
$98,500
3
bds
|
1
ba
|
0
sqft
|
built
1960
646 Western Park Dr, Memphis, TN 38109
$205
Cash flow
10.9%
Cash-on-Cash Return
8.2%
Cap rate
1.1%
Rent to Value Ratio
Active
$64,900
3
bds
|
1
ba
|
0
sqft
|
built
1960
271 W Levi Rd, Memphis, TN 38109
$696
Cash flow
12.5%
Cash-on-Cash Return
12.9%
Cap rate
1.7%
Rent to Value Ratio
Active
$115,000
3
bds
|
1
ba
|
0
sqft
|
built
1957
518 Jenson Rd, Memphis, TN 38109
$375
Cash flow
17.0%
Cash-on-Cash Return
9.6%
Cap rate
1.2%
Rent to Value Ratio
Active
$75,000
3
bds
|
1
ba
|
0
sqft
|
built
1956
511 Jenson Rd, Memphis, TN 38109
$357
Cash flow
24.8%
Cash-on-Cash Return
11.4%
Cap rate
1.5%
Rent to Value Ratio

Active
$94,900
3
bds
|
1
ba
|
0
sqft
|
built
1971
4018 Swanbrook St, Memphis, TN 38109
$179
Cash flow
9.8%
Cash-on-Cash Return
7.9%
Cap rate
1.1%
Rent to Value Ratio
Active
$104,900
3
bds
|
2
ba
|
0
sqft
|
built
1967
4909 Neely Rd, Memphis, TN 38109
$305
Cash flow
15.2%
Cash-on-Cash Return
9.2%
Cap rate
1.2%
Rent to Value Ratio
Active
$134,000
4
bds
|
2
ba
|
0
sqft
|
built
1960
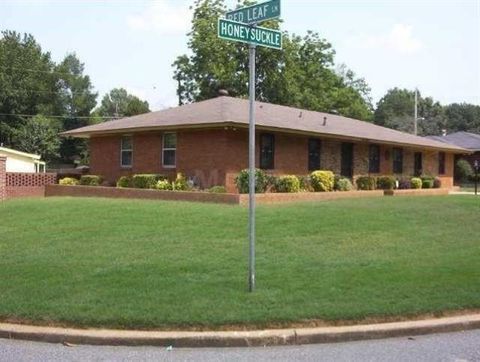
4658 Honeysuckle Ln, Memphis, TN 38109
$149
Cash flow
5.8%
Cash-on-Cash Return
7.0%
Cap rate
1.0%
Rent to Value Ratio

Active
$135,000
3
bds
|
1
ba
|
0
sqft
|
built
1962
507 Tonto Dr, Memphis, TN 38109
$103
Cash flow
4.0%
Cash-on-Cash Return
6.6%
Cap rate
0.9%
Rent to Value Ratio

Active
$89,900
3
bds
|
1
ba
|
0
sqft
|
built
1972
3420 Forrester Rd, Memphis, TN 38109
$336
Cash flow
19.5%
Cash-on-Cash Return
10.2%
Cap rate
1.3%
Rent to Value Ratio

Active
$219,995
5
bds
|
3
ba
|
0
sqft
|
built
1955
273 Dreger Ave, Memphis, TN 38109
$-66
Cash flow
-1.6%
Cash-on-Cash Return
5.3%
Cap rate
0.7%
Rent to Value Ratio

Active
$185,000
4
bds
|
2
ba
|
0
sqft
|
built
1940
726 Harahan Rd, Memphis, TN 38109
$365
Cash flow
10.3%
Cash-on-Cash Return
8.0%
Cap rate
1.0%
Rent to Value Ratio
Active
$119,900
3
bds
|
1
ba
|
0
sqft
|
built
1963
222 Delta Rd, Memphis, TN 38109
$262
Cash flow
11.4%
Cash-on-Cash Return
8.3%
Cap rate
1.2%
Rent to Value Ratio
Active
$130,000
3
bds
|
2
ba
|
0
sqft
|
built
1947
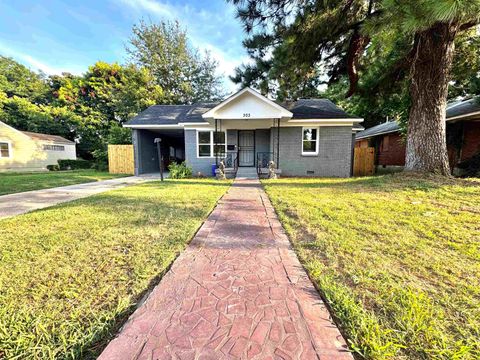
303 Fields Ave, Memphis, TN 38109
$310
Cash flow
12.4%
Cash-on-Cash Return
8.5%
Cap rate
1.1%
Rent to Value Ratio
Active
$135,000
3
bds
|
1.1
ba
|
0
sqft
|
built
1970
171 Loraine Rd, Memphis, TN 38109
$164
Cash flow
6.3%
Cash-on-Cash Return
7.1%
Cap rate
1.0%
Rent to Value Ratio
Active
$169,900
3
bds
|
1.1
ba
|
0
sqft
|
built
1956
4605 Whitepine St, Memphis, TN 38109
$117
Cash flow
3.6%
Cash-on-Cash Return
6.5%
Cap rate
0.9%
Rent to Value Ratio
Active
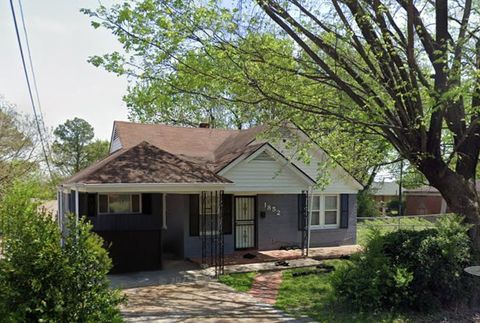
$130,000
3
bds
|
2
ba
|
0
sqft
|
built
1952
1852 Swift St, Memphis, TN 38109
$287
Cash flow
11.5%
Cash-on-Cash Return
8.3%
Cap rate
1.1%
Rent to Value Ratio
Active
$149,000
4
bds
|
2
ba
|
0
sqft
|
built
1970
444 Honduras Ave, Memphis, TN 38109
$110
Cash flow
3.9%
Cash-on-Cash Return
6.6%
Cap rate
0.9%
Rent to Value Ratio
Active
$59,000
2
bds
|
1
ba
|
0
sqft
|
built
1935
791 W Levi Rd, Memphis, TN 38109
$652
Cash flow
12.9%
Cash-on-Cash Return
13.3%
Cap rate
1.7%
Rent to Value Ratio
Active
$120,000
3
bds
|
1
ba
|
0
sqft
|
built
1959
3932 Dearborn St, Memphis, TN 38109
$156
Cash flow
6.8%
Cash-on-Cash Return
7.2%
Cap rate
1.0%
Rent to Value Ratio

Active
$145,000
3
bds
|
1
ba
|
0
sqft
|
built
1955
668 Westview Ln, Memphis, TN 38109
$293
Cash flow
10.5%
Cash-on-Cash Return
8.1%
Cap rate
1.1%
Rent to Value Ratio
Active
$125,000
2
bds
|
2
ba
|
0
sqft
|
built
1925
96 Modder Ave, Memphis, TN 38109
$46
Cash flow
1.9%
Cash-on-Cash Return
6.1%
Cap rate
0.8%
Rent to Value Ratio
Active
$94,900
4
bds
|
1
ba
|
0
sqft
|
built
1970
4365 Bluebell St, Memphis, TN 38109
$369
Cash flow
20.3%
Cash-on-Cash Return
10.3%
Cap rate
1.4%
Rent to Value Ratio
Active
$99,900
3
bds
|
1
ba
|
0
sqft
|
built
1957
390 Sullivan Dr, Memphis, TN 38109
$210
Cash flow
11.0%
Cash-on-Cash Return
8.2%
Cap rate
1.1%
Rent to Value Ratio

Active
$199,000
4
bds
|
3
ba
|
0
sqft
|
built
1955
339 Shofner Ave, Memphis, TN 38109
$152
Cash flow
4.0%
Cash-on-Cash Return
6.6%
Cap rate
0.9%
Rent to Value Ratio
Active
$115,000
3
bds
|
1
ba
|
0
sqft
|
built
1961
4826 Peace St, Memphis, TN 38109
$314
Cash flow
14.2%
Cash-on-Cash Return
9.0%
Cap rate
1.2%
Rent to Value Ratio
Active
$122,500
4
bds
|
1
ba
|
0
sqft
|
built
1973
1190 Elder Rd, Memphis, TN 38109
$106
Cash flow
4.5%
Cash-on-Cash Return
6.7%
Cap rate
0.9%
Rent to Value Ratio