38116 Investment Properties for Sale
Browse homes for sale and investment properties in 38116. Refine your search by price, property type, or more.
Best cash flowing properties in 38116
Active
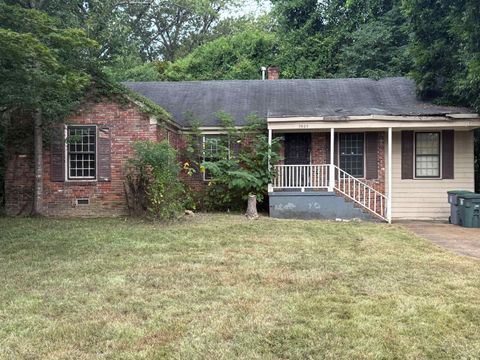
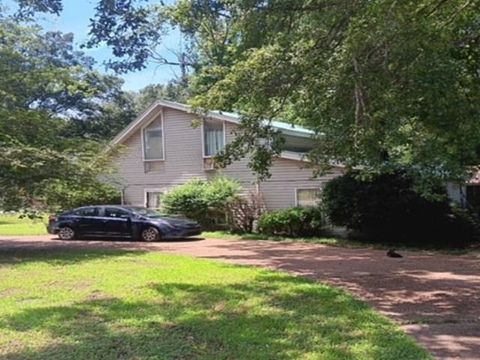
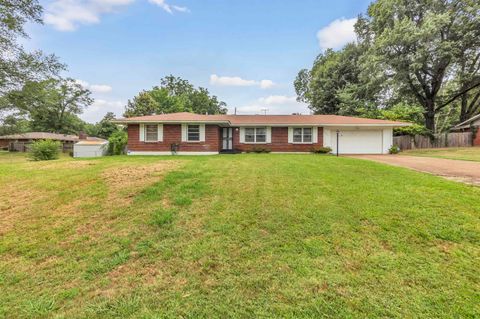
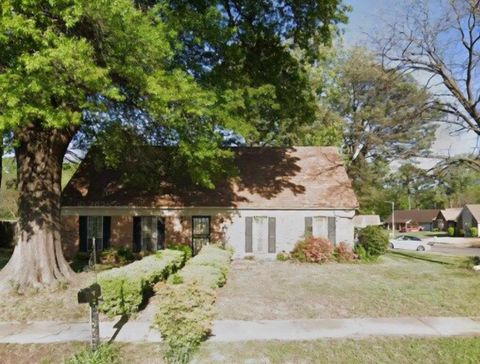
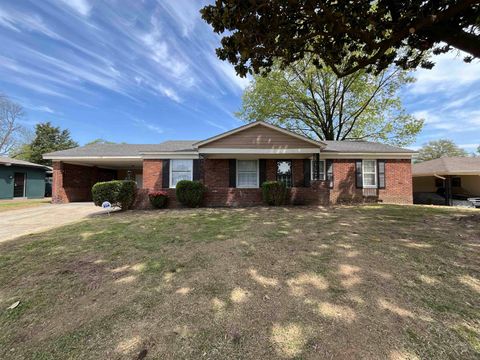
$109,900
4
bds
|
2
ba
|
0
sqft
|
built
1957
5025 Loch Lomond Rd, Memphis, TN 38116
$326
Cash flow
15.5%
Cash-on-Cash Return
9.2%
Cap rate
1.3%
Rent to Value Ratio
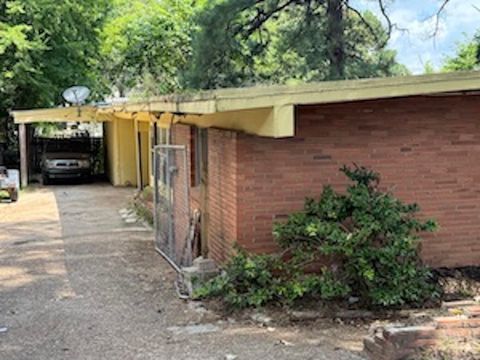
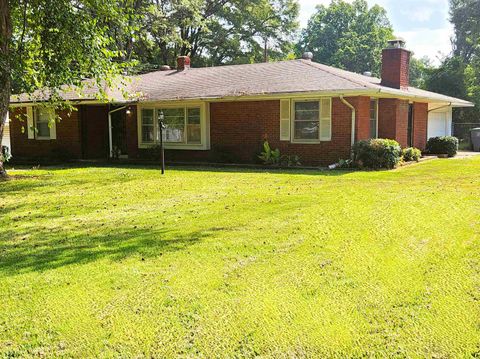
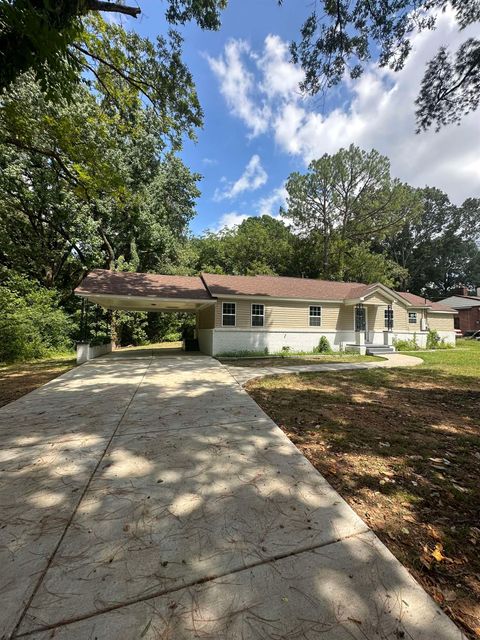
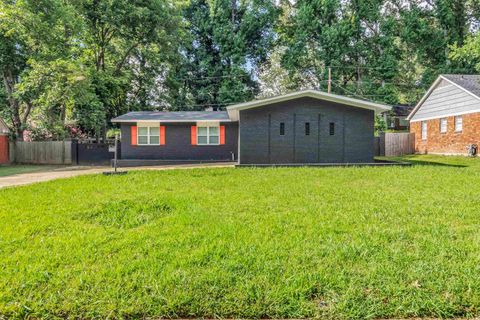
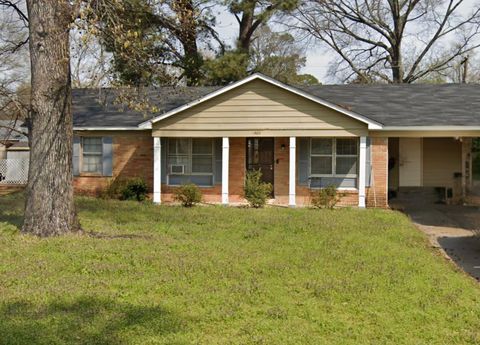
Active
$104,000
4
bds
|
2
ba
|
0
sqft
|
built
1963
1534 E Raines Rd, Memphis, TN 38116
$301
Cash flow
15.1%
Cash-on-Cash Return
9.2%
Cap rate
1.3%
Rent to Value Ratio
22 out of 28 properties for sale in 38116
Limited Results Shown
Create a free account, or log in to reveal all property listings and enjoy the complete experience.
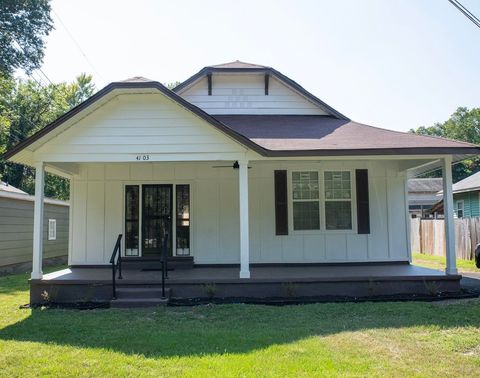
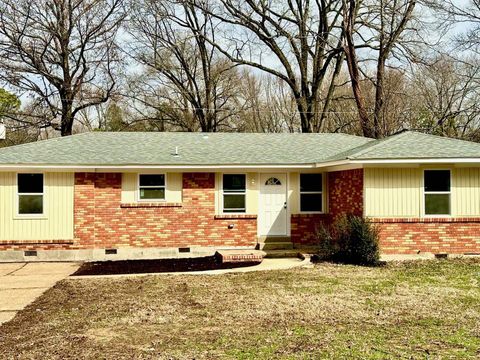
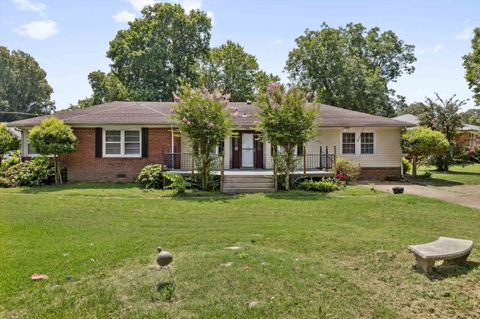
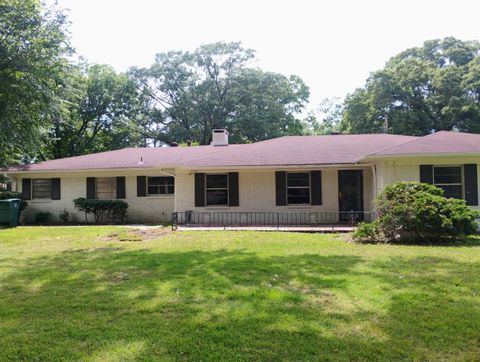
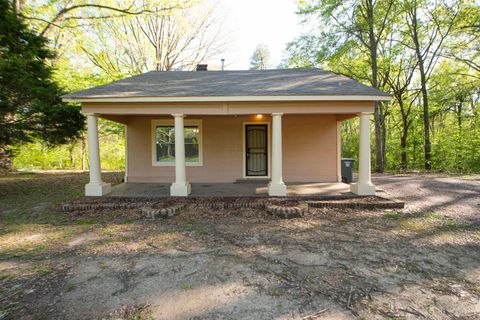
Active
$175,000
3
bds
|
2
ba
|
0
sqft
|
built
1910
4103 Orleans Rd, Memphis, TN 38116
$-10,934
Cash flow
-326.0%
Cash-on-Cash Return
-69.3%
Cap rate
0.7%
Rent to Value Ratio
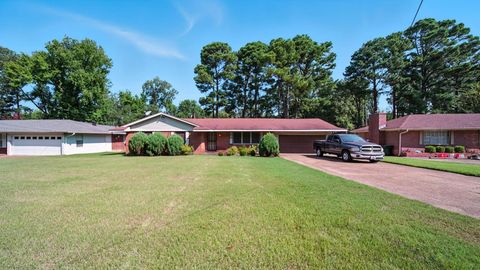
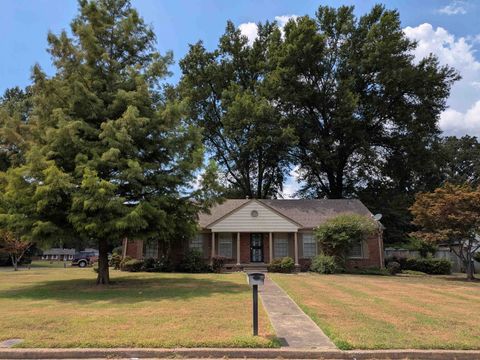
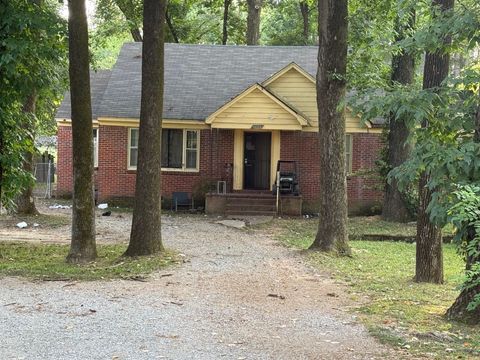
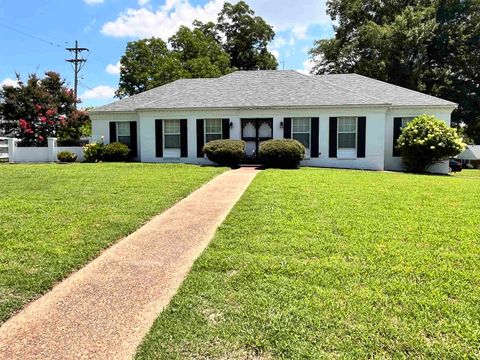
Active
$188,000
3
bds
|
2
ba
|
0
sqft
|
built
1961
1358 Old Hickory Rd, Memphis, TN 38116
$-59
Cash flow
-1.6%
Cash-on-Cash Return
5.3%
Cap rate
0.7%
Rent to Value Ratio
Active
$185,500
4
bds
|
3
ba
|
0
sqft
|
built
1973
3693 Hermitage Dr, Memphis, TN 38116
$87
Cash flow
2.4%
Cash-on-Cash Return
6.2%
Cap rate
0.9%
Rent to Value Ratio
Active
$155,000
3
bds
|
1.1
ba
|
0
sqft
|
built
1958
4070 Spiegel Dr, Memphis, TN 38116
$104
Cash flow
3.5%
Cash-on-Cash Return
6.5%
Cap rate
0.9%
Rent to Value Ratio
Active
$185,000
4
bds
|
2
ba
|
0
sqft
|
built
1957
1604 Wilson Rd, Memphis, TN 38116
$170
Cash flow
4.8%
Cash-on-Cash Return
6.8%
Cap rate
0.9%
Rent to Value Ratio
Active
$225,000
4
bds
|
2
ba
|
0
sqft
|
built
1960
3979 Wisteria Dr, Memphis, TN 38116
$-53
Cash flow
-1.2%
Cash-on-Cash Return
5.4%
Cap rate
0.8%
Rent to Value Ratio
Active
$189,900
4
bds
|
2
ba
|
0
sqft
|
built
1960
4255 Paula Dr, Memphis, TN 38116
$39
Cash flow
1.1%
Cash-on-Cash Return
5.9%
Cap rate
0.8%
Rent to Value Ratio

Active
$257,999
3
bds
|
3
ba
|
0
sqft
|
built
1958
1680 Janis Dr, Memphis, TN 38116
$-44
Cash flow
-0.9%
Cash-on-Cash Return
5.5%
Cap rate
0.8%
Rent to Value Ratio
Active
$195,900
4
bds
|
2
ba
|
0
sqft
|
built
1950
3402 Lakeview Rd, Memphis, TN 38116
$65
Cash flow
1.7%
Cash-on-Cash Return
6.1%
Cap rate
0.8%
Rent to Value Ratio
Active
$159,900
3
bds
|
2
ba
|
0
sqft
|
built
1955
3898 Barton Dr, Memphis, TN 38116
$138
Cash flow
4.5%
Cash-on-Cash Return
6.7%
Cap rate
0.9%
Rent to Value Ratio
Active
$184,900
6
bds
|
2
ba
|
0
sqft
|
built
1960
3279 Lakeview Rd, Memphis, TN 38116
$52
Cash flow
1.5%
Cash-on-Cash Return
6.0%
Cap rate
0.9%
Rent to Value Ratio
Active
$210,000
4
bds
|
3
ba
|
0
sqft
|
built
1973
5020 Gardenwood Dr, Memphis, TN 38116
$175
Cash flow
4.3%
Cash-on-Cash Return
6.7%
Cap rate
1.0%
Rent to Value Ratio
Active
$184,900
3
bds
|
2
ba
|
0
sqft
|
built
1960
2048 Grovehaven Dr, Memphis, TN 38116
$-24
Cash flow
-0.7%
Cash-on-Cash Return
5.5%
Cap rate
0.8%
Rent to Value Ratio
Active
$250,000
4
bds
|
3
ba
|
0
sqft
|
built
1950
4611 Kassel Rd, Memphis, TN 38116
$-77
Cash flow
-1.6%
Cash-on-Cash Return
5.3%
Cap rate
0.8%
Rent to Value Ratio
Active
$229,900
3
bds
|
2
ba
|
0
sqft
|
built
1964
4282 Millbranch Rd, Memphis, TN 38116
$-157
Cash flow
-3.6%
Cash-on-Cash Return
4.9%
Cap rate
0.7%
Rent to Value Ratio
Active
$179,900
3
bds
|
2
ba
|
0
sqft
|
built
1957
1406 Randall Dr, Memphis, TN 38116
$-31
Cash flow
-0.9%
Cash-on-Cash Return
5.5%
Cap rate
0.8%
Rent to Value Ratio
Active
$174,000
2
bds
|
2
ba
|
0
sqft
|
built
1920
899 Craft Rd, Memphis, TN 38116
$223
Cash flow
6.7%
Cash-on-Cash Return
7.2%
Cap rate
1.0%
Rent to Value Ratio
Active
$130,000
3
bds
|
1
ba
|
0
sqft
|
built
1963
1502 Mary Jane Ave, Memphis, TN 38116
$-24
Cash flow
-1.0%
Cash-on-Cash Return
5.5%
Cap rate
0.8%
Rent to Value Ratio
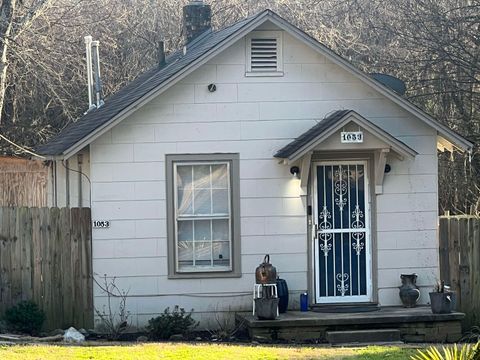
Active
$149,000
3
bds
|
1
ba
|
0
sqft
|
built
1925
1049 Hale Rd, Memphis, TN 38116
$58
Cash flow
2.0%
Cash-on-Cash Return
6.1%
Cap rate
0.9%
Rent to Value Ratio
Active
$252,000
4
bds
|
2
ba
|
0
sqft
|
built
1968
4232 Ambrose Rd, Memphis, TN 38116
$144
Cash flow
3.0%
Cash-on-Cash Return
6.4%
Cap rate
0.9%
Rent to Value Ratio