38122 Investment Properties for Sale
Browse homes for sale and investment properties in 38122. Refine your search by price, property type, or more.
Best cash flowing properties in 38122
Active
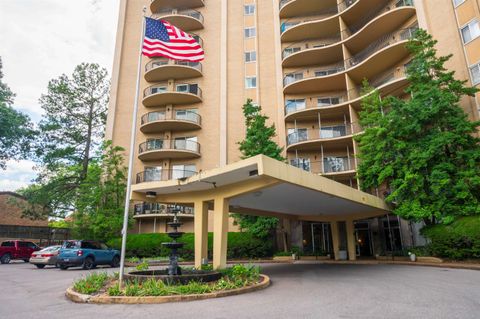
$124,500
1
bds
|
1
ba
|
0
sqft
|
built
1970
475 N Highland St, Memphis, TN 38122
$400
Cash flow
16.8%
Cash-on-Cash Return
9.5%
Cap rate
1.3%
Rent to Value Ratio
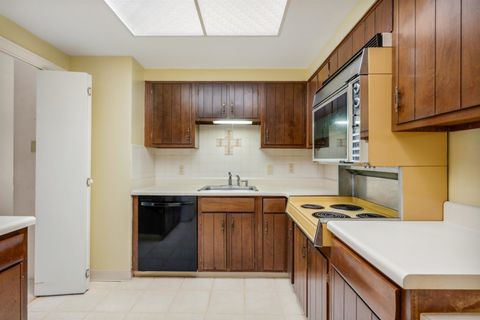
Active
$95,000
2
bds
|
2
ba
|
0
sqft
|
built
1972
475 N Highland St, Memphis, TN 38122
$363
Cash flow
19.9%
Cash-on-Cash Return
10.3%
Cap rate
1.5%
Rent to Value Ratio
49 out of 55 properties for sale in 38122
Limited Results Shown
Create a free account, or log in to reveal all property listings and enjoy the complete experience.
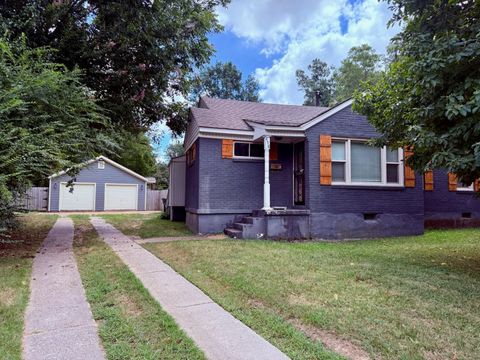
Active
$274,900
4
bds
|
2
ba
|
0
sqft
|
built
1950
458 Gerald Rd, Memphis, TN 38122
$-234
Cash flow
-4.4%
Cash-on-Cash Return
4.7%
Cap rate
0.7%
Rent to Value Ratio
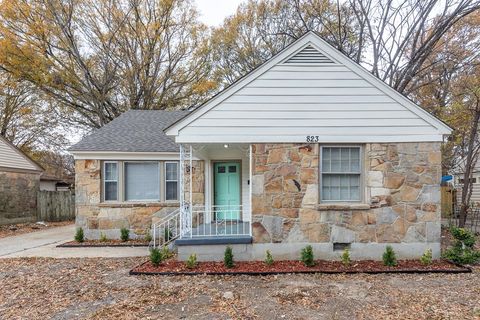
Active
$249,500
3
bds
|
2
ba
|
0
sqft
|
built
1952
823 Novarese St, Memphis, TN 38122
$-97
Cash flow
-2.0%
Cash-on-Cash Return
5.2%
Cap rate
0.7%
Rent to Value Ratio

Active
$179,000
3
bds
|
1.1
ba
|
0
sqft
|
built
1947
4121 Faxon Ave, Memphis, TN 38122
$112
Cash flow
3.3%
Cash-on-Cash Return
6.4%
Cap rate
0.9%
Rent to Value Ratio

Active
$275,000
3
bds
|
1
ba
|
0
sqft
|
built
1950
4079 Philwood Ave, Memphis, TN 38122
$-389
Cash flow
-7.4%
Cash-on-Cash Return
4.0%
Cap rate
0.7%
Rent to Value Ratio

Active
$199,000
2
bds
|
1
ba
|
0
sqft
|
built
1930
3524 Autumn Ave, Memphis, TN 38122
$-35
Cash flow
-0.9%
Cash-on-Cash Return
5.5%
Cap rate
0.9%
Rent to Value Ratio

Active
$225,000
3
bds
|
3.5
ba
|
0
sqft
|
built
1970
475 N Highland St, Memphis, TN 38122
$147
Cash flow
3.4%
Cash-on-Cash Return
6.5%
Cap rate
1.0%
Rent to Value Ratio

Active
$115,000
3
bds
|
1
ba
|
0
sqft
|
built
1951
4106 Vaughn Rd, Memphis, TN 38122
$198
Cash flow
9.0%
Cash-on-Cash Return
7.7%
Cap rate
1.0%
Rent to Value Ratio

Active
$189,500
3
bds
|
2
ba
|
0
sqft
|
built
1962
954 Tatum Rd, Memphis, TN 38122
$-66
Cash flow
-1.8%
Cash-on-Cash Return
5.3%
Cap rate
0.7%
Rent to Value Ratio

Active
$150,000
3
bds
|
2
ba
|
0
sqft
|
built
1948
1023 Dillworth St, Memphis, TN 38122
$56
Cash flow
1.9%
Cash-on-Cash Return
6.1%
Cap rate
0.9%
Rent to Value Ratio

Active
$364,900
4
bds
|
2
ba
|
0
sqft
|
built
1922
4120 Tutwiler Ave, Memphis, TN 38122
$-374
Cash flow
-5.3%
Cash-on-Cash Return
4.4%
Cap rate
0.6%
Rent to Value Ratio

Active
$126,500
3
bds
|
1
ba
|
0
sqft
|
built
1948
1357 Salem St, Memphis, TN 38122
$38
Cash flow
1.6%
Cash-on-Cash Return
6.0%
Cap rate
0.8%
Rent to Value Ratio

Active
$140,000
3
bds
|
2
ba
|
0
sqft
|
built
1941
3484 Vernon Ave, Memphis, TN 38122
$-189
Cash flow
-7.0%
Cash-on-Cash Return
4.1%
Cap rate
0.6%
Rent to Value Ratio

Active
$120,000
2
bds
|
1
ba
|
0
sqft
|
built
1948
3915 Bayliss Ave, Memphis, TN 38122
$128
Cash flow
5.6%
Cash-on-Cash Return
7.0%
Cap rate
0.9%
Rent to Value Ratio

Active
$89,900
2
bds
|
1
ba
|
0
sqft
|
built
1951
956 Dillworth St, Memphis, TN 38122
$139
Cash flow
8.1%
Cash-on-Cash Return
7.5%
Cap rate
1.0%
Rent to Value Ratio

Active
$135,000
1
bds
|
1
ba
|
0
sqft
|
built
1970
475 N Highland St, Memphis, TN 38122
$335
Cash flow
12.9%
Cash-on-Cash Return
8.7%
Cap rate
1.2%
Rent to Value Ratio

Active
$134,000
3
bds
|
1
ba
|
0
sqft
|
built
1954
994 N Perkins Rd, Memphis, TN 38122
$154
Cash flow
6.0%
Cash-on-Cash Return
7.1%
Cap rate
1.0%
Rent to Value Ratio

Active
$119,000
3
bds
|
2
ba
|
0
sqft
|
built
1948
3596 Mayfair Ave, Memphis, TN 38122
$127
Cash flow
5.6%
Cash-on-Cash Return
7.0%
Cap rate
0.9%
Rent to Value Ratio

Active
$115,000
3
bds
|
1.1
ba
|
0
sqft
|
built
1946
1167 Gordon St, Memphis, TN 38122
$134
Cash flow
6.1%
Cash-on-Cash Return
7.1%
Cap rate
1.0%
Rent to Value Ratio

Active
$115,000
1
bds
|
1
ba
|
0
sqft
|
built
1970
475 N Highland St, Memphis, TN 38122
$104
Cash flow
4.7%
Cash-on-Cash Return
6.8%
Cap rate
1.0%
Rent to Value Ratio
Active
$185,000
3
bds
|
1.1
ba
|
0
sqft
|
built
1951
822 Eastern Dr, Memphis, TN 38122
$-27
Cash flow
-0.8%
Cash-on-Cash Return
5.5%
Cap rate
0.8%
Rent to Value Ratio
Active
$275,000
3
bds
|
1
ba
|
0
sqft
|
built
1952
3556 Philwood Ave, Memphis, TN 38122
$-226
Cash flow
-4.3%
Cash-on-Cash Return
4.7%
Cap rate
0.7%
Rent to Value Ratio
Active
$209,000
3
bds
|
2.1
ba
|
0
sqft
|
built
1965
435 N Highland St, Memphis, TN 38122
$17
Cash flow
0.4%
Cash-on-Cash Return
5.8%
Cap rate
0.8%
Rent to Value Ratio

Active
$247,500
3
bds
|
1
ba
|
0
sqft
|
built
1952
3915 Lytle Cir, Memphis, TN 38122
$-312
Cash flow
-6.6%
Cash-on-Cash Return
4.2%
Cap rate
0.6%
Rent to Value Ratio
Active
$140,000
3
bds
|
2
ba
|
0
sqft
|
built
1940
3738 Townes Ave, Memphis, TN 38122
$44
Cash flow
1.6%
Cash-on-Cash Return
6.1%
Cap rate
0.8%
Rent to Value Ratio
Active
$365,000
3
bds
|
2
ba
|
0
sqft
|
built
1947
3749 Shirlwood Ave, Memphis, TN 38122
$-597
Cash flow
-8.5%
Cash-on-Cash Return
3.7%
Cap rate
0.6%
Rent to Value Ratio
Active
$250,000
2
bds
|
1
ba
|
0
sqft
|
built
1947
3595 Johnwood Dr, Memphis, TN 38122
$-43
Cash flow
-0.9%
Cash-on-Cash Return
5.5%
Cap rate
0.8%
Rent to Value Ratio

Active
$130,000
3
bds
|
1
ba
|
0
sqft
|
built
1925
3411 Rockwood Ave, Memphis, TN 38122
$49
Cash flow
2.0%
Cash-on-Cash Return
6.1%
Cap rate
0.8%
Rent to Value Ratio
Active
$342,500
2
bds
|
2
ba
|
0
sqft
|
built
1950
3613 Charleswood Ave, Memphis, TN 38122
$-421
Cash flow
-6.4%
Cash-on-Cash Return
4.2%
Cap rate
0.7%
Rent to Value Ratio
Active
$129,000
2
bds
|
1
ba
|
0
sqft
|
built
1950
883 Wingfield Rd, Memphis, TN 38122
$53
Cash flow
2.1%
Cash-on-Cash Return
6.2%
Cap rate
0.9%
Rent to Value Ratio

Active
$139,500
3
bds
|
1
ba
|
0
sqft
|
built
1950
1048 Avon Rd, Memphis, TN 38122
$144
Cash flow
5.4%
Cash-on-Cash Return
6.9%
Cap rate
0.9%
Rent to Value Ratio
Active
$125,000
4
bds
|
1
ba
|
0
sqft
|
built
1949
3789 Fairoaks Ave, Memphis, TN 38122
$86
Cash flow
3.6%
Cash-on-Cash Return
6.5%
Cap rate
0.9%
Rent to Value Ratio

Active
$119,900
2
bds
|
2
ba
|
0
sqft
|
built
1973
475 N Highland St, Memphis, TN 38122
$242
Cash flow
10.5%
Cash-on-Cash Return
8.1%
Cap rate
1.2%
Rent to Value Ratio

Active
$149,900
4
bds
|
2
ba
|
0
sqft
|
built
1967
961 N Highland St, Memphis, TN 38122
$-184
Cash flow
-6.4%
Cash-on-Cash Return
4.2%
Cap rate
0.6%
Rent to Value Ratio

Active
$289,900
2
bds
|
1
ba
|
0
sqft
|
built
1942
3529 Kenwood Ave, Memphis, TN 38122
$-424
Cash flow
-7.6%
Cash-on-Cash Return
3.9%
Cap rate
0.6%
Rent to Value Ratio

Active
$259,400
4
bds
|
2
ba
|
0
sqft
|
built
1950
473 Vaughn Rd, Memphis, TN 38122
$-376
Cash flow
-7.6%
Cash-on-Cash Return
3.9%
Cap rate
0.6%
Rent to Value Ratio

Active
$250,000
2
bds
|
1
ba
|
0
sqft
|
built
1949
1335 Victor Dr, Memphis, TN 38122
$-498
Cash flow
-10.4%
Cash-on-Cash Return
3.3%
Cap rate
0.4%
Rent to Value Ratio

Active
$349,000
3
bds
|
2
ba
|
0
sqft
|
built
1946
3539 Charleswood Ave, Memphis, TN 38122
$-558
Cash flow
-8.3%
Cash-on-Cash Return
3.8%
Cap rate
0.6%
Rent to Value Ratio
Active
$115,000
3
bds
|
2.1
ba
|
0
sqft
|
built
1975
4037 Graham Oaks Ct, Memphis, TN 38122
$282
Cash flow
12.8%
Cash-on-Cash Return
8.6%
Cap rate
1.1%
Rent to Value Ratio