38654 Investment Properties for Sale
Browse homes for sale and investment properties in 38654. Refine your search by price, property type, or more.
Best cash flowing properties in 38654
Active
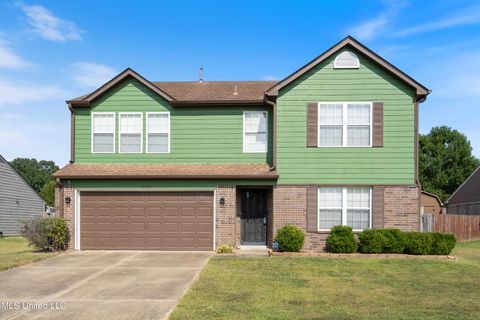
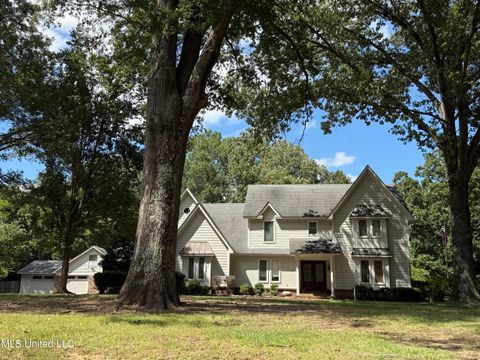
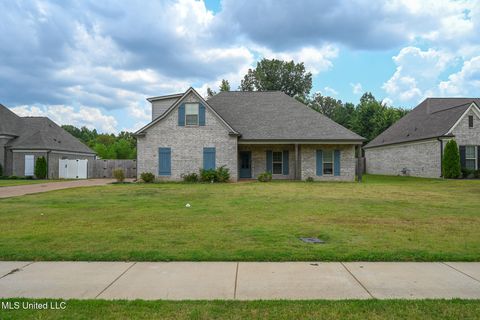
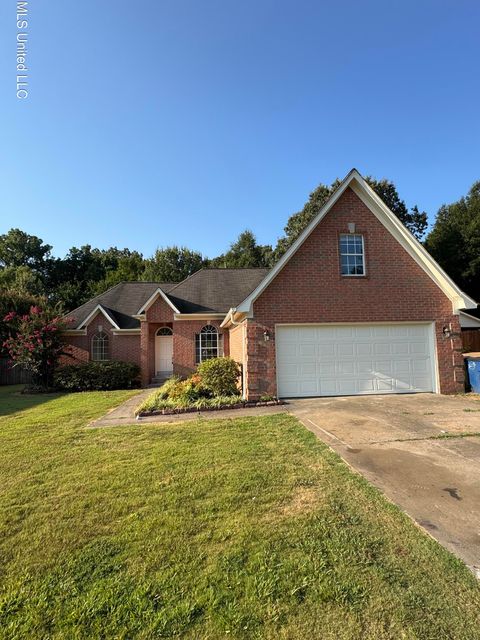
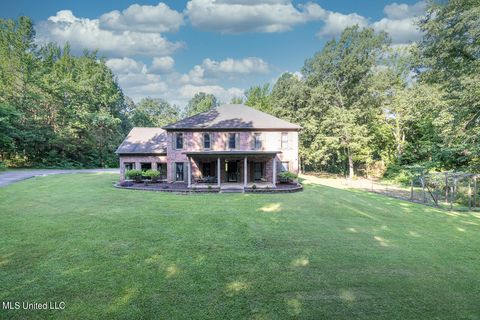
$360,000
5
bds
|
3
ba
|
0
sqft
|
built
2002
7338 Hunters Horn Dr, Olive Branch, MS 38654
$142
Cash flow
2.1%
Cash-on-Cash Return
6.2%
Cap rate
0.8%
Rent to Value Ratio
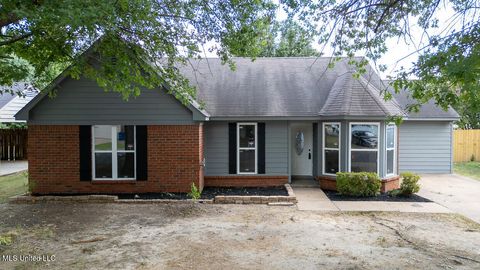
Active
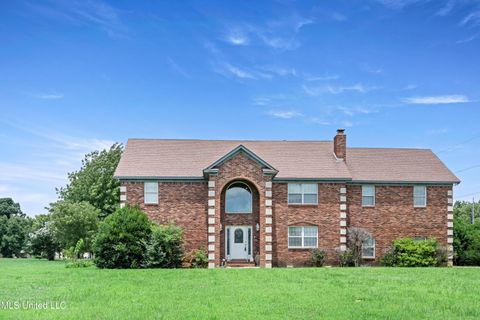
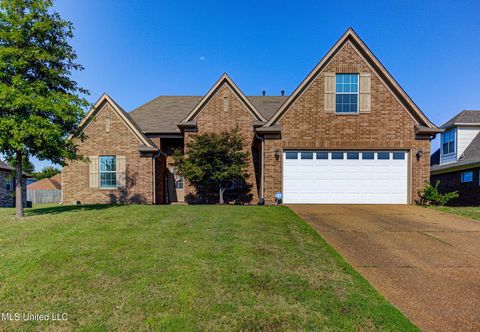
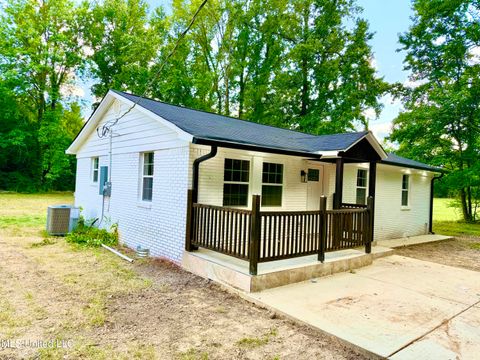
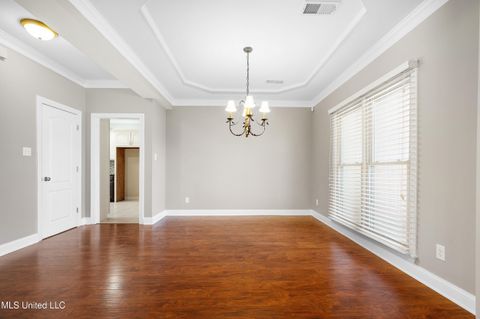
$235,000
3
bds
|
2
ba
|
0
sqft
|
built
1993
10335 Yates Dr, Olive Branch, MS 38654
$72
Cash flow
1.6%
Cash-on-Cash Return
6.0%
Cap rate
0.8%
Rent to Value Ratio
86 out of 95 properties for sale in 38654
Limited Results Shown
Create a free account, or log in to reveal all property listings and enjoy the complete experience.
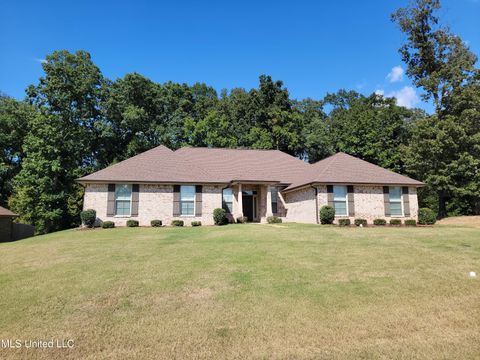
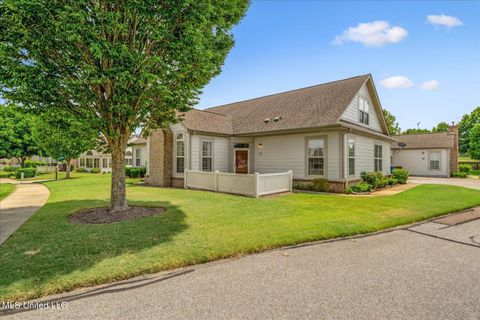
Active
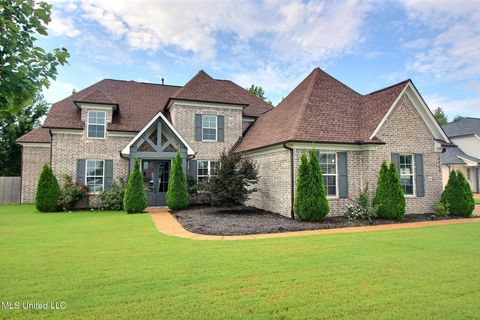
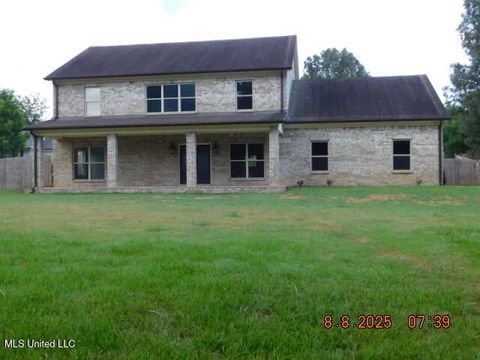
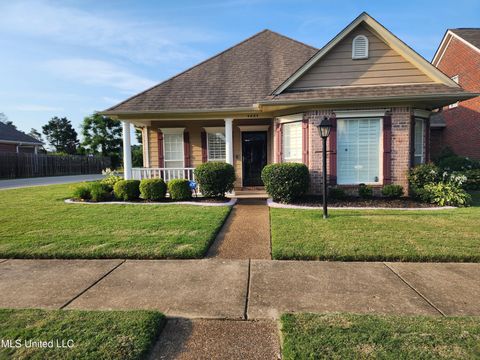
$375,000
4
bds
|
3
ba
|
0
sqft
|
built
2020
9598 Nielsen Dr, Olive Branch, MS 38654
$-202
Cash flow
-2.8%
Cash-on-Cash Return
5.0%
Cap rate
0.7%
Rent to Value Ratio
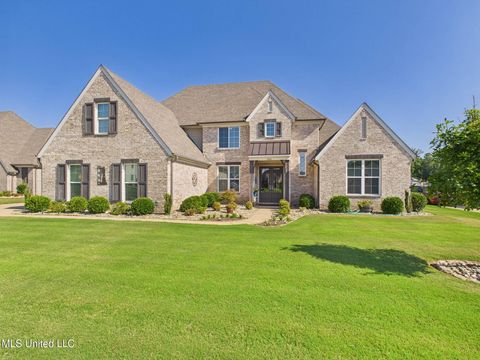
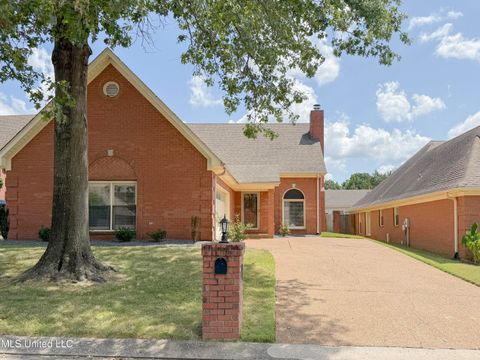
Active
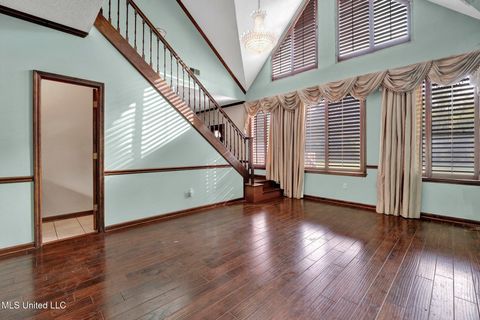
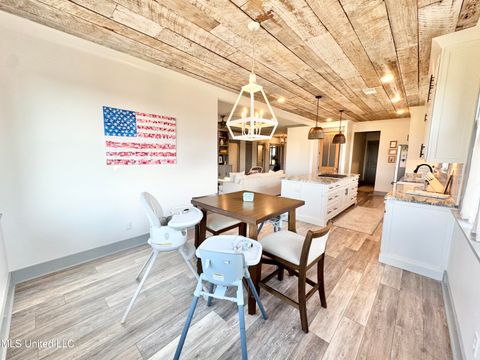
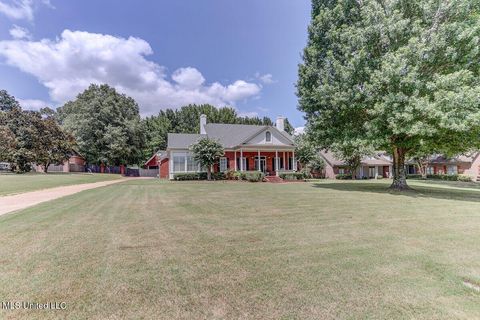
$465,000
4
bds
|
3
ba
|
0
sqft
|
built
2020
4410 John Joseph Dr, Olive Branch, MS 38654
$-107
Cash flow
-1.2%
Cash-on-Cash Return
5.4%
Cap rate
0.8%
Rent to Value Ratio
Active
$599,900
4
bds
|
4
ba
|
0
sqft
|
built
1985
8870 Collinswood Dr, Olive Branch, MS 38654
$-1,110
Cash flow
-9.7%
Cash-on-Cash Return
3.5%
Cap rate
0.5%
Rent to Value Ratio

Active
$550,000
5
bds
|
4
ba
|
0
sqft
|
built
1994
6880 Autumn Oaks Dr, Olive Branch, MS 38654
$-368
Cash flow
-3.5%
Cash-on-Cash Return
4.9%
Cap rate
0.7%
Rent to Value Ratio

Active
$340,000
3
bds
|
3
ba
|
0
sqft
|
built
1984
3575 Shady Oaks Dr, Olive Branch, MS 38654
$-268
Cash flow
-4.1%
Cash-on-Cash Return
4.7%
Cap rate
0.6%
Rent to Value Ratio
Active
$350,000
5
bds
|
4
ba
|
0
sqft
|
built
2000
10668 Stark Acres Rd, Olive Branch, MS 38654
$-133
Cash flow
-2.0%
Cash-on-Cash Return
5.2%
Cap rate
0.7%
Rent to Value Ratio
Active
$569,900
5
bds
|
3
ba
|
0
sqft
|
built
2020
6729 Farm Cv, Olive Branch, MS 38654
$-796
Cash flow
-7.3%
Cash-on-Cash Return
4.0%
Cap rate
0.6%
Rent to Value Ratio
Active
$425,000
5
bds
|
5
ba
|
0
sqft
|
built
2002
8939 Youngblood Rd, Olive Branch, MS 38654
$-256
Cash flow
-3.1%
Cash-on-Cash Return
5.0%
Cap rate
0.7%
Rent to Value Ratio
Active
$399,900
4
bds
|
2
ba
|
0
sqft
|
built
2021
5217 Nail Rd, Olive Branch, MS 38654
$-364
Cash flow
-4.7%
Cash-on-Cash Return
4.6%
Cap rate
0.6%
Rent to Value Ratio
Active
$329,900
4
bds
|
2
ba
|
0
sqft
|
built
2015
9097 Gavin Dr, Olive Branch, MS 38654
$-180
Cash flow
-2.8%
Cash-on-Cash Return
5.0%
Cap rate
0.7%
Rent to Value Ratio
Active
$479,000
5
bds
|
3
ba
|
0
sqft
|
built
2016
8511 Byhalia Rd, Olive Branch, MS 38654
$-589
Cash flow
-6.4%
Cash-on-Cash Return
4.2%
Cap rate
0.6%
Rent to Value Ratio

Active
$279,900
3
bds
|
2
ba
|
0
sqft
|
built
1990
6650 Player Dr, Olive Branch, MS 38654
$34
Cash flow
0.6%
Cash-on-Cash Return
5.8%
Cap rate
0.8%
Rent to Value Ratio

Active
$364,900
4
bds
|
3
ba
|
0
sqft
|
built
2000
7056 Apache Dr, Olive Branch, MS 38654
$-139
Cash flow
-2.0%
Cash-on-Cash Return
5.2%
Cap rate
0.7%
Rent to Value Ratio
Active
$569,900
4
bds
|
4
ba
|
0
sqft
|
built
2022
6790 Farm Cv, Olive Branch, MS 38654
$-151
Cash flow
-1.4%
Cash-on-Cash Return
5.4%
Cap rate
0.7%
Rent to Value Ratio
Active
$299,900
3
bds
|
2
ba
|
0
sqft
|
built
1996
8853 Bell Ridge Dr, Olive Branch, MS 38654
$-50
Cash flow
-0.9%
Cash-on-Cash Return
5.5%
Cap rate
0.7%
Rent to Value Ratio
Active
$250,000
3
bds
|
2
ba
|
0
sqft
|
built
1975
14679 Burton Rd, Olive Branch, MS 38654
$-183
Cash flow
-3.8%
Cash-on-Cash Return
4.8%
Cap rate
0.6%
Rent to Value Ratio
Active
$295,000
3
bds
|
3
ba
|
0
sqft
|
built
2008
8817 Parkview Oaks Cir, Olive Branch, MS 38654
$-74
Cash flow
-1.3%
Cash-on-Cash Return
5.4%
Cap rate
0.7%
Rent to Value Ratio
Active
$359,900
3
bds
|
3
ba
|
0
sqft
|
built
1993
6570 Masters Dr, Olive Branch, MS 38654
$-205
Cash flow
-3.0%
Cash-on-Cash Return
5.0%
Cap rate
0.6%
Rent to Value Ratio
Active
$650,000
5
bds
|
4
ba
|
0
sqft
|
built
2000
3981 Pleasant Hill Rd, Olive Branch, MS 38654
$-689
Cash flow
-5.5%
Cash-on-Cash Return
4.4%
Cap rate
0.5%
Rent to Value Ratio
Active
$460,000
5
bds
|
4
ba
|
0
sqft
|
built
2001
4985 Bobo Pl, Olive Branch, MS 38654
$-259
Cash flow
-2.9%
Cash-on-Cash Return
5.0%
Cap rate
0.7%
Rent to Value Ratio
Active
$330,000
3
bds
|
2
ba
|
0
sqft
|
built
2003
4885 Stone Cross Dr, Olive Branch, MS 38654
$-120
Cash flow
-1.9%
Cash-on-Cash Return
5.2%
Cap rate
0.7%
Rent to Value Ratio
Active
$569,900
4
bds
|
4
ba
|
0
sqft
|
built
1998
5460 Wedgewood Dr, Olive Branch, MS 38654
$-801
Cash flow
-7.3%
Cash-on-Cash Return
4.0%
Cap rate
0.5%
Rent to Value Ratio
Active
$399,900
5
bds
|
3
ba
|
0
sqft
|
built
2025
4213 Sidlehill Dr, Olive Branch, MS 38654
$-201
Cash flow
-2.6%
Cash-on-Cash Return
5.1%
Cap rate
0.7%
Rent to Value Ratio
Active
$260,000
3
bds
|
2
ba
|
0
sqft
|
built
1998
9821 Morgan Manor Dr, Olive Branch, MS 38654
$-39
Cash flow
-0.8%
Cash-on-Cash Return
5.5%
Cap rate
0.7%
Rent to Value Ratio

Active
$282,500
3
bds
|
2
ba
|
0
sqft
|
built
2017
7880 Allenwood Ln, Olive Branch, MS 38654
$-201
Cash flow
-3.7%
Cash-on-Cash Return
4.8%
Cap rate
0.6%
Rent to Value Ratio
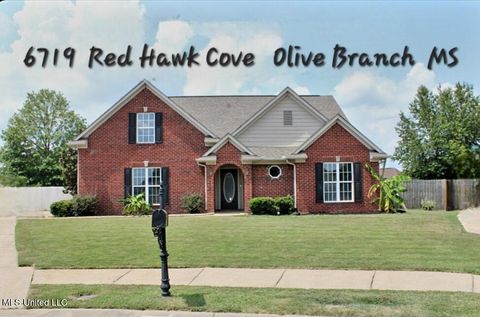
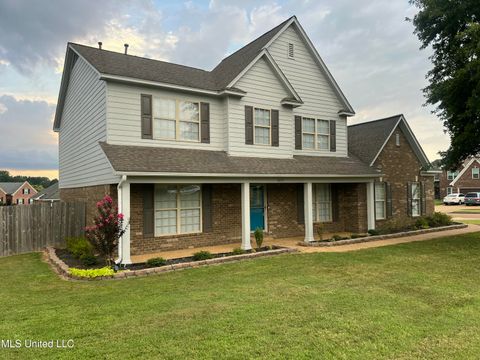
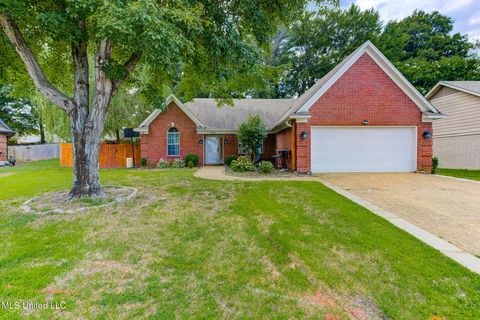
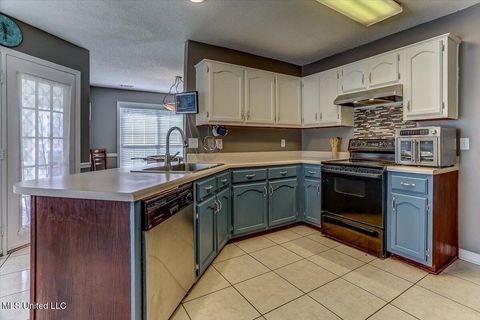
Active
$399,500
5
bds
|
3
ba
|
0
sqft
|
built
2004
6719 Red Hawk Cv, Olive Branch, MS 38654
$-329
Cash flow
-4.3%
Cash-on-Cash Return
4.7%
Cap rate
0.6%
Rent to Value Ratio
Active
$334,000
3
bds
|
2
ba
|
0
sqft
|
built
1996
8823 Bell Forrest Dr, Olive Branch, MS 38654
$-191
Cash flow
-3.0%
Cash-on-Cash Return
5.0%
Cap rate
0.7%
Rent to Value Ratio
Active
$239,900
3
bds
|
2
ba
|
0
sqft
|
built
1997
10625 Kristen Dr, Olive Branch, MS 38654
$41
Cash flow
0.9%
Cash-on-Cash Return
5.9%
Cap rate
0.8%
Rent to Value Ratio

Active
$499,900
3
bds
|
3
ba
|
0
sqft
|
built
1988
9095 Willow Branch Dr, Olive Branch, MS 38654
$-590
Cash flow
-6.2%
Cash-on-Cash Return
4.3%
Cap rate
0.6%
Rent to Value Ratio
Active
$615,000
5
bds
|
4
ba
|
0
sqft
|
built
1997
5035 Saint Andrews Cv, Olive Branch, MS 38654
$-747
Cash flow
-6.3%
Cash-on-Cash Return
4.2%
Cap rate
0.6%
Rent to Value Ratio
Active
$295,000
2
bds
|
2
ba
|
0
sqft
|
built
2015
8710 Parkview Oaks Cir, Olive Branch, MS 38654
$-413
Cash flow
-7.3%
Cash-on-Cash Return
4.0%
Cap rate
0.7%
Rent to Value Ratio
Active
$440,000
3
bds
|
3
ba
|
0
sqft
|
built
1994
6555 Masters Dr, Olive Branch, MS 38654
$-483
Cash flow
-5.7%
Cash-on-Cash Return
4.4%
Cap rate
0.6%
Rent to Value Ratio

Active
$259,900
3
bds
|
2
ba
|
0
sqft
|
built
2003
9759 Pigeon Roost Park Cir, Olive Branch, MS 38654
$-32
Cash flow
-0.6%
Cash-on-Cash Return
5.5%
Cap rate
0.7%
Rent to Value Ratio

Active
$409,900
4
bds
|
2
ba
|
0
sqft
|
built
2024
4990 Witt Cv, Olive Branch, MS 38654
$-398
Cash flow
-5.1%
Cash-on-Cash Return
4.5%
Cap rate
0.6%
Rent to Value Ratio

Active
$795,000
3
bds
|
5
ba
|
0
sqft
|
built
2020
1615 Highway 305 N, Olive Branch, MS 38654
$-1,499
Cash flow
-9.8%
Cash-on-Cash Return
3.4%
Cap rate
0.5%
Rent to Value Ratio

Active
$369,000
5
bds
|
3
ba
|
0
sqft
|
built
2002
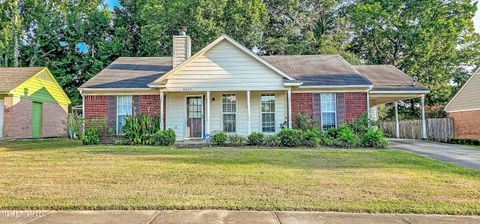
4333 Rocky Top Cv, Olive Branch, MS 38654
$64
Cash flow
0.9%
Cash-on-Cash Return
5.9%
Cap rate
0.8%
Rent to Value Ratio

Active
$525,000
5
bds
|
3
ba
|
0
sqft
|
built
1994
6760 Autumn Oaks Dr, Olive Branch, MS 38654
$-368
Cash flow
-3.7%
Cash-on-Cash Return
4.8%
Cap rate
0.7%
Rent to Value Ratio

Active
$375,000
4
bds
|
3
ba
|
0
sqft
|
built
1995
4645 Rebekah Park Dr, Olive Branch, MS 38654
$-425
Cash flow
-5.9%
Cash-on-Cash Return
4.3%
Cap rate
0.6%
Rent to Value Ratio