39212 Investment Properties for Sale
Browse homes for sale and investment properties in 39212. Refine your search by price, property type, or more.
Best cash flowing properties in 39212
Active
$39,950
3
bds
|
1
ba
|
0
sqft
|
built
1940
165 Plummer Cir, Jackson, MS 39212
$920
Cash flow
26.8%
Cash-on-Cash Return
27.6%
Cap rate
3.5%
Rent to Value Ratio
Active
$29,900
3
bds
|
1
ba
|
0
sqft
|
built
1960
1676 Smallwood St, Jackson, MS 39212
$902
Cash flow
35.1%
Cash-on-Cash Return
36.2%
Cap rate
4.7%
Rent to Value Ratio
107 out of 109 properties for sale in 39212
Limited Results Shown
Create a free account, or log in to reveal all property listings and enjoy the complete experience.
Active
$344,997
4
bds
|
3
ba
|
0
sqft
|
built
2005
126 Parks Rd, Jackson, MS 39212
$-34
Cash flow
-0.5%
Cash-on-Cash Return
5.6%
Cap rate
0.7%
Rent to Value Ratio
Active
$169,900
3
bds
|
2
ba
|
0
sqft
|
built
1970
329 Swan Lake Dr, Jackson, MS 39212
$-93
Cash flow
-2.9%
Cash-on-Cash Return
5.0%
Cap rate
0.8%
Rent to Value Ratio
Active
$56,000
3
bds
|
2
ba
|
0
sqft
|
built
1973
613 Upper Darby Rd, Jackson, MS 39212
$811
Cash flow
16.9%
Cash-on-Cash Return
17.4%
Cap rate
2.5%
Rent to Value Ratio
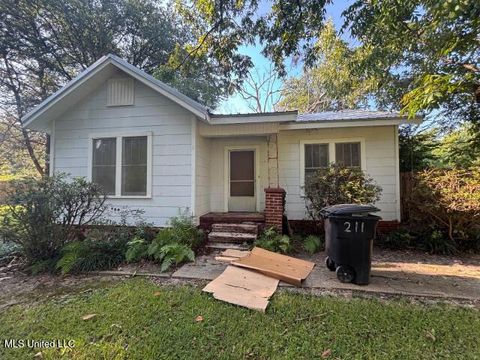
Active
$94,500
3
bds
|
1
ba
|
0
sqft
|
built
1935
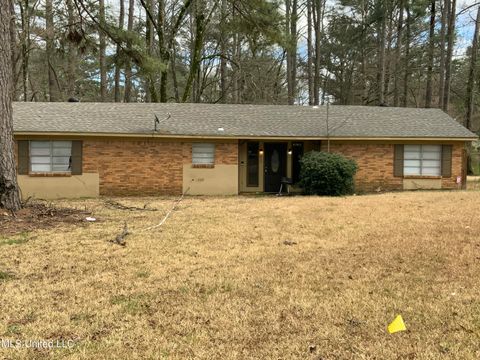
211 Stokes Robertson Rd, Jackson, MS 39212
$149
Cash flow
8.2%
Cash-on-Cash Return
7.6%
Cap rate
1.1%
Rent to Value Ratio
Active
$92,000
4
bds
|
3
ba
|
0
sqft
|
built
1962
1002 Autumn St, Jackson, MS 39212
$509
Cash flow
28.9%
Cash-on-Cash Return
12.3%
Cap rate
1.7%
Rent to Value Ratio
Active
$160,000
4
bds
|
3
ba
|
0
sqft
|
built
1963
3142 Bienville Dr, Jackson, MS 39212
$259
Cash flow
8.4%
Cash-on-Cash Return
7.6%
Cap rate
1.0%
Rent to Value Ratio

Active
$381,500
4
bds
|
3
ba
|
0
sqft
|
built
2003
2033 Elizabeth Chapman Dr, Jackson, MS 39212
$92
Cash flow
1.3%
Cash-on-Cash Return
6.0%
Cap rate
0.8%
Rent to Value Ratio
Active
$25,000
3
bds
|
2
ba
|
0
sqft
|
built
1966
1943 Bienville Dr, Jackson, MS 39212
$755
Cash flow
35.2%
Cash-on-Cash Return
36.2%
Cap rate
5.2%
Rent to Value Ratio
Active
$90,000
3
bds
|
1
ba
|
0
sqft
|
built
1956
1539 Woodburn St, Jackson, MS 39212
$240
Cash flow
13.9%
Cash-on-Cash Return
8.9%
Cap rate
1.2%
Rent to Value Ratio
Active
$119,900
3
bds
|
2
ba
|
0
sqft
|
built
1978
5424 Brookhollow Dr, Jackson, MS 39212
$372
Cash flow
16.2%
Cash-on-Cash Return
9.4%
Cap rate
1.3%
Rent to Value Ratio
Active
$49,800
3
bds
|
2
ba
|
0
sqft
|
built
1950
3158 Monticello Dr, Jackson, MS 39212
$668
Cash flow
15.6%
Cash-on-Cash Return
16.1%
Cap rate
2.2%
Rent to Value Ratio
Active
$60,000
3
bds
|
1
ba
|
0
sqft
|
built
1960
350 Dona Ave, Jackson, MS 39212
$802
Cash flow
15.6%
Cash-on-Cash Return
16.0%
Cap rate
2.2%
Rent to Value Ratio
Active
$44,900
3
bds
|
2
ba
|
0
sqft
|
built
1974
611 Chelsea Dr, Jackson, MS 39212
$697
Cash flow
18.1%
Cash-on-Cash Return
18.6%
Cap rate
2.7%
Rent to Value Ratio
Active
$140,000
3
bds
|
2
ba
|
0
sqft
|
built
1967
1119 Primrose St, Jackson, MS 39212
$343
Cash flow
12.8%
Cash-on-Cash Return
8.6%
Cap rate
1.1%
Rent to Value Ratio
Active
$74,500
3
bds
|
1
ba
|
0
sqft
|
built
1956
3062 Lakewood Dr, Jackson, MS 39212
$725
Cash flow
11.3%
Cash-on-Cash Return
11.7%
Cap rate
1.6%
Rent to Value Ratio
Active
$32,900
3
bds
|
1
ba
|
0
sqft
|
built
1954
2609 Brookwood Dr, Jackson, MS 39212
$492
Cash flow
17.4%
Cash-on-Cash Return
17.9%
Cap rate
2.4%
Rent to Value Ratio
Active
$39,000
4
bds
|
2
ba
|
0
sqft
|
built
1950
3920 Walker Ave, Jackson, MS 39212
$703
Cash flow
21.0%
Cash-on-Cash Return
21.6%
Cap rate
2.8%
Rent to Value Ratio
Active
$199,500
4
bds
|
2
ba
|
0
sqft
|
built
1967
145 Swan Lake Dr, Jackson, MS 39212
$-138
Cash flow
-3.6%
Cash-on-Cash Return
4.8%
Cap rate
0.8%
Rent to Value Ratio
Active
$74,500
3
bds
|
2
ba
|
0
sqft
|
built
1958
1735 Woody Dr, Jackson, MS 39212
$672
Cash flow
10.5%
Cash-on-Cash Return
10.8%
Cap rate
1.5%
Rent to Value Ratio
Active
$74,500
3
bds
|
2
ba
|
0
sqft
|
built
1967
1954 Longwood Dr, Jackson, MS 39212
$852
Cash flow
13.3%
Cash-on-Cash Return
13.7%
Cap rate
1.9%
Rent to Value Ratio
Active
$64,000
3
bds
|
1
ba
|
0
sqft
|
built
1960
412 Cameron St, Jackson, MS 39212
$758
Cash flow
13.8%
Cash-on-Cash Return
14.2%
Cap rate
1.9%
Rent to Value Ratio
Active
$95,000
4
bds
|
3
ba
|
0
sqft
|
built
1959
1660 Smallwood St, Jackson, MS 39212
$329
Cash flow
18.1%
Cash-on-Cash Return
9.8%
Cap rate
1.5%
Rent to Value Ratio
Active
$140,000
3
bds
|
2
ba
|
0
sqft
|
built
1984
430 Trent Dr, Jackson, MS 39212
$182
Cash flow
6.8%
Cash-on-Cash Return
7.2%
Cap rate
1.0%
Rent to Value Ratio
Active
$86,000
3
bds
|
2
ba
|
0
sqft
|
built
1969
1405 Wooddell Dr, Jackson, MS 39212
$385
Cash flow
23.4%
Cash-on-Cash Return
11.1%
Cap rate
1.5%
Rent to Value Ratio

Active
$160,000
3
bds
|
2
ba
|
0
sqft
|
built
1960
3246 Longwood Dr, Jackson, MS 39212
$144
Cash flow
4.7%
Cash-on-Cash Return
6.8%
Cap rate
0.9%
Rent to Value Ratio
Active
$205,900
4
bds
|
3
ba
|
0
sqft
|
built
1976
909 Brookford Ct, Jackson, MS 39212
$-54
Cash flow
-1.4%
Cash-on-Cash Return
5.4%
Cap rate
0.8%
Rent to Value Ratio
Active
$155,000
3
bds
|
2
ba
|
0
sqft
|
built
1972
3432 Dundee Ln, Jackson, MS 39212
$405
Cash flow
13.6%
Cash-on-Cash Return
8.8%
Cap rate
1.1%
Rent to Value Ratio
Active
$29,500
3
bds
|
1
ba
|
0
sqft
|
built
1954
2632 Shannon St, Jackson, MS 39212
$617
Cash flow
24.4%
Cash-on-Cash Return
25.1%
Cap rate
3.4%
Rent to Value Ratio
Active
$110,000
3
bds
|
2
ba
|
0
sqft
|
built
1951
4839 Old Byram Rd, Jackson, MS 39212
$312
Cash flow
14.8%
Cash-on-Cash Return
9.1%
Cap rate
1.3%
Rent to Value Ratio
Active
$179,900
3
bds
|
2
ba
|
0
sqft
|
built
1979
5209 Sycamore Dr, Jackson, MS 39212
$195
Cash flow
5.7%
Cash-on-Cash Return
7.0%
Cap rate
0.9%
Rent to Value Ratio
Active
$118,000
3
bds
|
2
ba
|
0
sqft
|
built
1981
126 Pine Cv, Jackson, MS 39212
$333
Cash flow
14.7%
Cash-on-Cash Return
9.1%
Cap rate
1.3%
Rent to Value Ratio
Active
$37,000
3
bds
|
1
ba
|
0
sqft
|
built
1950
3159 Alameda Dr, Jackson, MS 39212
$675
Cash flow
21.3%
Cash-on-Cash Return
21.9%
Cap rate
3.0%
Rent to Value Ratio
Active
$80,000
4
bds
|
3
ba
|
0
sqft
|
built
1962
3121 Woodville Cir, Jackson, MS 39212
$462
Cash flow
30.1%
Cash-on-Cash Return
12.6%
Cap rate
1.8%
Rent to Value Ratio
Active
$200,999
3
bds
|
2
ba
|
0
sqft
|
built
1974
107 Carriage Hills Dr, Jackson, MS 39212
$231
Cash flow
6.0%
Cash-on-Cash Return
7.1%
Cap rate
0.9%
Rent to Value Ratio
Active
$79,200
3
bds
|
2
ba
|
0
sqft
|
built
1951
3650 Meadow Ln, Jackson, MS 39212
$306
Cash flow
20.2%
Cash-on-Cash Return
10.3%
Cap rate
1.4%
Rent to Value Ratio
Active
$38,000
3
bds
|
2
ba
|
0
sqft
|
built
1950
267 Woody Dr, Jackson, MS 39212
$675
Cash flow
20.7%
Cash-on-Cash Return
21.3%
Cap rate
2.9%
Rent to Value Ratio
Active
$52,000
3
bds
|
2
ba
|
0
sqft
|
built
1964
3150 Ponderosa Dr, Jackson, MS 39212
$626
Cash flow
14.0%
Cash-on-Cash Return
14.4%
Cap rate
2.1%
Rent to Value Ratio
Active
$30,000
3
bds
|
1
ba
|
0
sqft
|
built
1950
2821 Greenview Dr, Jackson, MS 39212
$553
Cash flow
21.5%
Cash-on-Cash Return
22.1%
Cap rate
3.0%
Rent to Value Ratio