39503 Investment Properties for Sale
Browse homes for sale and investment properties in 39503. Refine your search by price, property type, or more.
Best cash flowing properties in 39503
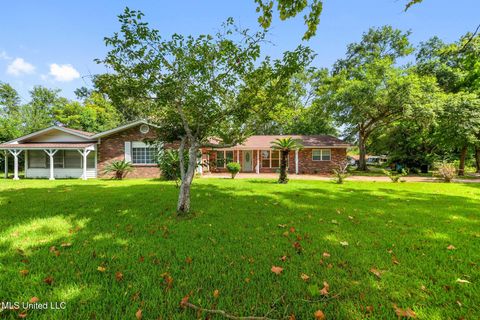
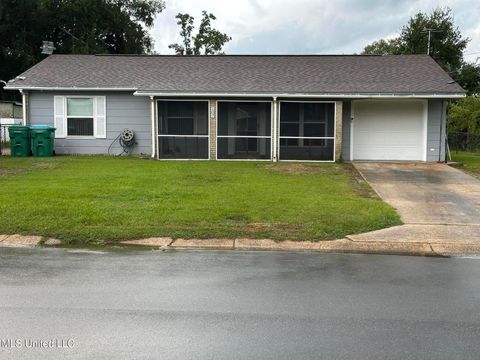
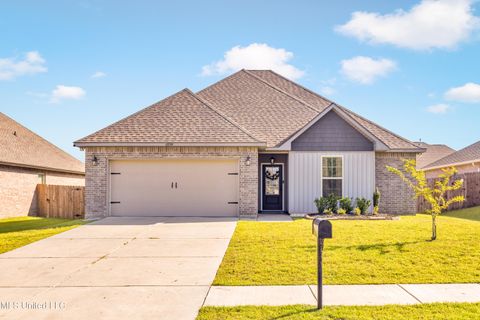
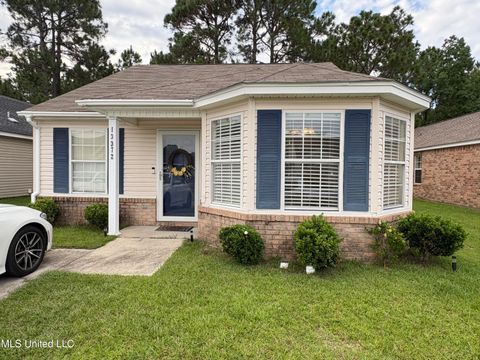
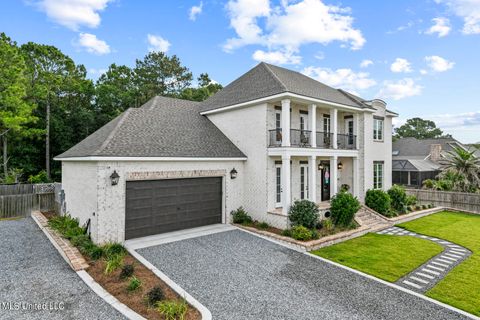
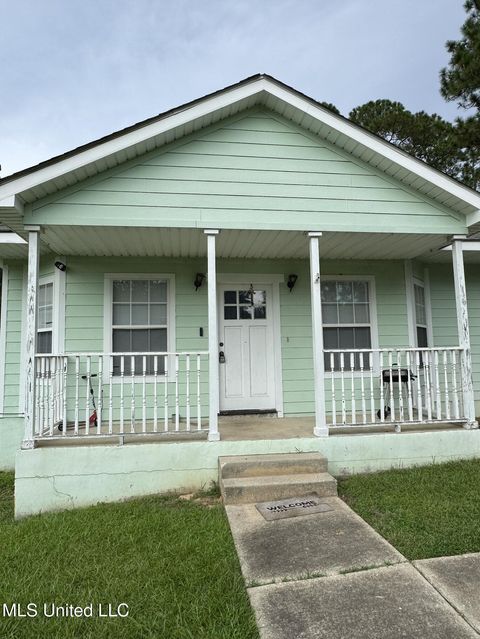
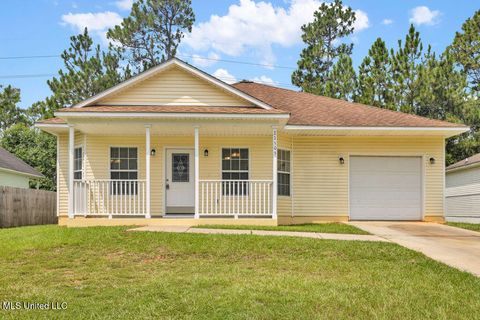
Active
$247,500
4
bds
|
3
ba
|
0
sqft
|
built
1972
10463 Wade Ln, Gulfport, MS 39503
$493
Cash flow
10.4%
Cash-on-Cash Return
8.1%
Cap rate
1.0%
Rent to Value Ratio
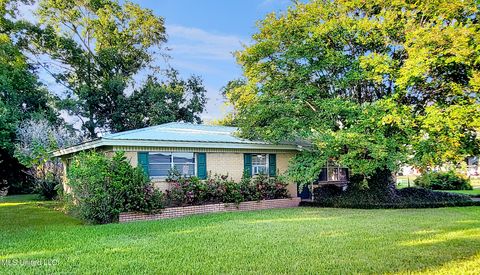
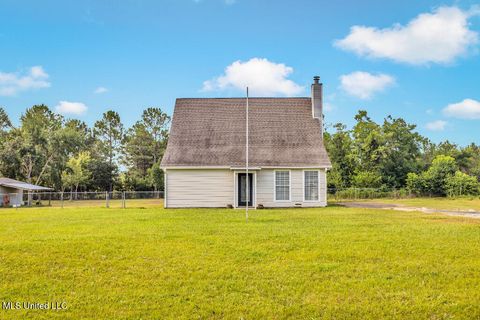
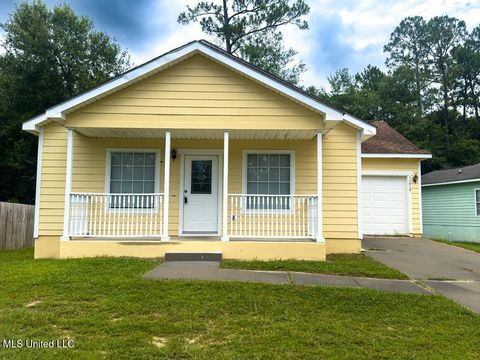
Active
$140,000
3
bds
|
2
ba
|
0
sqft
|
built
1962
14224 Dedeaux Rd, Gulfport, MS 39503
$441
Cash flow
16.4%
Cash-on-Cash Return
9.5%
Cap rate
1.1%
Rent to Value Ratio
120 out of 129 properties for sale in 39503
Limited Results Shown
Create a free account, or log in to reveal all property listings and enjoy the complete experience.

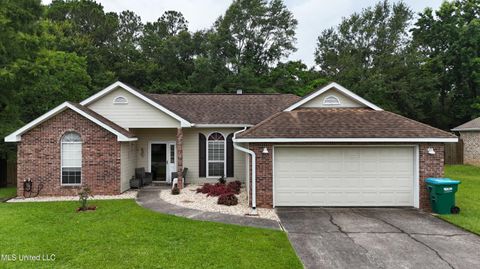
Active
$209,000
3
bds
|
2
ba
|
0
sqft
|
built
2009
13670 Skye Ct, Gulfport, MS 39503
$169
Cash flow
4.2%
Cash-on-Cash Return
6.6%
Cap rate
0.9%
Rent to Value Ratio
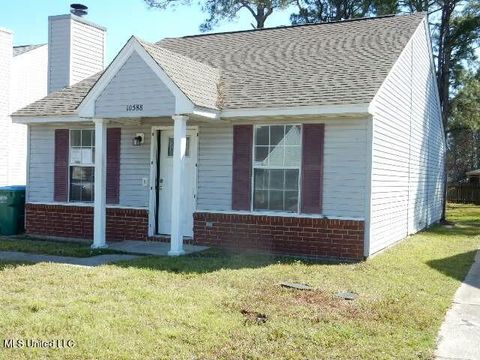
Active
$100,800
3
bds
|
1
ba
|
0
sqft
|
built
1998
10588 Sharp Blvd, Gulfport, MS 39503
$397
Cash flow
20.5%
Cash-on-Cash Return
10.4%
Cap rate
1.4%
Rent to Value Ratio
Active
$178,000
3
bds
|
2
ba
|
0
sqft
|
built
1967
119 Gahan Dr, Gulfport, MS 39503
$216
Cash flow
6.3%
Cash-on-Cash Return
7.1%
Cap rate
0.9%
Rent to Value Ratio
Active
$175,000
3
bds
|
2
ba
|
0
sqft
|
built
1964
107 Estes St, Gulfport, MS 39503
$227
Cash flow
6.8%
Cash-on-Cash Return
7.2%
Cap rate
0.9%
Rent to Value Ratio
Active
$165,000
3
bds
|
2
ba
|
0
sqft
|
built
1971
506 Harvey Ave, Gulfport, MS 39503
$271
Cash flow
8.6%
Cash-on-Cash Return
7.7%
Cap rate
1.0%
Rent to Value Ratio

Active
$164,900
2
bds
|
2
ba
|
0
sqft
|
built
1990
12297 Windward Dr, Gulfport, MS 39503
$70
Cash flow
2.2%
Cash-on-Cash Return
6.2%
Cap rate
0.8%
Rent to Value Ratio
Active
$130,000
3
bds
|
3
ba
|
0
sqft
|
built
1962
504 N Wilson Blvd, Gulfport, MS 39503
$160
Cash flow
6.4%
Cash-on-Cash Return
7.2%
Cap rate
1.0%
Rent to Value Ratio
Active
$294,900
5
bds
|
4
ba
|
0
sqft
|
built
2015
14794 Canal Crossing Blvd, Gulfport, MS 39503
$162
Cash flow
2.9%
Cash-on-Cash Return
6.3%
Cap rate
0.8%
Rent to Value Ratio
Active
$255,000
3
bds
|
2
ba
|
0
sqft
|
built
2023
16974 Alcorn Ave, Gulfport, MS 39503
$-11
Cash flow
-0.2%
Cash-on-Cash Return
5.6%
Cap rate
0.8%
Rent to Value Ratio
Active
$200,000
2
bds
|
2
ba
|
0
sqft
|
built
1968
14160 John Clark Rd, Gulfport, MS 39503
$125
Cash flow
3.3%
Cash-on-Cash Return
6.4%
Cap rate
0.8%
Rent to Value Ratio
Active
$280,875
3
bds
|
2
ba
|
0
sqft
|
built
2000
13342 Carriage Cir, Gulfport, MS 39503
$-78
Cash flow
-1.4%
Cash-on-Cash Return
5.3%
Cap rate
0.7%
Rent to Value Ratio
Active
$129,900
3
bds
|
2
ba
|
0
sqft
|
built
1969
118 Clarence Dr, Gulfport, MS 39503
$321
Cash flow
12.9%
Cash-on-Cash Return
8.6%
Cap rate
1.2%
Rent to Value Ratio
Active
$152,000
3
bds
|
2
ba
|
0
sqft
|
built
2004
13372 Chris Dr, Gulfport, MS 39503
$337
Cash flow
11.6%
Cash-on-Cash Return
8.3%
Cap rate
1.1%
Rent to Value Ratio
Active
$220,000
3
bds
|
2
ba
|
0
sqft
|
built
1982
16170 Kenwood Dr, Gulfport, MS 39503
$-11
Cash flow
-0.3%
Cash-on-Cash Return
5.6%
Cap rate
0.8%
Rent to Value Ratio
Active
$139,900
3
bds
|
2
ba
|
0
sqft
|
built
1973
2614 George St, Gulfport, MS 39503
$146
Cash flow
5.4%
Cash-on-Cash Return
6.9%
Cap rate
0.9%
Rent to Value Ratio
Active
$159,900
3
bds
|
2
ba
|
0
sqft
|
built
1970
214 Janelle Dr, Gulfport, MS 39503
$248
Cash flow
8.1%
Cash-on-Cash Return
7.5%
Cap rate
1.0%
Rent to Value Ratio
Active
$839,000
5
bds
|
4
ba
|
0
sqft
|
built
2020
10788 E Taylor Rd, Gulfport, MS 39503
$-1,324
Cash flow
-8.2%
Cash-on-Cash Return
3.8%
Cap rate
0.5%
Rent to Value Ratio
Active
$230,000
4
bds
|
3
ba
|
0
sqft
|
built
1972
12394 Cypress Dr, Gulfport, MS 39503
$325
Cash flow
7.4%
Cash-on-Cash Return
7.4%
Cap rate
1.0%
Rent to Value Ratio

Active
$222,000
3
bds
|
2
ba
|
0
sqft
|
built
2003
16091 Kaila Ct, Gulfport, MS 39503
$148
Cash flow
3.5%
Cash-on-Cash Return
6.5%
Cap rate
0.9%
Rent to Value Ratio

Active
$370,900
3
bds
|
2
ba
|
0
sqft
|
built
2008
13570 Brayton Blvd, Gulfport, MS 39503
$-348
Cash flow
-4.9%
Cash-on-Cash Return
4.6%
Cap rate
0.6%
Rent to Value Ratio
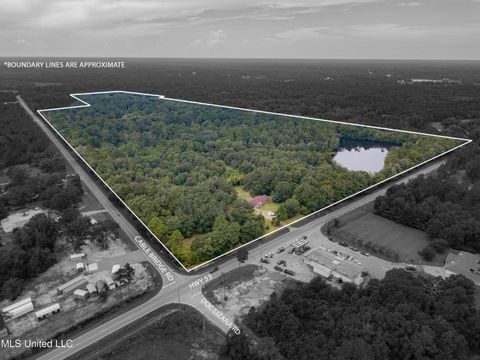
Active
$700,101
4
bds
|
2
ba
|
0
sqft
|
built
1952
22437 Highway 53, Gulfport, MS 39503
$-2,071
Cash flow
-15.4%
Cash-on-Cash Return
2.1%
Cap rate
0.3%
Rent to Value Ratio
Active
$189,500
2
bds
|
2
ba
|
0
sqft
|
built
2002
18053 Mustang Pl, Gulfport, MS 39503
$4
Cash flow
0.1%
Cash-on-Cash Return
5.7%
Cap rate
0.8%
Rent to Value Ratio

Active
$181,000
3
bds
|
2
ba
|
0
sqft
|
built
2007
12144 Harmony Cir, Gulfport, MS 39503
$334
Cash flow
9.6%
Cash-on-Cash Return
7.9%
Cap rate
1.1%
Rent to Value Ratio
Active
$224,499
3
bds
|
2
ba
|
0
sqft
|
built
1995
12247 Charwood Ave, Gulfport, MS 39503
$145
Cash flow
3.4%
Cash-on-Cash Return
6.5%
Cap rate
0.8%
Rent to Value Ratio
Active
$144,900
3
bds
|
2
ba
|
0
sqft
|
built
2007
11623 Acorn Dr, Gulfport, MS 39503
$94
Cash flow
3.4%
Cash-on-Cash Return
6.5%
Cap rate
0.9%
Rent to Value Ratio
Active
$349,900
3
bds
|
3
ba
|
0
sqft
|
built
2021
10545 W Landon Green Cir, Gulfport, MS 39503
$-342
Cash flow
-5.1%
Cash-on-Cash Return
4.5%
Cap rate
0.6%
Rent to Value Ratio
Active
$194,250
4
bds
|
2
ba
|
0
sqft
|
built
2002
11298 Cypress Bayou Dr, Gulfport, MS 39503
$287
Cash flow
7.7%
Cash-on-Cash Return
7.5%
Cap rate
1.0%
Rent to Value Ratio
Active
$280,000
3
bds
|
2
ba
|
0
sqft
|
built
1996
11490 Savannah Pl, Gulfport, MS 39503
$79
Cash flow
1.5%
Cash-on-Cash Return
6.0%
Cap rate
0.8%
Rent to Value Ratio

Active
$230,000
3
bds
|
2
ba
|
0
sqft
|
built
1969
15309 Royal St, Gulfport, MS 39503
$31
Cash flow
0.7%
Cash-on-Cash Return
5.8%
Cap rate
0.7%
Rent to Value Ratio

Active
$374,900
4
bds
|
2
ba
|
0
sqft
|
built
2021
12082 Michael Grace Dr, Gulfport, MS 39503
$-238
Cash flow
-3.3%
Cash-on-Cash Return
4.9%
Cap rate
0.7%
Rent to Value Ratio
Active
$176,900
3
bds
|
2
ba
|
0
sqft
|
built
2008
11505 Acorn Dr, Gulfport, MS 39503
$157
Cash flow
4.6%
Cash-on-Cash Return
6.7%
Cap rate
0.9%
Rent to Value Ratio

Active
$289,900
3
bds
|
2
ba
|
0
sqft
|
built
2011
13728 Ridgehaven Way, Gulfport, MS 39503
$-96
Cash flow
-1.7%
Cash-on-Cash Return
5.3%
Cap rate
0.8%
Rent to Value Ratio

Active
$210,000
3
bds
|
2
ba
|
0
sqft
|
built
2009
14951 Audubon Lake Blvd, Gulfport, MS 39503
$77
Cash flow
1.9%
Cash-on-Cash Return
6.1%
Cap rate
0.9%
Rent to Value Ratio
Active
$165,000
3
bds
|
2
ba
|
0
sqft
|
built
2008
11619 Acorn Dr, Gulfport, MS 39503
$157
Cash flow
5.0%
Cash-on-Cash Return
6.8%
Cap rate
0.9%
Rent to Value Ratio
Active
$460,000
5
bds
|
3
ba
|
0
sqft
|
built
2021
12083 Doc Sheffield Rd, Gulfport, MS 39503
$-404
Cash flow
-4.6%
Cash-on-Cash Return
4.6%
Cap rate
0.7%
Rent to Value Ratio

Active
$245,000
4
bds
|
2
ba
|
0
sqft
|
built
2015
18420 Devin Ct, Gulfport, MS 39503
$129
Cash flow
2.7%
Cash-on-Cash Return
6.3%
Cap rate
0.8%
Rent to Value Ratio
Active
$480,000
4
bds
|
3
ba
|
0
sqft
|
built
2022
1415 Alphabet Rd, Gulfport, MS 39503
$-732
Cash flow
-8.0%
Cash-on-Cash Return
3.9%
Cap rate
0.6%
Rent to Value Ratio
Active
$303,900
4
bds
|
2
ba
|
0
sqft
|
built
2002
13288 Roxbury Pl, Gulfport, MS 39503
$195
Cash flow
3.3%
Cash-on-Cash Return
6.4%
Cap rate
0.8%
Rent to Value Ratio