39532 Investment Properties for Sale
Browse homes for sale and investment properties in 39532. Refine your search by price, property type, or more.
Best cash flowing properties in 39532
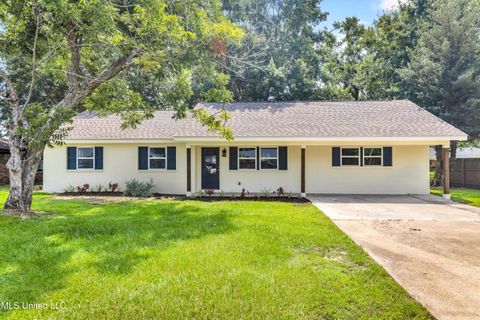
Active
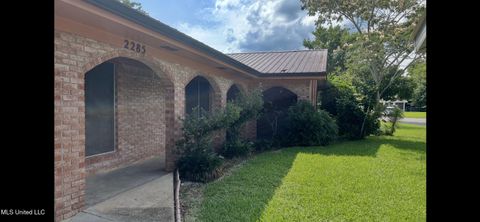
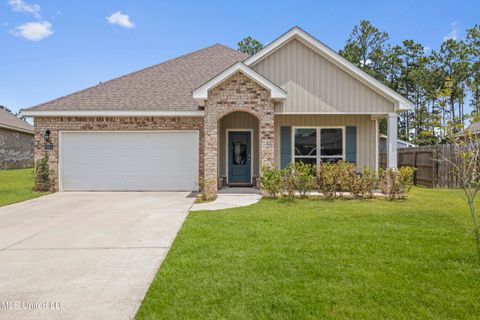
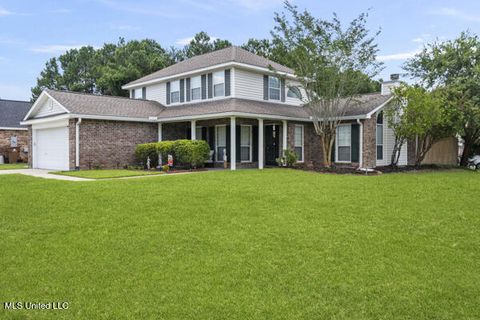
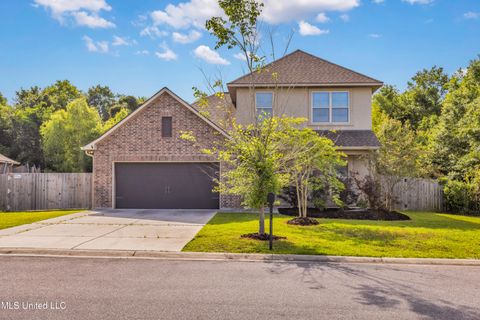
$229,000
4
bds
|
2
ba
|
0
sqft
|
built
1970
2285 Harkness Ct, Biloxi, MS 39532
$468
Cash flow
10.7%
Cash-on-Cash Return
8.1%
Cap rate
1.0%
Rent to Value Ratio
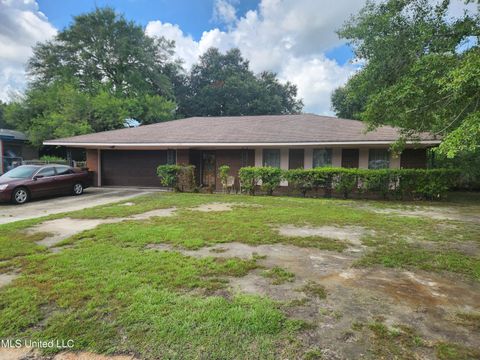
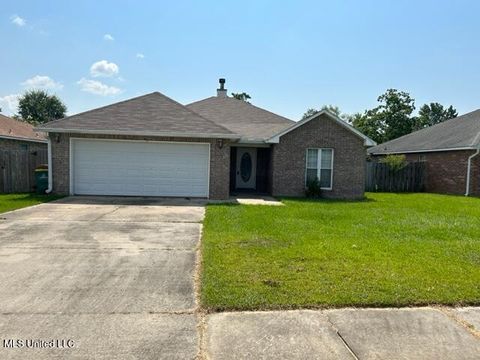
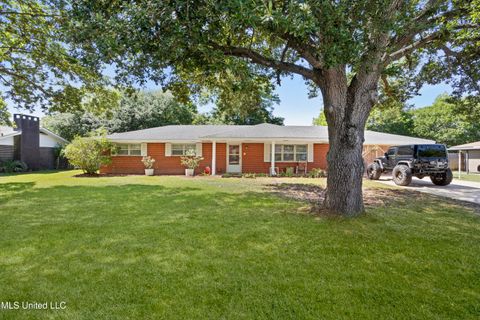
Active
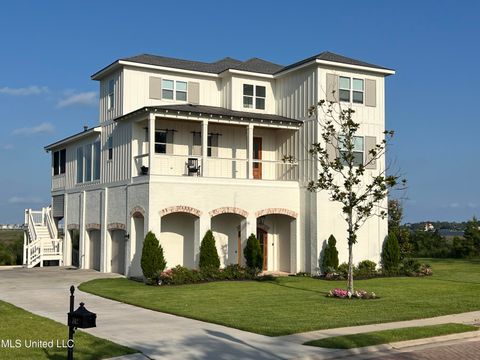
$155,000
3
bds
|
2
ba
|
0
sqft
|
built
1974
2285 Windsor Ct, Biloxi, MS 39532
$435
Cash flow
14.6%
Cash-on-Cash Return
9.1%
Cap rate
1.2%
Rent to Value Ratio
46 out of 53 properties for sale in 39532
Limited Results Shown
Create a free account, or log in to reveal all property listings and enjoy the complete experience.
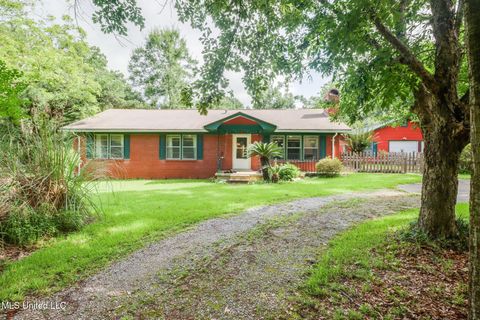
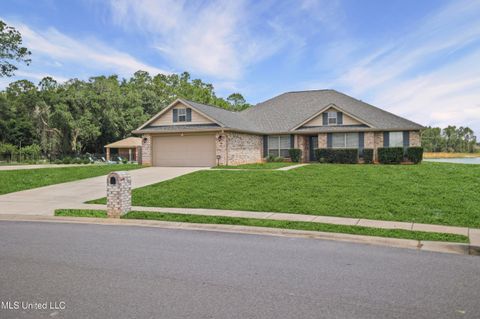
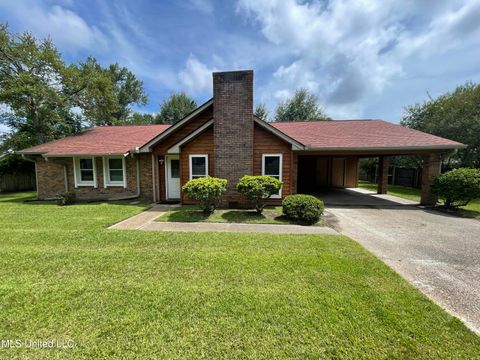
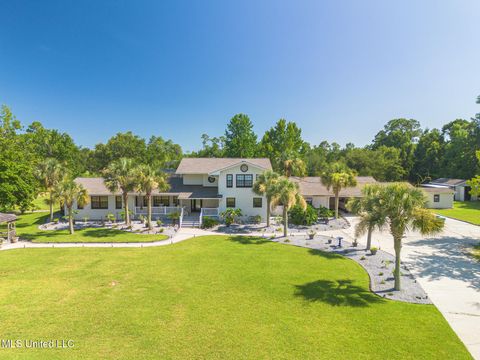
Active
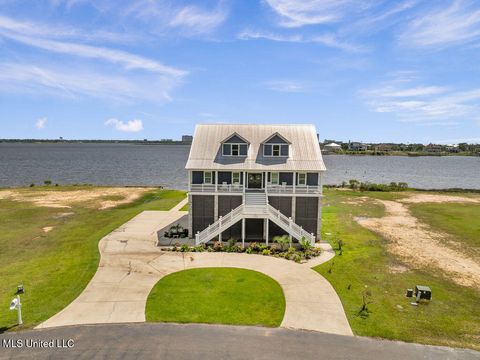
$328,900
3
bds
|
2
ba
|
0
sqft
|
built
1970
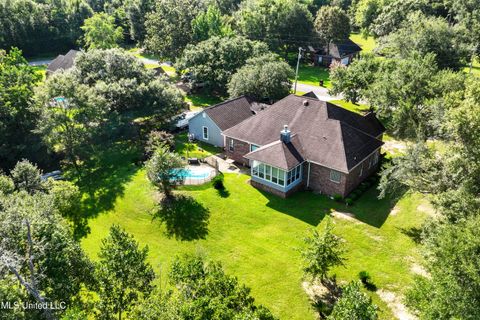
8474 Woolmarket Rd, Biloxi, MS 39532
$-213
Cash flow
-3.4%
Cash-on-Cash Return
4.9%
Cap rate
0.6%
Rent to Value Ratio
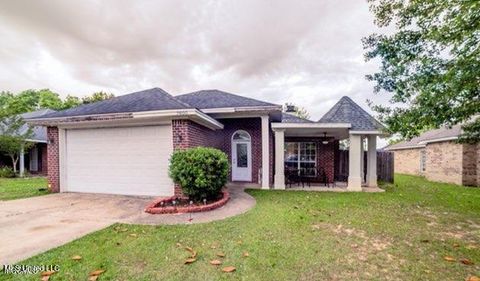
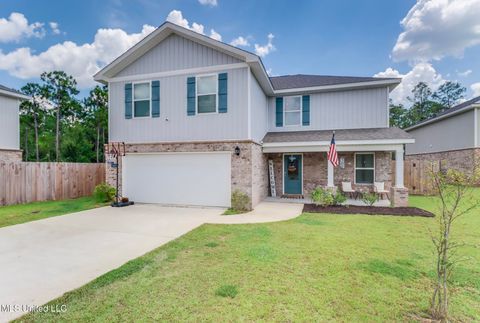
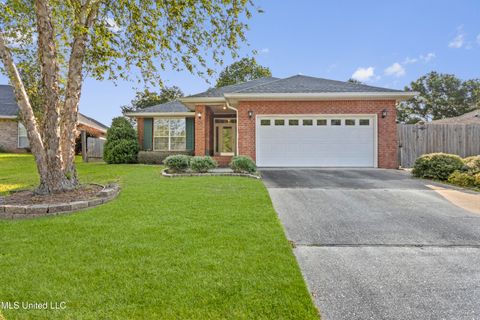
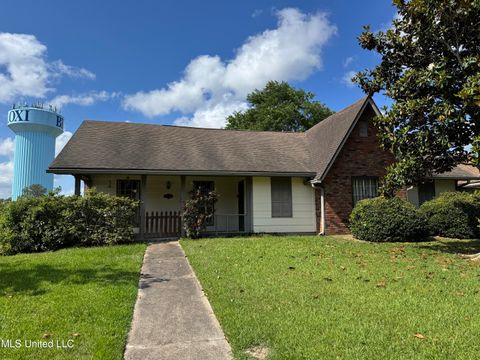
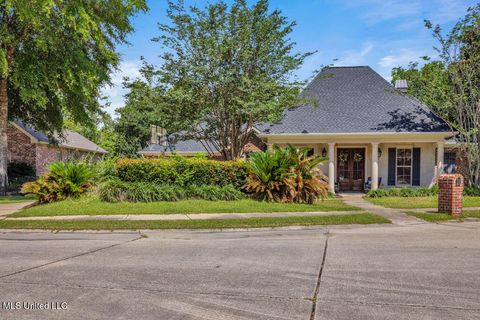
Active
$219,000
3
bds
|
2
ba
|
0
sqft
|
built
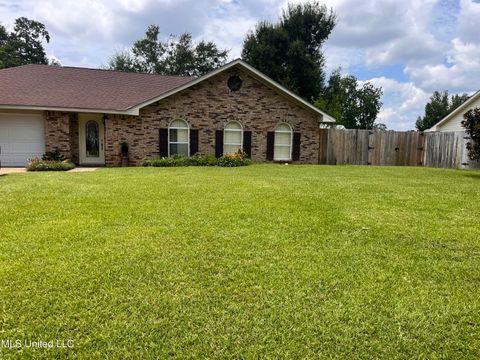
2005
7400 Southwind Dr, Biloxi, MS 39532
$388
Cash flow
9.2%
Cash-on-Cash Return
7.8%
Cap rate
1.0%
Rent to Value Ratio
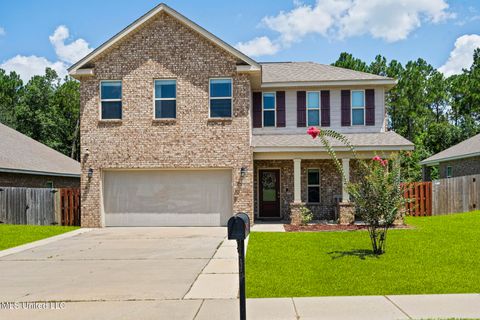
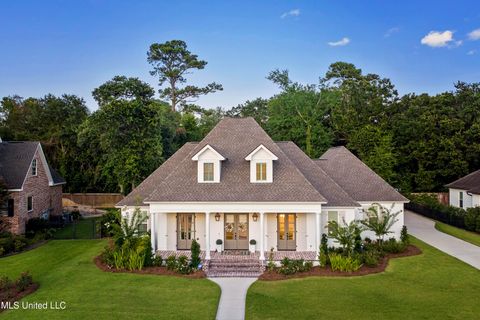
Active
$469,000
4
bds
|
3
ba
|
0
sqft
|
built
2006
11827 River Estates Cir, Biloxi, MS 39532
$-446
Cash flow
-5.0%
Cash-on-Cash Return
4.5%
Cap rate
0.6%
Rent to Value Ratio
Active
$574,000
3
bds
|
2
ba
|
0
sqft
|
built
1959
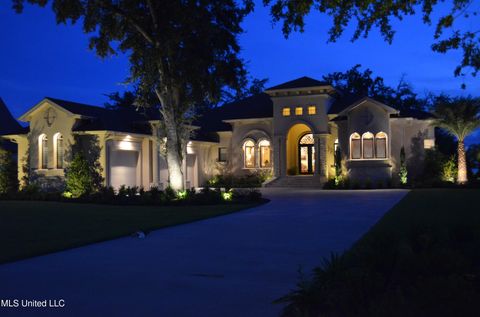
15173 Lorraine Rd, Biloxi, MS 39532
$-1,080
Cash flow
-9.8%
Cash-on-Cash Return
3.4%
Cap rate
0.4%
Rent to Value Ratio
Active
$257,700
4
bds
|
3
ba
|
0
sqft
|
built
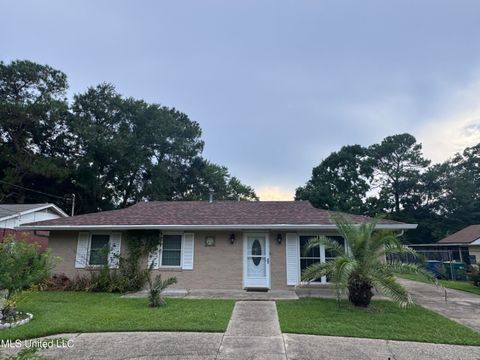
1970
7650 Lexington Dr, Biloxi, MS 39532
$347
Cash flow
7.0%
Cash-on-Cash Return
7.3%
Cap rate
0.9%
Rent to Value Ratio
Active
$325,000
3
bds
|
2
ba
|
0
sqft
|
built
1980
615 N Haven Dr, Biloxi, MS 39532
$61
Cash flow
1.0%
Cash-on-Cash Return
5.9%
Cap rate
0.7%
Rent to Value Ratio
Active
$225,000
3
bds
|
2
ba
|
0
sqft
|
built
1968
2223 Popps Ferry Rd, Biloxi, MS 39532
$60
Cash flow
1.4%
Cash-on-Cash Return
6.0%
Cap rate
0.8%
Rent to Value Ratio
Active
$227,900
3
bds
|
2
ba
|
0
sqft
|
built
2000
10538 Shore Cv, Biloxi, MS 39532
$-96
Cash flow
-2.2%
Cash-on-Cash Return
5.2%
Cap rate
0.7%
Rent to Value Ratio
Active
$385,000
4
bds
|
2
ba
|
0
sqft
|
built
2018
6236 Emerald Lake Dr, Biloxi, MS 39532
$-128
Cash flow
-1.7%
Cash-on-Cash Return
5.3%
Cap rate
0.7%
Rent to Value Ratio
Active
$349,000
4
bds
|
3
ba
|
0
sqft
|
built
2023
5416 Leeds Ln, Biloxi, MS 39532
$-189
Cash flow
-2.8%
Cash-on-Cash Return
5.0%
Cap rate
0.7%
Rent to Value Ratio
Active
$1,699,999
3
bds
|
4
ba
|
0
sqft
|
built
2012
765 Destiny Plantation Blvd, Biloxi, MS 39532
$-4,502
Cash flow
-13.8%
Cash-on-Cash Return
2.5%
Cap rate
0.4%
Rent to Value Ratio
Active
$311,900
4
bds
|
3
ba
|
0
sqft
|
built
2018
5367 Overland Dr, Biloxi, MS 39532
$-52
Cash flow
-0.9%
Cash-on-Cash Return
5.5%
Cap rate
0.7%
Rent to Value Ratio
Active
$199,900
3
bds
|
2
ba
|
0
sqft
|
built
1984
2033 S Hill Dr, Biloxi, MS 39532
$230
Cash flow
6.0%
Cash-on-Cash Return
7.1%
Cap rate
0.9%
Rent to Value Ratio
Active
$280,000
4
bds
|
2
ba
|
0
sqft
|
built
2006
15003 Greenwell Cir, Biloxi, MS 39532
$202
Cash flow
3.8%
Cash-on-Cash Return
6.5%
Cap rate
0.8%
Rent to Value Ratio
Active
$295,000
4
bds
|
2
ba
|
0
sqft
|
built
2021
5529 Overland Dr, Biloxi, MS 39532
$111
Cash flow
2.0%
Cash-on-Cash Return
6.1%
Cap rate
0.8%
Rent to Value Ratio
Active
$899,500
5
bds
|
6
ba
|
0
sqft
|
built
1965
15409 Sequoia Ave, Biloxi, MS 39532
$-2,583
Cash flow
-15.0%
Cash-on-Cash Return
2.2%
Cap rate
0.3%
Rent to Value Ratio
Active
$229,999
3
bds
|
2
ba
|
0
sqft
|
built
1978
2158 Baywood Dr, Biloxi, MS 39532
$279
Cash flow
6.3%
Cash-on-Cash Return
7.1%
Cap rate
0.9%
Rent to Value Ratio

Active
$655,000
3
bds
|
3
ba
|
0
sqft
|
built
2006
6405 Seawinds Blvd, Biloxi, MS 39532
$-1,091
Cash flow
-8.7%
Cash-on-Cash Return
3.7%
Cap rate
0.5%
Rent to Value Ratio

Active
$285,000
4
bds
|
2
ba
|
0
sqft
|
built
1969
15917 Big Ridge Rd, Biloxi, MS 39532
$-313
Cash flow
-5.7%
Cash-on-Cash Return
4.4%
Cap rate
0.6%
Rent to Value Ratio
Active
$929,900
4
bds
|
5
ba
|
0
sqft
|
built
2023
791 Destiny Plantation Blvd, Biloxi, MS 39532
$-3,174
Cash flow
-17.8%
Cash-on-Cash Return
1.6%
Cap rate
0.3%
Rent to Value Ratio
Active
$379,900
2
bds
|
3
ba
|
0
sqft
|
built
2010
15900 Groue Ave, Biloxi, MS 39532
$-765
Cash flow
-10.5%
Cash-on-Cash Return
3.3%
Cap rate
0.5%
Rent to Value Ratio
Active
$316,777
5
bds
|
3
ba
|
0
sqft
|
built
2017
15604 Ollie Ln, Biloxi, MS 39532
$347
Cash flow
5.7%
Cash-on-Cash Return
7.0%
Cap rate
0.9%
Rent to Value Ratio
Active
$279,900
4
bds
|
3
ba
|
0
sqft
|
built
1979
12778 Tiffany Ln, Biloxi, MS 39532
$-280
Cash flow
-5.2%
Cash-on-Cash Return
4.5%
Cap rate
0.6%
Rent to Value Ratio
Active
$450,000
3
bds
|
2
ba
|
0
sqft
|
built
1964
11001 Shorecrest Rd, Biloxi, MS 39532
$-148
Cash flow
-1.7%
Cash-on-Cash Return
5.3%
Cap rate
0.7%
Rent to Value Ratio
Active
$389,000
4
bds
|
3
ba
|
0
sqft
|
built
2021
6225 Emerald Lake Dr, Biloxi, MS 39532
$-97
Cash flow
-1.3%
Cash-on-Cash Return
5.4%
Cap rate
0.7%
Rent to Value Ratio
Active
$230,000
2
bds
|
2
ba
|
0
sqft
|
built
2008
15107 Lemoyne Blvd, Biloxi, MS 39532
$2
Cash flow
0.0%
Cash-on-Cash Return
5.7%
Cap rate
0.7%
Rent to Value Ratio
Active
$300,000
4
bds
|
2
ba
|
0
sqft
|
built
2023
15712 Poydras Cir, Biloxi, MS 39532
$111
Cash flow
1.9%
Cash-on-Cash Return
6.1%
Cap rate
0.8%
Rent to Value Ratio
Active
$385,000
3
bds
|
2
ba
|
0
sqft
|
built
2009
707 Holly Hills Dr, Biloxi, MS 39532
$112
Cash flow
1.5%
Cash-on-Cash Return
6.0%
Cap rate
0.8%
Rent to Value Ratio

Active
$349,000
4
bds
|
2
ba
|
0
sqft
|
built
2016
709 Champagne Dr, Biloxi, MS 39532
$36
Cash flow
0.5%
Cash-on-Cash Return
5.8%
Cap rate
0.8%
Rent to Value Ratio

Active
$246,500
4
bds
|
2
ba
|
0
sqft
|
built
1997
10566 W River Vue, Biloxi, MS 39532
$204
Cash flow
4.3%
Cash-on-Cash Return
6.7%
Cap rate
0.9%
Rent to Value Ratio
Active
$315,900
4
bds
|
3
ba
|
0
sqft
|
built
2001
1567 Applewood Ct, Biloxi, MS 39532
$71
Cash flow
1.2%
Cash-on-Cash Return
5.9%
Cap rate
0.8%
Rent to Value Ratio
Active
$1,350,000
5
bds
|
4
ba
|
0
sqft
|
built
2020
742 Destiny Plantation Blvd, Biloxi, MS 39532
$-3,096
Cash flow
-12.0%
Cash-on-Cash Return
2.9%
Cap rate
0.4%
Rent to Value Ratio
Active
$1,390,000
3
bds
|
4
ba
|
0
sqft
|
built
2020
15225 Branigar, Biloxi, MS 39532
$-3,108
Cash flow
-11.7%
Cash-on-Cash Return
3.0%
Cap rate
0.4%
Rent to Value Ratio
Active
$434,999
4
bds
|
3
ba
|
0
sqft
|
built
2005
769 Mc Lane Ln, Biloxi, MS 39532
$-386
Cash flow
-4.6%
Cash-on-Cash Return
4.6%
Cap rate
0.6%
Rent to Value Ratio
Active
$347,400
4
bds
|
3
ba
|
0
sqft
|
built
2019
832 Reunion Place Cir, Biloxi, MS 39532
$-219
Cash flow
-3.3%
Cash-on-Cash Return
4.9%
Cap rate
0.7%
Rent to Value Ratio

Active
$369,000
4
bds
|
2
ba
|
0
sqft
|
built
2021
12035 Schooner Cv, Biloxi, MS 39532
$-430
Cash flow
-6.1%
Cash-on-Cash Return
4.3%
Cap rate
0.6%
Rent to Value Ratio
Active
$218,500
3
bds
|
2
ba
|
0
sqft
|
built
1966
2208 Popps Ferry Rd, Biloxi, MS 39532
$325
Cash flow
7.8%
Cash-on-Cash Return
7.5%
Cap rate
0.9%
Rent to Value Ratio

Active
$365,000
4
bds
|
3
ba
|
0
sqft
|
built
2001
2032 Englewood Dr, Biloxi, MS 39532
$-62
Cash flow
-0.9%
Cash-on-Cash Return
5.5%
Cap rate
0.7%
Rent to Value Ratio