39560 Investment Properties for Sale
Browse homes for sale and investment properties in 39560. Refine your search by price, property type, or more.
Best cash flowing properties in 39560

Active
$114,500
1
bds
|
1
ba
|
0
sqft
|
built
1999
20294 Daugherty Rd, Long Beach, MS 39560
$637
Cash flow
29.0%
Cash-on-Cash Return
12.4%
Cap rate
1.6%
Rent to Value Ratio
Active
$135,000
3
bds
|
1
ba
|
0
sqft
|
built
1966
117 Gandy Cir, Long Beach, MS 39560
$339
Cash flow
13.1%
Cash-on-Cash Return
8.7%
Cap rate
1.2%
Rent to Value Ratio
43 out of 82 properties for sale in 39560
Limited Results Shown
Create a free account, or log in to reveal all property listings and enjoy the complete experience.

Active
$295,000
3
bds
|
2
ba
|
0
sqft
|
built
1950
121 E Second St, Long Beach, MS 39560
$-53
Cash flow
-0.9%
Cash-on-Cash Return
5.5%
Cap rate
0.7%
Rent to Value Ratio
Active
$175,000
3
bds
|
2
ba
|
0
sqft
|
built
1995
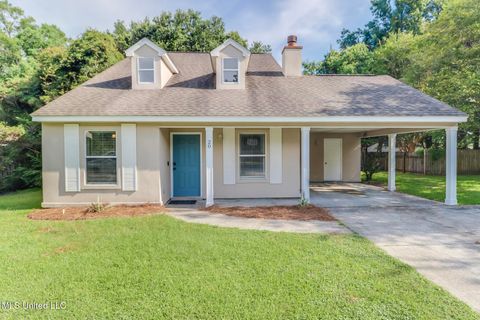
20 Oakmont Pl, Long Beach, MS 39560
$89
Cash flow
2.7%
Cash-on-Cash Return
6.3%
Cap rate
0.9%
Rent to Value Ratio
Active
$280,000
2
bds
|
2
ba
|
0
sqft
|
built
2016
74 Oak Alley Ln, Long Beach, MS 39560
$-338
Cash flow
-6.3%
Cash-on-Cash Return
4.2%
Cap rate
0.7%
Rent to Value Ratio
Active
$249,900
3
bds
|
2
ba
|
0
sqft
|
built
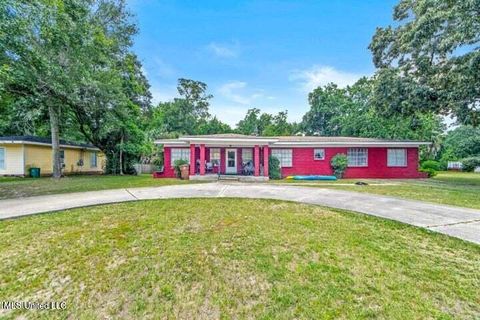
1965
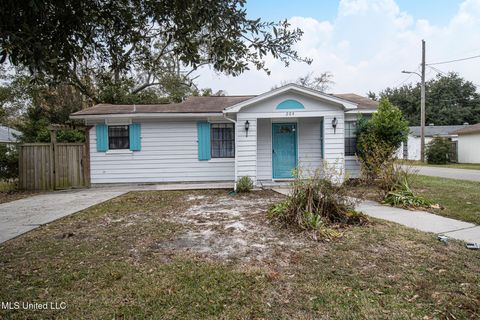
112 Olson Ave, Long Beach, MS 39560
$100
Cash flow
2.1%
Cash-on-Cash Return
6.2%
Cap rate
0.8%
Rent to Value Ratio
Active
$669,000
3
bds
|
3
ba
|
0
sqft
|
built
2017
205 S Lang Ave, Long Beach, MS 39560
$-1,275
Cash flow
-9.9%
Cash-on-Cash Return
3.4%
Cap rate
0.5%
Rent to Value Ratio

Active
$415,000
3
bds
|
2
ba
|
0
sqft
|
built
2023
134 Markham Dr, Long Beach, MS 39560
$-65
Cash flow
-0.8%
Cash-on-Cash Return
5.5%
Cap rate
0.7%
Rent to Value Ratio

Active
$299,999
4
bds
|
2
ba
|
0
sqft
|
built
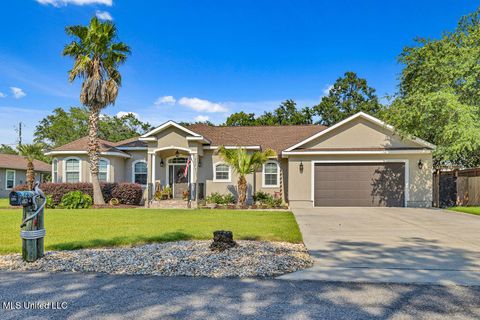
2021
211 Hawthorne Dr, Long Beach, MS 39560
$-63
Cash flow
-1.1%
Cash-on-Cash Return
5.4%
Cap rate
0.8%
Rent to Value Ratio
Active
$260,000
3
bds
|
2
ba
|
0
sqft
|
built
1971
121 Vance Pl, Long Beach, MS 39560
$106
Cash flow
2.1%
Cash-on-Cash Return
6.2%
Cap rate
0.8%
Rent to Value Ratio
Active
$224,000
4
bds
|
2
ba
|
0
sqft
|
built
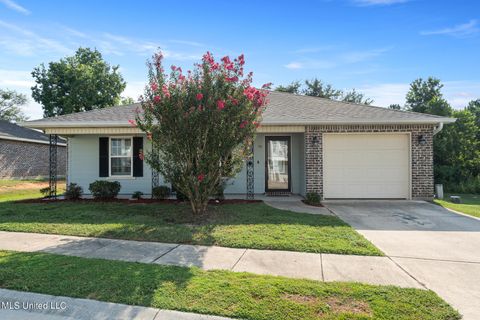
1967
914 Beatrice Dr, Long Beach, MS 39560
$141
Cash flow
3.3%
Cash-on-Cash Return
6.4%
Cap rate
0.9%
Rent to Value Ratio

Active
$404,700
4
bds
|
4
ba
|
0
sqft
|
built
2023
5006 Sand Dollar Dr, Long Beach, MS 39560
$-273
Cash flow
-3.5%
Cash-on-Cash Return
4.9%
Cap rate
0.7%
Rent to Value Ratio
Active
$273,900
5
bds
|
3
ba
|
0
sqft
|
built
1960
120 Clower Ave, Long Beach, MS 39560
$-186
Cash flow
-3.5%
Cash-on-Cash Return
4.9%
Cap rate
0.7%
Rent to Value Ratio
Active
$219,999
2
bds
|
2
ba
|
800
sqft
|
built
2008
548 W Beach Blvd, Long Beach, MS 39560
$201
Cash flow
4.8%
Cash-on-Cash Return
6.8%
Cap rate
0.8%
Rent to Value Ratio

Active
$185,000
1
bds
|
1
ba
|
0
sqft
|
built
2008
305 S Cleveland Ave, Long Beach, MS 39560
$-344
Cash flow
-9.7%
Cash-on-Cash Return
3.4%
Cap rate
0.5%
Rent to Value Ratio

Active
$384,000
3
bds
|
2
ba
|
0
sqft
|
built
2006
122 Carroll Ave, Long Beach, MS 39560
$-755
Cash flow
-10.3%
Cash-on-Cash Return
3.3%
Cap rate
0.5%
Rent to Value Ratio
Active
$265,000
4
bds
|
3
ba
|
0
sqft
|
built
1960
204 Trautman Ave, Long Beach, MS 39560
$65
Cash flow
1.3%
Cash-on-Cash Return
6.0%
Cap rate
0.9%
Rent to Value Ratio
Active
$448,500
3
bds
|
2
ba
|
0
sqft
|
built
2021
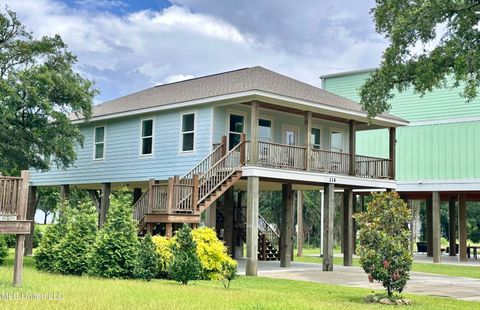
216 West Ave, Long Beach, MS 39560
$-636
Cash flow
-7.4%
Cash-on-Cash Return
4.0%
Cap rate
0.6%
Rent to Value Ratio
Active
$499,000
4
bds
|
3
ba
|
0
sqft
|
built
2009
103 Buena Vista Dr, Long Beach, MS 39560
$-649
Cash flow
-6.8%
Cash-on-Cash Return
4.1%
Cap rate
0.6%
Rent to Value Ratio
Active
$542,000
3
bds
|
3
ba
|
0
sqft
|
built
2021
605 Magnolia St, Long Beach, MS 39560
$-799
Cash flow
-7.7%
Cash-on-Cash Return
3.9%
Cap rate
0.6%
Rent to Value Ratio

Active
$329,000
4
bds
|
3
ba
|
0
sqft
|
built
1966
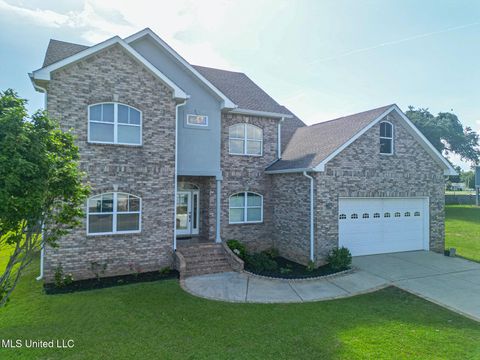
109 Boggs Cir, Long Beach, MS 39560
$-18
Cash flow
-0.3%
Cash-on-Cash Return
5.6%
Cap rate
0.8%
Rent to Value Ratio

Active
$599,000
4
bds
|
3
ba
|
0
sqft
|
built
2007
129 Marcie Dr, Long Beach, MS 39560
$-1,153
Cash flow
-10.0%
Cash-on-Cash Return
3.4%
Cap rate
0.5%
Rent to Value Ratio

Active
$259,000
3
bds
|
2
ba
|
0
sqft
|
built
1995
1154 E Old Pass Rd, Long Beach, MS 39560
$-34
Cash flow
-0.7%
Cash-on-Cash Return
5.5%
Cap rate
0.7%
Rent to Value Ratio

Active
$249,900
5
bds
|
4
ba
|
0
sqft
|
built
1965
119 N Seashore Ave, Long Beach, MS 39560
$320
Cash flow
6.7%
Cash-on-Cash Return
7.2%
Cap rate
0.9%
Rent to Value Ratio

Active
$319,000
2
bds
|
3
ba
|
0
sqft
|
built
2007
21 Oak Alley Ln, Long Beach, MS 39560
$-843
Cash flow
-13.8%
Cash-on-Cash Return
2.5%
Cap rate
0.6%
Rent to Value Ratio

Active
$269,000
4
bds
|
3
ba
|
0
sqft
|
built
1952
114 Olson Ave, Long Beach, MS 39560
$46
Cash flow
0.9%
Cash-on-Cash Return
5.9%
Cap rate
0.8%
Rent to Value Ratio
Active
$280,000
3
bds
|
2
ba
|
0
sqft
|
built
1955
318 E Fourth St, Long Beach, MS 39560
$-72
Cash flow
-1.3%
Cash-on-Cash Return
5.4%
Cap rate
0.8%
Rent to Value Ratio

Active
$223,500
4
bds
|
2
ba
|
0
sqft
|
built
1959
328 Seal Ave, Long Beach, MS 39560
$-43
Cash flow
-1.0%
Cash-on-Cash Return
5.4%
Cap rate
0.8%
Rent to Value Ratio
Active
$344,900
4
bds
|
3
ba
|
0
sqft
|
built
2022
3046 Sea Oats Dr, Long Beach, MS 39560
$-125
Cash flow
-1.9%
Cash-on-Cash Return
5.2%
Cap rate
0.8%
Rent to Value Ratio

Active
$319,900
2
bds
|
3
ba
|
0
sqft
|
built
2008
548 W Beach Blvd, Long Beach, MS 39560
$-414
Cash flow
-6.8%
Cash-on-Cash Return
4.1%
Cap rate
0.6%
Rent to Value Ratio

Active
$246,000
4
bds
|
2
ba
|
0
sqft
|
built
1986
213 Oak St, Long Beach, MS 39560
$26
Cash flow
0.6%
Cash-on-Cash Return
5.8%
Cap rate
0.8%
Rent to Value Ratio

Active
$495,000
4
bds
|
3
ba
|
0
sqft
|
built
1995
217 Boggs Cir, Long Beach, MS 39560
$-958
Cash flow
-10.1%
Cash-on-Cash Return
3.4%
Cap rate
0.5%
Rent to Value Ratio

Active
$349,900
3
bds
|
2
ba
|
0
sqft
|
built
1960
204 E Third St, Long Beach, MS 39560
$-507
Cash flow
-7.6%
Cash-on-Cash Return
3.9%
Cap rate
0.5%
Rent to Value Ratio

Active
$357,500
2
bds
|
3
ba
|
0
sqft
|
built
2007
705 W Beach Blvd, Long Beach, MS 39560
$-818
Cash flow
-11.9%
Cash-on-Cash Return
2.9%
Cap rate
0.7%
Rent to Value Ratio
Active
$314,500
2
bds
|
3
ba
|
0
sqft
|
built
2007
7 Oak Alley Ln, Long Beach, MS 39560
$-994
Cash flow
-16.5%
Cash-on-Cash Return
1.9%
Cap rate
0.6%
Rent to Value Ratio

Active
$879,000
2
bds
|
2
ba
|
0
sqft
|
built
2007
470 W Beach Blvd, Long Beach, MS 39560
$-2,667
Cash flow
-15.8%
Cash-on-Cash Return
2.0%
Cap rate
0.3%
Rent to Value Ratio

Active
$385,000
4
bds
|
3
ba
|
0
sqft
|
built
1966
4 Chimney Cross, Long Beach, MS 39560
$-285
Cash flow
-3.9%
Cash-on-Cash Return
4.8%
Cap rate
0.7%
Rent to Value Ratio

Active
$507,500
4
bds
|
2
ba
|
0
sqft
|
built
2007
202 White Harbor Rd, Long Beach, MS 39560
$-666
Cash flow
-6.8%
Cash-on-Cash Return
4.1%
Cap rate
0.6%
Rent to Value Ratio

Active
$339,000
2
bds
|
3
ba
|
0
sqft
|
built
2007
707 W Beach Blvd, Long Beach, MS 39560
$-1,317
Cash flow
-20.3%
Cash-on-Cash Return
1.0%
Cap rate
0.6%
Rent to Value Ratio

Active
$320,000
2
bds
|
2
ba
|
0
sqft
|
built
2007
2 Oak Alley Ln, Long Beach, MS 39560
$-921
Cash flow
-15.0%
Cash-on-Cash Return
2.2%
Cap rate
0.7%
Rent to Value Ratio