39565 Investment Properties for Sale
Browse homes for sale and investment properties in 39565. Refine your search by price, property type, or more.
Best cash flowing properties in 39565
Active
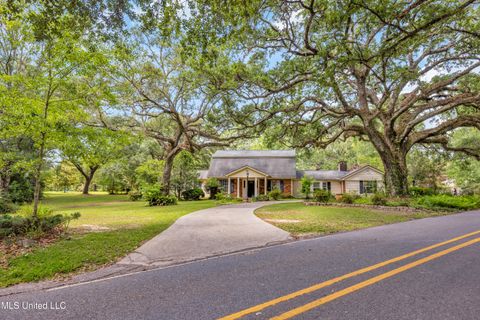
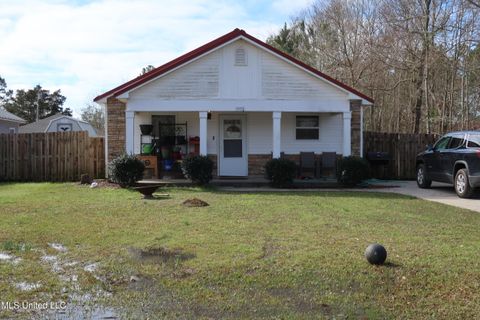
$365,000
4
bds
|
3
ba
|
0
sqft
|
built
1974
9618 Paige Bayou Rd, Vancleave, MS 39565
$-177
Cash flow
-2.5%
Cash-on-Cash Return
5.1%
Cap rate
0.7%
Rent to Value Ratio
Active
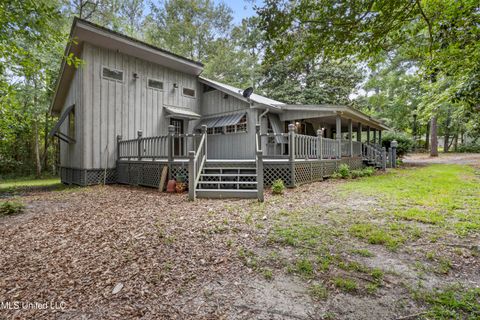
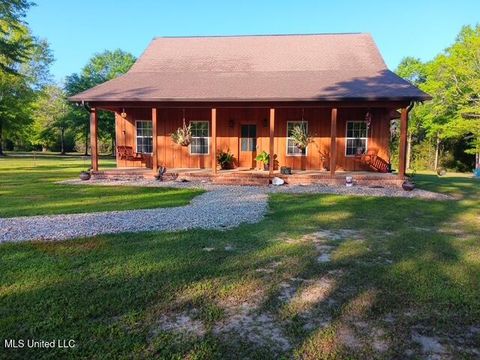
$329,000
2
bds
|
2
ba
|
0
sqft
|
built
1970
10766 Johns Bayou Cir, Vancleave, MS 39565
$-365
Cash flow
-5.8%
Cash-on-Cash Return
4.3%
Cap rate
0.5%
Rent to Value Ratio
10 out of 14 properties for sale in 39565
Limited Results Shown
Create a free account, or log in to reveal all property listings and enjoy the complete experience.
Active
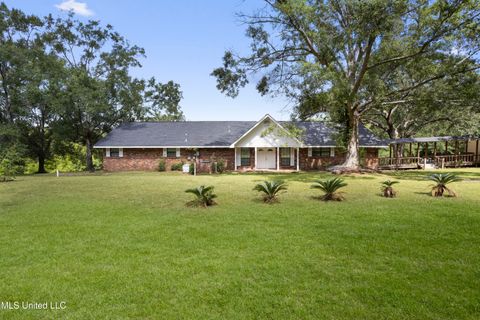
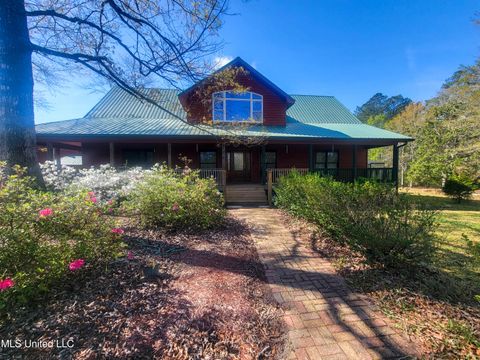
$550,000
3
bds
|
2
ba
|
0
sqft
|
built
1991
10200 Blossom St, Vancleave, MS 39565
$-1,292
Cash flow
-12.3%
Cash-on-Cash Return
2.9%
Cap rate
0.5%
Rent to Value Ratio
Active
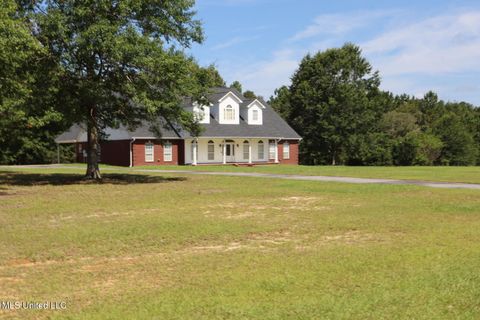
$535,000
3
bds
|
3
ba
|
0
sqft
|
built
2003
2212 Sampras Blvd, Vancleave, MS 39565
$-972
Cash flow
-9.5%
Cash-on-Cash Return
3.5%
Cap rate
0.5%
Rent to Value Ratio

Active
$725,000
15
bds
|
10
ba
|
0
sqft
|
built
2007
9529 Smith Ave, Ocean Springs, MS 39565
$-2,960
Cash flow
-21.3%
Cash-on-Cash Return
0.8%
Cap rate
0.2%
Rent to Value Ratio

Active
$620,000
12
bds
|
8
ba
|
0
sqft
|
built
2007
9620 Nevada Ave, Ocean Springs, MS 39565
$-2,134
Cash flow
-18.0%
Cash-on-Cash Return
1.5%
Cap rate
0.3%
Rent to Value Ratio
Active
$990,000
18
bds
|
12
ba
|
0
sqft
|
built
2010
15001 Dillon St, Ocean Springs, MS 39565
$-4,462
Cash flow
-23.5%
Cash-on-Cash Return
0.3%
Cap rate
0.1%
Rent to Value Ratio
Active
$599,999
4
bds
|
3
ba
|
0
sqft
|
built
2008
9900 Little Buck Rd, Vancleave, MS 39565
$-1,369
Cash flow
-11.9%
Cash-on-Cash Return
2.9%
Cap rate
0.4%
Rent to Value Ratio
Active
$1,150,000
4
bds
|
4
ba
|
0
sqft
|
built
2004
24203 Bilbo Rd, Vancleave, MS 39565
$-3,798
Cash flow
-17.2%
Cash-on-Cash Return
1.7%
Cap rate
0.3%
Rent to Value Ratio

Active
$330,000
4
bds
|
2
ba
|
0
sqft
|
built
2009
9612 Nevada Ave, Ocean Springs, MS 39565
$-593
Cash flow
-9.4%
Cash-on-Cash Return
3.5%
Cap rate
0.5%
Rent to Value Ratio