46037 Investment Properties for Sale
Browse homes for sale and investment properties in 46037. Refine your search by price, property type, or more.
Best cash flowing properties in 46037
Active
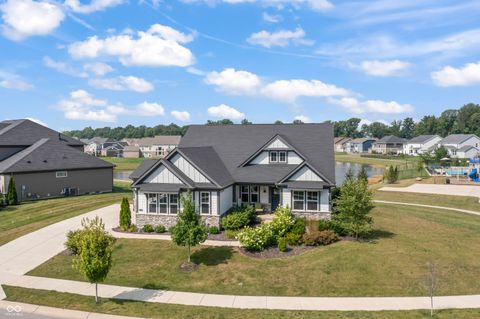
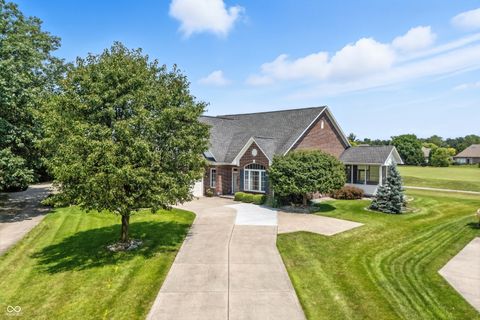
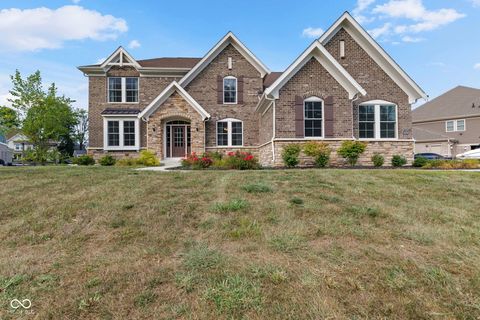
$668,500
4
bds
|
3
ba
|
2,898
sqft
|
built
2021
12594 Tidecrest Dr, Fishers, IN 46037
$-49
Cash flow
-0.4%
Cash-on-Cash Return
6.1%
Cap rate
0.7%
Rent to Value Ratio
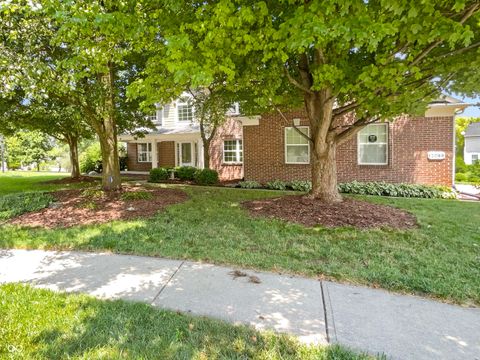
Active
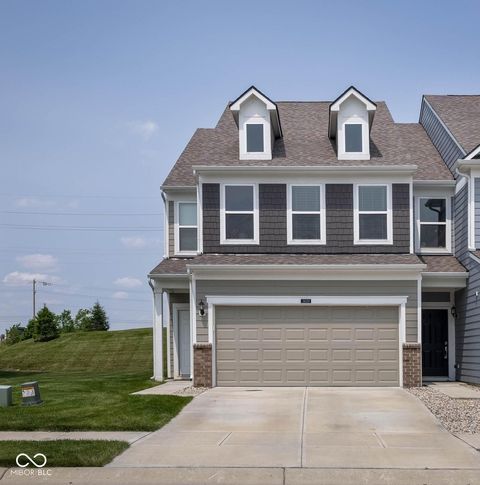
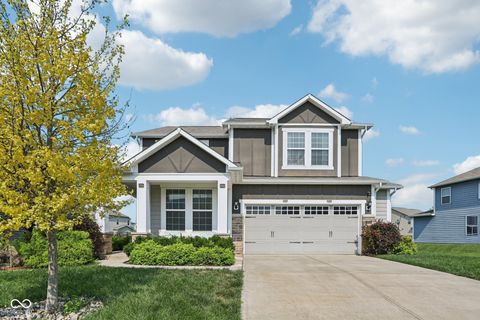
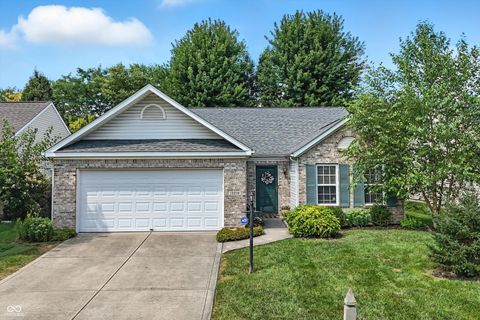
$349,900
3
bds
|
3
ba
|
2,096
sqft
|
built
2021
14110 Bay Willow Dr, Fishers, IN 46037
$-60
Cash flow
-0.9%
Cash-on-Cash Return
5.9%
Cap rate
0.8%
Rent to Value Ratio
74 out of 82 properties for sale in 46037
Limited Results Shown
Create a free account, or log in to reveal all property listings and enjoy the complete experience.
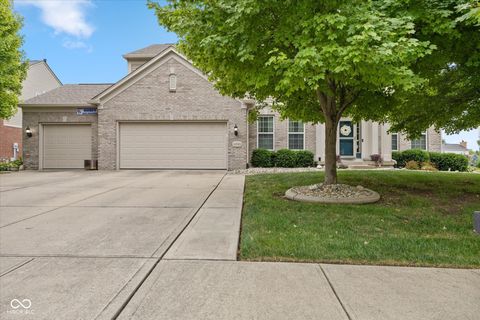
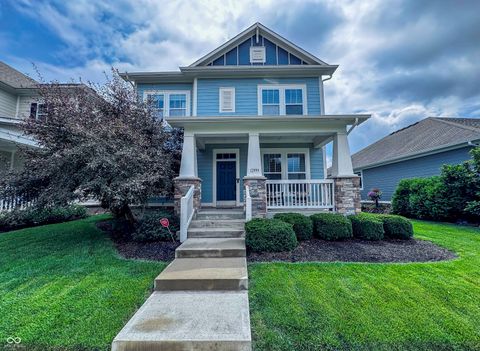
Active
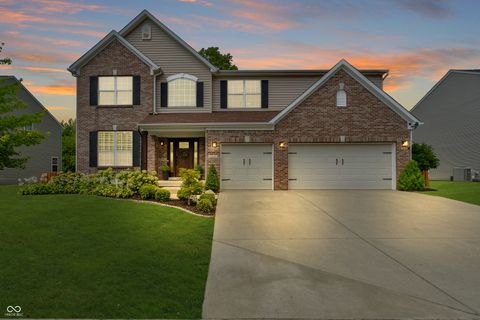
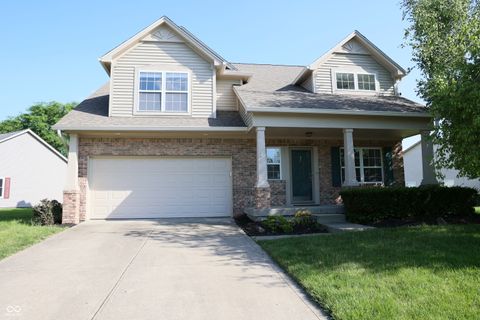
$594,900
6
bds
|
5
ba
|
4,290
sqft
|
built
2005
11581 Ludlow Dr, Fishers, IN 46037
$-674
Cash flow
-5.9%
Cash-on-Cash Return
4.8%
Cap rate
0.6%
Rent to Value Ratio
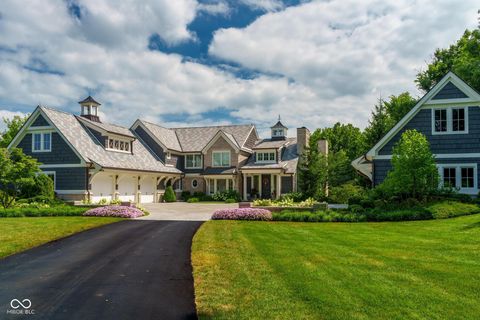
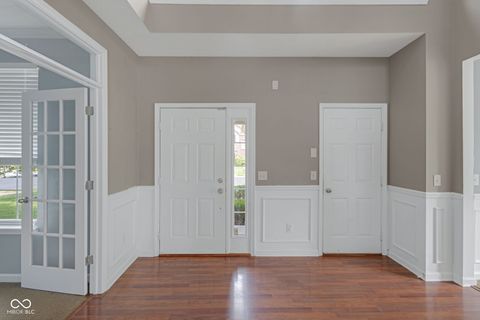
Active
$5,900,000
4
bds
|
6
ba
|
10,614
sqft
|
built
1980
13665 E 114th St, Fishers, IN 46037
$-26,126
Cash flow
-23.1%
Cash-on-Cash Return
0.8%
Cap rate
0.1%
Rent to Value Ratio
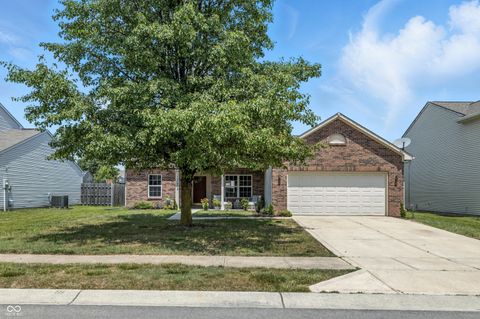
Active
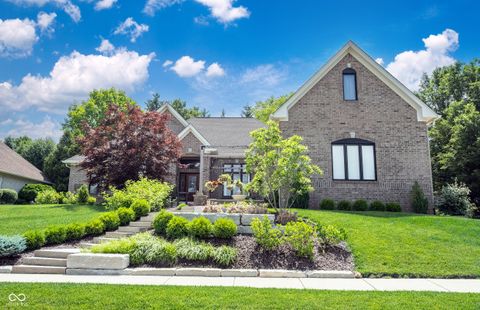
$574,900
5
bds
|
4
ba
|
3,954
sqft
|
built
2006
11761 Boothbay Ln, Fishers, IN 46037
$-771
Cash flow
-7.0%
Cash-on-Cash Return
4.5%
Cap rate
0.6%
Rent to Value Ratio
Active
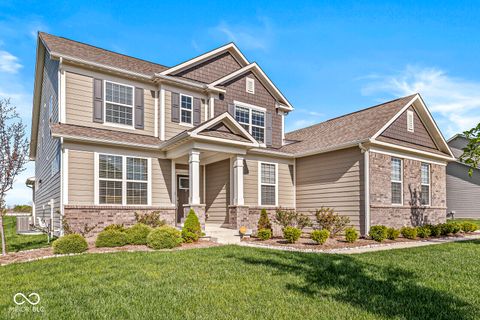
$799,900
5
bds
|
4
ba
|
4,305
sqft
|
built
1991
9838 Gulfstream Ct, Fishers, IN 46037
$-1,657
Cash flow
-10.8%
Cash-on-Cash Return
3.7%
Cap rate
0.5%
Rent to Value Ratio
Active
$499,000
4
bds
|
4
ba
|
3,554
sqft
|
built
2013
12964 Walbeck Dr, Fishers, IN 46037
$-195
Cash flow
-2.0%
Cash-on-Cash Return
5.7%
Cap rate
0.7%
Rent to Value Ratio
Active
$425,000
4
bds
|
3
ba
|
2,362
sqft
|
built
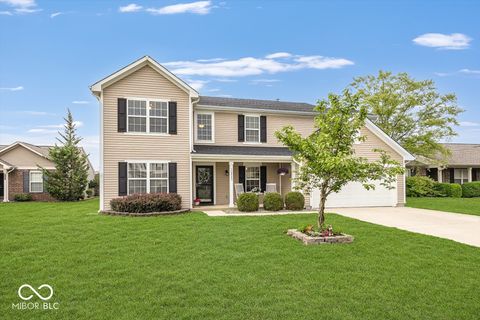
2014
14514 Glapthorn Rd, Fishers, IN 46037
$-502
Cash flow
-6.2%
Cash-on-Cash Return
4.7%
Cap rate
0.6%
Rent to Value Ratio
Active
$464,900
2
bds
|
2
ba
|
2,588
sqft
|
built
2007
16156 Oliver St, Fishers, IN 46037
$-651
Cash flow
-7.3%
Cash-on-Cash Return
4.5%
Cap rate
0.6%
Rent to Value Ratio
Active
$314,000
2
bds
|
3
ba
|
1,770
sqft
|
built
2005
12698 Watford Way, Fishers, IN 46037
$-228
Cash flow
-3.8%
Cash-on-Cash Return
5.3%
Cap rate
0.6%
Rent to Value Ratio
Active
$535,000
4
bds
|
3
ba
|
3,436
sqft
|
built
2020
12888 Girvan Way, Fishers, IN 46037
$-587
Cash flow
-5.7%
Cash-on-Cash Return
4.8%
Cap rate
0.6%
Rent to Value Ratio
Active
$445,000
4
bds
|
3
ba
|
2,970
sqft
|
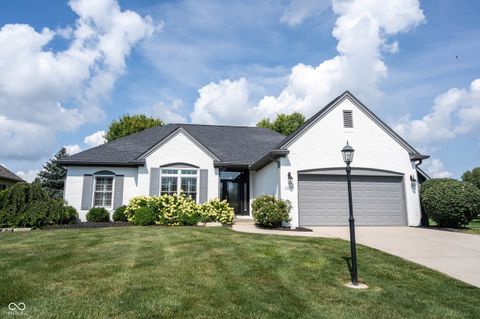
built
1995
10518 Greenway Dr, Fishers, IN 46037
$-598
Cash flow
-7.0%
Cash-on-Cash Return
4.5%
Cap rate
0.6%
Rent to Value Ratio
Active
$475,000
3
bds
|
4
ba
|
2,420
sqft
|
built
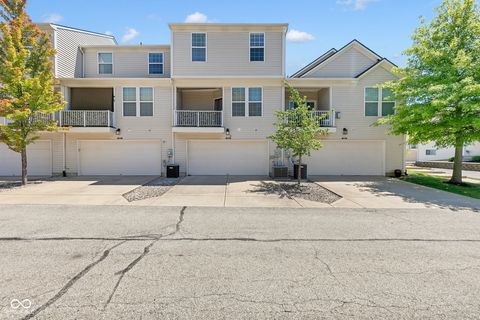
2020
9729 District North Dr, Fishers, IN 46037
$-816
Cash flow
-9.0%
Cash-on-Cash Return
4.1%
Cap rate
0.6%
Rent to Value Ratio
Active
$354,900
3
bds
|
2
ba
|
1,886
sqft
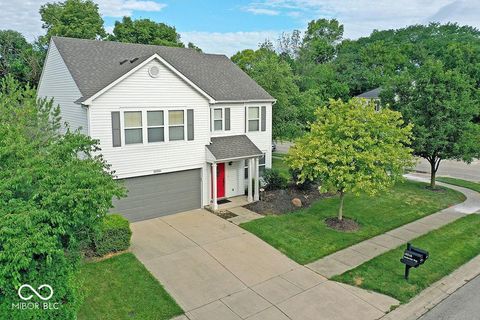
|
built
1995
8988 Max Ct, Fishers, IN 46037
$-332
Cash flow
-4.9%
Cash-on-Cash Return
5.0%
Cap rate
0.6%
Rent to Value Ratio
Active
$525,000
5
bds
|
5
ba
|
4,312
sqft
|
built
2005
12994 Dekoven Dr, Fishers, IN 46037
$-604
Cash flow
-6.0%
Cash-on-Cash Return
4.8%
Cap rate
0.6%
Rent to Value Ratio
Active
$465,000
3
bds
|
4
ba
|
2,400
sqft
|
built
2021
9728 Junction Sta, Fishers, IN 46037
$-555
Cash flow
-6.2%
Cash-on-Cash Return
4.7%
Cap rate
0.7%
Rent to Value Ratio
Active
$785,000
4
bds
|
5
ba
|
5,726
sqft
|
built
2020
16222 Browning Ct, Fishers, IN 46037
$-688
Cash flow
-4.6%
Cash-on-Cash Return
5.1%
Cap rate
0.6%
Rent to Value Ratio
Active
$624,500
4
bds
|
5
ba
|
5,759
sqft
|
built
2004
10381 Beaver Ridge Dr, Fishers, IN 46037
$-468
Cash flow
-3.9%
Cash-on-Cash Return
5.2%
Cap rate
0.6%
Rent to Value Ratio
Active
$369,000
4
bds
|
3
ba
|
2,907
sqft
|
built
1998
10266 Hatherley Way, Fishers, IN 46037
$-201
Cash flow
-2.8%
Cash-on-Cash Return
5.5%
Cap rate
0.7%
Rent to Value Ratio
Active
$460,000
4
bds
|
3
ba
|
3,339
sqft
|
built
1996
9831 Deering St, Fishers, IN 46037
$-457
Cash flow
-5.2%
Cash-on-Cash Return
5.0%
Cap rate
0.6%
Rent to Value Ratio
Active
$299,999
2
bds
|
3
ba
|
2,109
sqft
|
built
2006
12675 Hollice Ln, Fishers, IN 46037
$-209
Cash flow
-3.6%
Cash-on-Cash Return
5.3%
Cap rate
0.7%
Rent to Value Ratio
Active
$599,900
2
bds
|
2
ba
|
2,873
sqft
|
built
1995
10510 Inverness Ct, Fishers, IN 46037
$-1,184
Cash flow
-10.3%
Cash-on-Cash Return
3.8%
Cap rate
0.5%
Rent to Value Ratio
Active
$345,000
3
bds
|
3
ba
|
2,176
sqft
|
built
1998
10316 Hatherley Way, Fishers, IN 46037
$-354
Cash flow
-5.4%
Cash-on-Cash Return
4.9%
Cap rate
0.6%
Rent to Value Ratio
Active
$410,000
4
bds
|
3
ba
|
2,616
sqft
|
built
2005
12845 Touchdown Dr, Fishers, IN 46037
$-421
Cash flow
-5.4%
Cash-on-Cash Return
4.9%
Cap rate
0.6%
Rent to Value Ratio
Active
$550,000
3
bds
|
3
ba
|
2,779
sqft
|
built
2005
10844 Fairwoods Dr, Fishers, IN 46037
$-715
Cash flow
-6.8%
Cash-on-Cash Return
4.6%
Cap rate
0.6%
Rent to Value Ratio
Active
$459,995
4
bds
|
3
ba
|
2,690
sqft
|
built
2016
13504 Forest Glade Dr, Fishers, IN 46037
$-627
Cash flow
-7.1%
Cash-on-Cash Return
4.5%
Cap rate
0.6%
Rent to Value Ratio
Active
$595,900
5
bds
|
4
ba
|
3,771
sqft
|
built
2005
13176 Ambergate Dr, Fishers, IN 46037
$-1,174
Cash flow
-10.3%
Cash-on-Cash Return
3.8%
Cap rate
0.5%
Rent to Value Ratio
Active
$360,000
3
bds
|
2
ba
|
1,622
sqft
|
built
2006
12404 Titans Dr, Fishers, IN 46037
$-442
Cash flow
-6.4%
Cash-on-Cash Return
4.7%
Cap rate
0.6%
Rent to Value Ratio
Active
$374,900
3
bds
|
2
ba
|
1,864
sqft
|
built
2004
12218 Weathered Edge Dr, Fishers, IN 46037
$-428
Cash flow
-6.0%
Cash-on-Cash Return
4.8%
Cap rate
0.6%
Rent to Value Ratio
Active
$425,000
3
bds
|
3
ba
|
2,676
sqft
|
built
1995
10949 Haig Point Dr, Fishers, IN 46037
$-423
Cash flow
-5.2%
Cash-on-Cash Return
5.0%
Cap rate
0.6%
Rent to Value Ratio
Active
$749,900
4
bds
|
5
ba
|
5,102
sqft
|
built
1998
10707 Burning Rdg, Fishers, IN 46037
$-437
Cash flow
-3.0%
Cash-on-Cash Return
5.4%
Cap rate
0.7%
Rent to Value Ratio
Active
$599,999
4
bds
|
4
ba
|
3,431
sqft
|
built
2020
12894 Corydon Dr, Fishers, IN 46037
$-654
Cash flow
-5.7%
Cash-on-Cash Return
4.8%
Cap rate
0.6%
Rent to Value Ratio
Active
$399,900
4
bds
|
3
ba
|
2,006
sqft
|
built
1957
10624 E 97th St, Fishers, IN 46037
$-530
Cash flow
-6.9%
Cash-on-Cash Return
4.6%
Cap rate
0.6%
Rent to Value Ratio
Active
$365,000
4
bds
|
3
ba
|
1,808
sqft
|
built
1995
9005 Glass Chimney Ln, Fishers, IN 46037
$-381
Cash flow
-5.4%
Cash-on-Cash Return
4.9%
Cap rate
0.6%
Rent to Value Ratio
Active
$439,900
3
bds
|
3
ba
|
3,172
sqft
|
built
2003
12635 Touchdown Dr, Fishers, IN 46037
$-576
Cash flow
-6.8%
Cash-on-Cash Return
4.6%
Cap rate
0.6%
Rent to Value Ratio
Active
$525,000
4
bds
|
3
ba
|
3,292
sqft
|
built
1996
10954 Treyburn Dr, Fishers, IN 46037
$-524
Cash flow
-5.2%
Cash-on-Cash Return
4.9%
Cap rate
0.6%
Rent to Value Ratio
Active
$875,000
5
bds
|
4
ba
|
3,447
sqft
|
built
2021
14598 Meadow Bend Dr, Fishers, IN 46037
$-1,722
Cash flow
-10.3%
Cash-on-Cash Return
3.8%
Cap rate
0.5%
Rent to Value Ratio
Active
$580,000
5
bds
|
4
ba
|
3,819
sqft
|
built
2001
12089 Red Hawk Dr, Fishers, IN 46037
$-527
Cash flow
-4.7%
Cash-on-Cash Return
5.1%
Cap rate
0.6%
Rent to Value Ratio
Active
$547,000
4
bds
|
4
ba
|
4,488
sqft
|
built
2014
12999 Pennington Rd, Fishers, IN 46037
$-441
Cash flow
-4.2%
Cash-on-Cash Return
5.2%
Cap rate
0.6%
Rent to Value Ratio
Active
$549,900
5
bds
|
4
ba
|
3,776
sqft
|
built
2005
11698 Tylers Close, Fishers, IN 46037
$-989
Cash flow
-9.4%
Cash-on-Cash Return
4.0%
Cap rate
0.5%
Rent to Value Ratio