46142 Investment Properties for Sale
Browse homes for sale and investment properties in 46142. Refine your search by price, property type, or more.
Best cash flowing properties in 46142
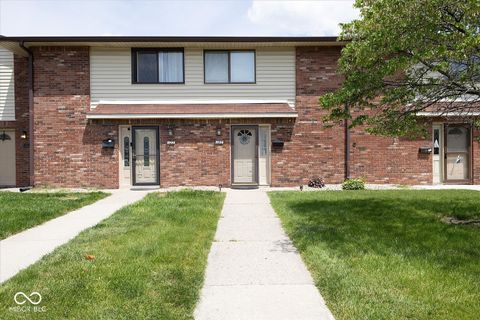
Active
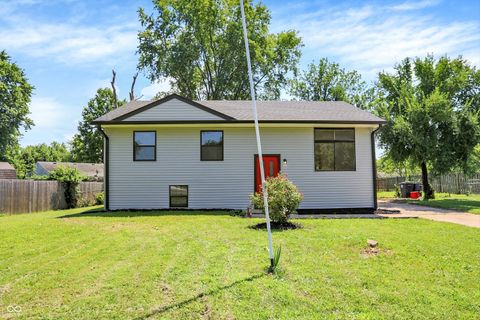
$126,500
2
bds
|
2
ba
|
1,088
sqft
|
built
1974
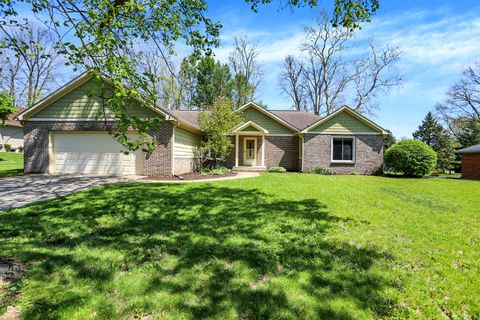
120 Greenwood Trl N, Greenwood, IN 46142
$104
Cash flow
4.3%
Cash-on-Cash Return
7.1%
Cap rate
1.1%
Rent to Value Ratio
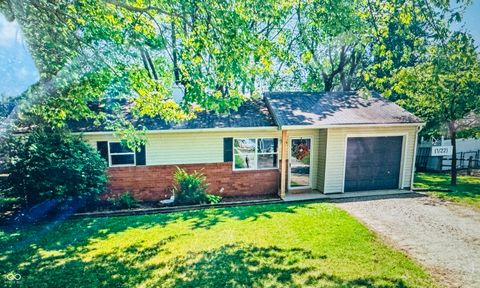
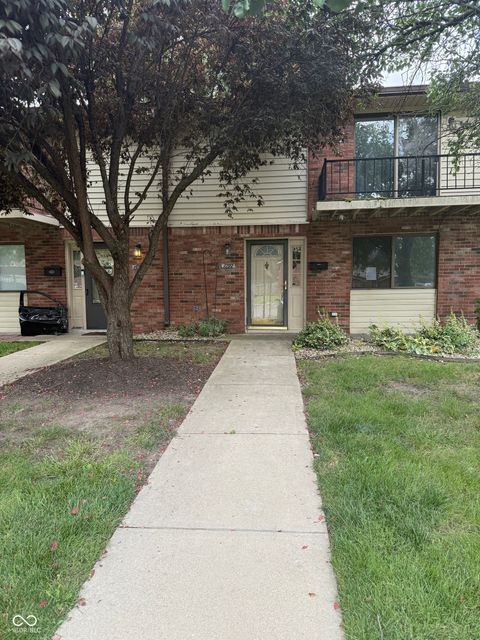
Active
$230,000
3
bds
|
1
ba
|
1,048
sqft
|
built
1963
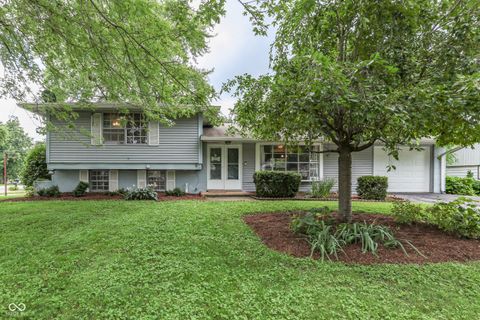
975 Rolling Hill Rd, Greenwood, IN 46142
$64
Cash flow
1.5%
Cash-on-Cash Return
6.5%
Cap rate
0.8%
Rent to Value Ratio
59 out of 62 properties for sale in 46142
Limited Results Shown
Create a free account, or log in to reveal all property listings and enjoy the complete experience.
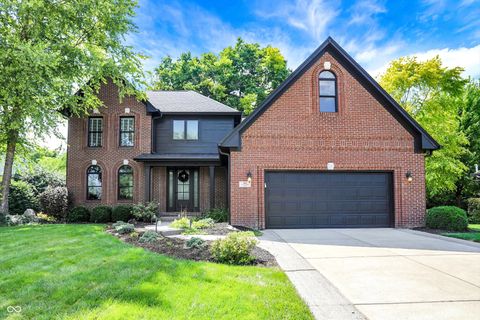
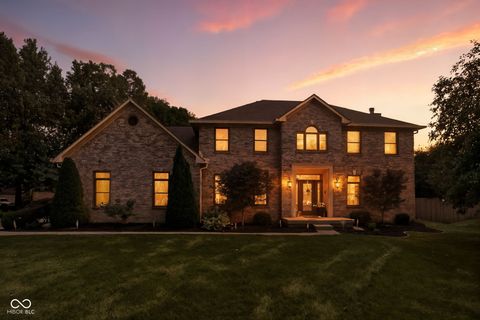
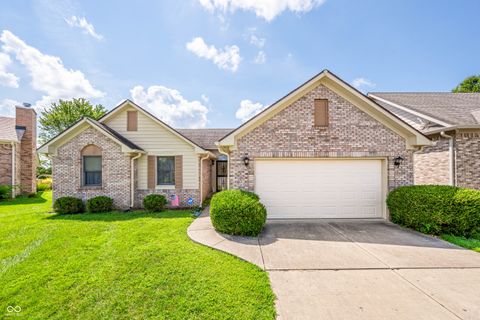
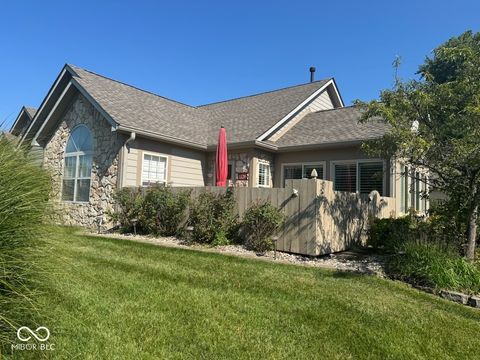
Active
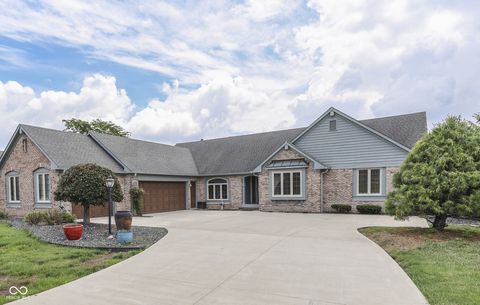
$615,000
4
bds
|
4
ba
|
3,435
sqft
|
built
2002
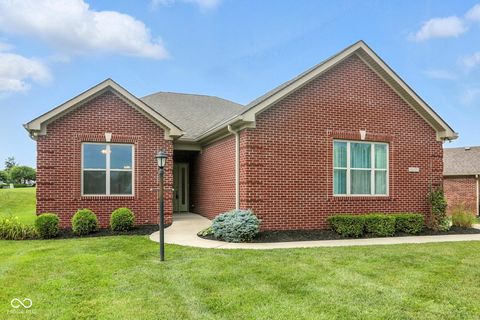
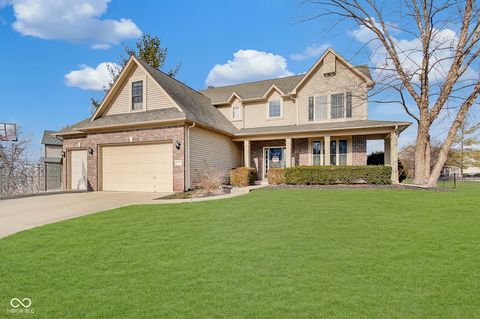
588 Walnut Woods Dr, Greenwood, IN 46142
$-413
Cash flow
-3.5%
Cash-on-Cash Return
5.3%
Cap rate
0.7%
Rent to Value Ratio
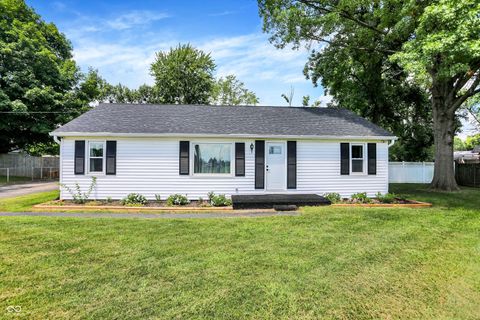
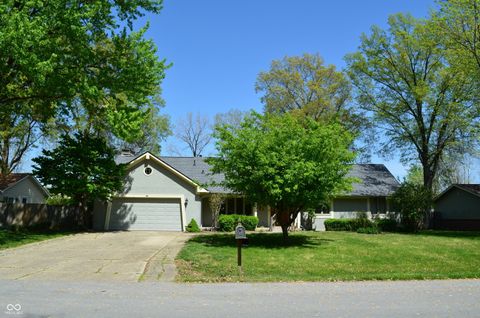
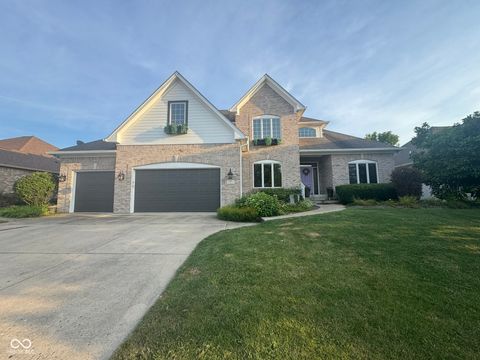
Active
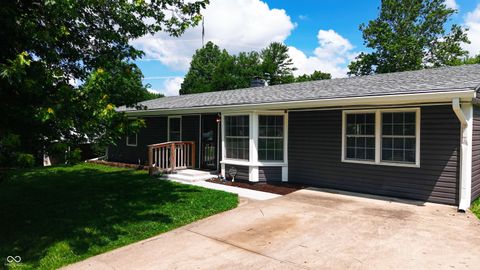
$229,000
3
bds
|
1
ba
|
1,207
sqft
|
built
1960
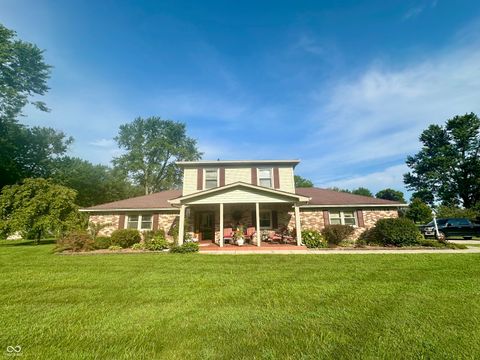
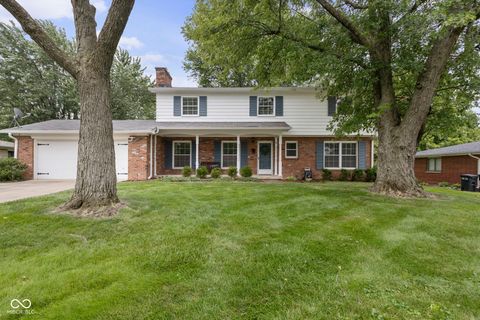
822 W Smith Valley Rd, Greenwood, IN 46142
$-69
Cash flow
-1.6%
Cash-on-Cash Return
5.8%
Cap rate
0.7%
Rent to Value Ratio
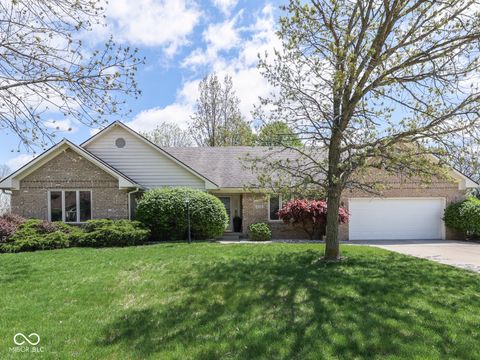
Active
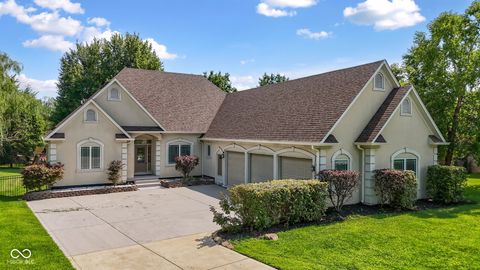
$285,900
3
bds
|
2
ba
|
3,096
sqft
|
built
1960
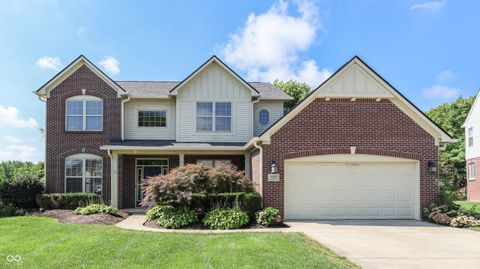
1081 Lawndale Dr, Greenwood, IN 46142
$-223
Cash flow
-4.1%
Cash-on-Cash Return
5.2%
Cap rate
0.6%
Rent to Value Ratio
Active
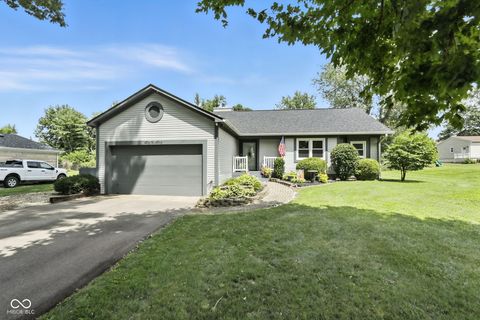
$250,000
3
bds
|
2
ba
|
1,358
sqft
|
built
1954
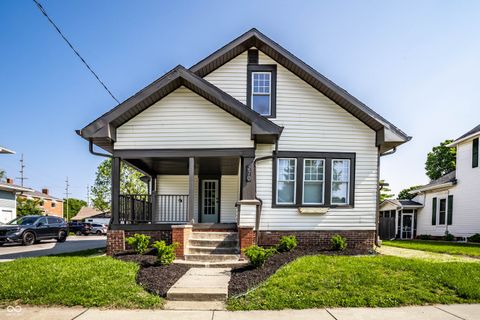
497 S Hendricks Dr, Greenwood, IN 46142
$-39
Cash flow
-0.8%
Cash-on-Cash Return
6.0%
Cap rate
0.7%
Rent to Value Ratio
Active
$282,000
3
bds
|
2
ba
|
1,356
sqft
|
built
1975
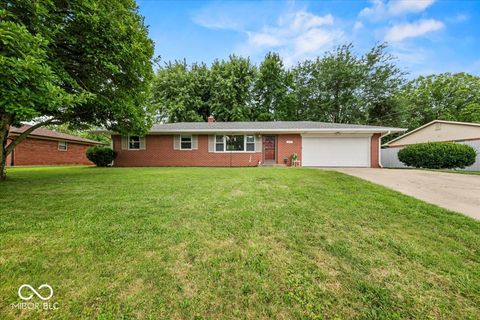
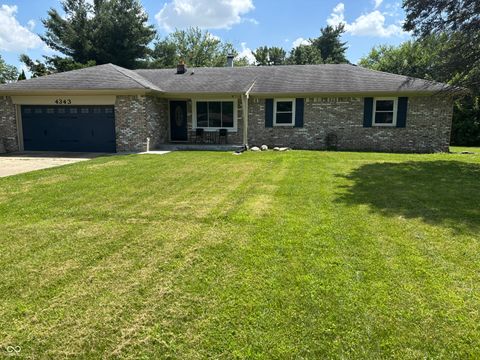
4343 W Fairview Rd, Greenwood, IN 46142
$-134
Cash flow
-2.5%
Cash-on-Cash Return
5.6%
Cap rate
0.7%
Rent to Value Ratio
Active
$210,000
3
bds
|
1
ba
|
1,248
sqft
|
built
1956
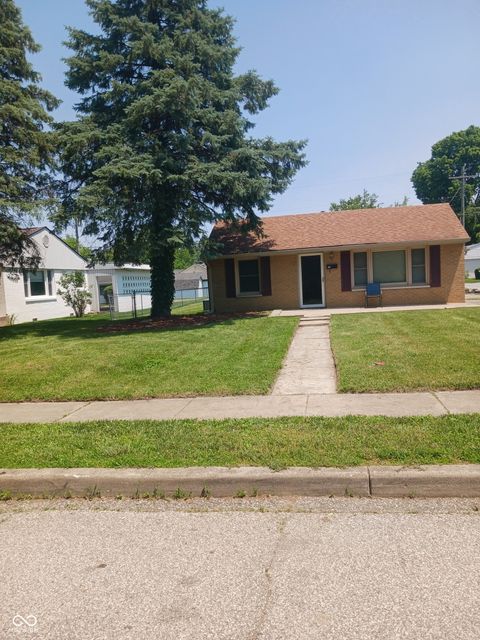
351 N Smart St, Greenwood, IN 46142
$28
Cash flow
0.7%
Cash-on-Cash Return
6.3%
Cap rate
0.8%
Rent to Value Ratio
Active
$635,000
5
bds
|
5
ba
|
4,680
sqft
|
built
1988
1021 Hudson Bay Dr, Greenwood, IN 46142
$-1,045
Cash flow
-8.6%
Cash-on-Cash Return
4.2%
Cap rate
0.5%
Rent to Value Ratio
Active
$265,000
3
bds
|
2
ba
|
1,629
sqft
|
built
1963
988 Rolling Hill Rd, Greenwood, IN 46142
$-115
Cash flow
-2.3%
Cash-on-Cash Return
5.6%
Cap rate
0.7%
Rent to Value Ratio
Active
$675,000
4
bds
|
4
ba
|
6,684
sqft
|
built
2000
129 Back Creek Overlook, Greenwood, IN 46142
$-1,267
Cash flow
-9.8%
Cash-on-Cash Return
3.9%
Cap rate
0.5%
Rent to Value Ratio
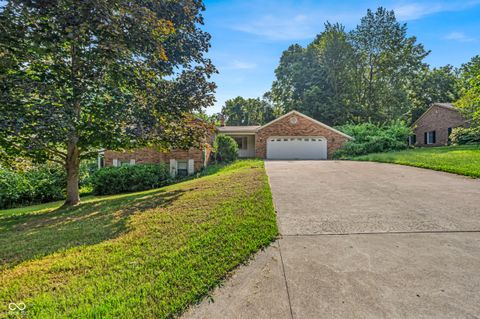
Active
$300,000
3
bds
|
2
ba
|
1,624
sqft
|
built
1988
5130 Mount Pleasant North St, Greenwood, IN 46142
$-157
Cash flow
-2.7%
Cash-on-Cash Return
5.5%
Cap rate
0.7%
Rent to Value Ratio
Active
$360,000
4
bds
|
2
ba
|
1,626
sqft
|
built
1976
783 Colonial Way, Greenwood, IN 46142
$-602
Cash flow
-8.7%
Cash-on-Cash Return
4.1%
Cap rate
0.5%
Rent to Value Ratio
Active
$515,000
4
bds
|
4
ba
|
3,135
sqft
|
built
1992
4489 Annelo Dr, Greenwood, IN 46142
$-499
Cash flow
-5.1%
Cash-on-Cash Return
5.0%
Cap rate
0.6%
Rent to Value Ratio
Active
$314,000
3
bds
|
2
ba
|
2,172
sqft
|
built
1973
931 Beech Dr, Greenwood, IN 46142
$-297
Cash flow
-4.9%
Cash-on-Cash Return
5.0%
Cap rate
0.6%
Rent to Value Ratio
Active
$396,500
3
bds
|
3
ba
|
1,984
sqft
|
built
1991
4759 Silver Hill Dr, Greenwood, IN 46142
$-325
Cash flow
-4.3%
Cash-on-Cash Return
5.2%
Cap rate
0.6%
Rent to Value Ratio
Active
$319,900
3
bds
|
2
ba
|
1,875
sqft
|
built
1972
601 Shady Ln, Greenwood, IN 46142
$-146
Cash flow
-2.4%
Cash-on-Cash Return
5.6%
Cap rate
0.7%
Rent to Value Ratio
Active
$224,900
3
bds
|
2
ba
|
1,689
sqft
|
built
1962
1110 Barefoot Trl, Greenwood, IN 46142
$-48
Cash flow
-1.1%
Cash-on-Cash Return
5.9%
Cap rate
0.7%
Rent to Value Ratio
Active
$320,000
2
bds
|
2
ba
|
1,629
sqft
|
built
2016
1127 Kay Dr, Greenwood, IN 46142
$-259
Cash flow
-4.2%
Cash-on-Cash Return
5.2%
Cap rate
0.6%
Rent to Value Ratio
Active
$369,900
3
bds
|
3
ba
|
1,895
sqft
|
built
1973
378 Lea Ln, Greenwood, IN 46142
$-515
Cash flow
-7.3%
Cash-on-Cash Return
4.5%
Cap rate
0.5%
Rent to Value Ratio
Active
$289,000
4
bds
|
3
ba
|
1,563
sqft
|
built
1991
1292 Timber Creek Ln, Greenwood, IN 46142
$-438
Cash flow
-7.9%
Cash-on-Cash Return
4.3%
Cap rate
0.6%
Rent to Value Ratio
Active
$299,900
4
bds
|
2
ba
|
1,624
sqft
|
built
1916
72 W Broadway St, Greenwood, IN 46142
$-432
Cash flow
-7.5%
Cash-on-Cash Return
4.4%
Cap rate
0.5%
Rent to Value Ratio
Active
$284,000
4
bds
|
3
ba
|
2,112
sqft
|
built
1988
1564 Chase Blvd, Greenwood, IN 46142
$-223
Cash flow
-4.1%
Cash-on-Cash Return
5.2%
Cap rate
0.6%
Rent to Value Ratio
Active
$329,900
4
bds
|
3
ba
|
2,088
sqft
|
built
1996
462 Paddock Rd, Greenwood, IN 46142
$-127
Cash flow
-2.0%
Cash-on-Cash Return
5.7%
Cap rate
0.7%
Rent to Value Ratio
Active
$265,000
3
bds
|
2
ba
|
1,292
sqft
|
built
1998
1109 Sarah Ct, Greenwood, IN 46142
$-115
Cash flow
-2.3%
Cash-on-Cash Return
5.6%
Cap rate
0.7%
Rent to Value Ratio
Active
$405,000
5
bds
|
3
ba
|
3,105
sqft
|
built
1970
601 Lawnwood Dr, Greenwood, IN 46142
$-143
Cash flow
-1.8%
Cash-on-Cash Return
5.7%
Cap rate
0.7%
Rent to Value Ratio
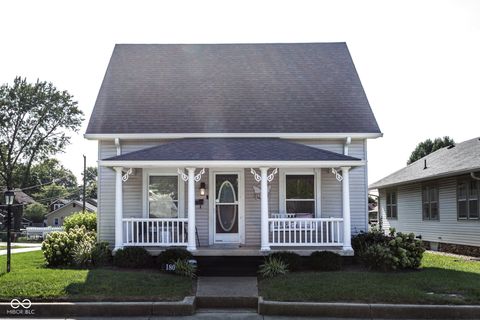
Active
$304,999
3
bds
|
2
ba
|
1,560
sqft
|
built
2000
180 N Brewer St, Greenwood, IN 46142
$-182
Cash flow
-3.1%
Cash-on-Cash Return
5.4%
Cap rate
0.7%
Rent to Value Ratio
Active
$414,000
4
bds
|
3
ba
|
3,820
sqft
|
built
1972
11 N Restin Rd, Greenwood, IN 46142
$-741
Cash flow
-9.3%
Cash-on-Cash Return
4.0%
Cap rate
0.5%
Rent to Value Ratio
Active
$384,900
4
bds
|
3
ba
|
2,333
sqft
|
built
2003
5230 Berkshire South Blvd, Greenwood, IN 46142
$-78
Cash flow
-1.1%
Cash-on-Cash Return
5.9%
Cap rate
0.7%
Rent to Value Ratio
Active
$409,900
4
bds
|
3
ba
|
2,356
sqft
|
built
1963
311 Camby St, Greenwood, IN 46142
$-720
Cash flow
-9.2%
Cash-on-Cash Return
4.0%
Cap rate
0.5%
Rent to Value Ratio
Active
$450,000
4
bds
|
3
ba
|
2,338
sqft
|
built
2008
4103 Oval Pl, Greenwood, IN 46142
$-617
Cash flow
-7.2%
Cash-on-Cash Return
4.5%
Cap rate
0.6%
Rent to Value Ratio
Active
$329,900
4
bds
|
3
ba
|
2,191
sqft
|
built
1955
270 W Broadway St, Greenwood, IN 46142
$-310
Cash flow
-4.9%
Cash-on-Cash Return
5.0%
Cap rate
0.6%
Rent to Value Ratio
Active
$249,900
3
bds
|
2
ba
|
1,887
sqft
|
built
1961
981 W County Line Rd, Greenwood, IN 46142
$-38
Cash flow
-0.8%
Cash-on-Cash Return
6.0%
Cap rate
0.7%
Rent to Value Ratio
Active
$135,000
3
bds
|
2
ba
|
1,344
sqft
|
built
1974
1092 Greenwood Trl W, Greenwood, IN 46142
$9
Cash flow
0.3%
Cash-on-Cash Return
6.2%
Cap rate
1.0%
Rent to Value Ratio
Active
$294,900
2
bds
|
2
ba
|
1,517
sqft
|
built
2003
1126 Deerbrook Trl, Greenwood, IN 46142
$-556
Cash flow
-9.8%
Cash-on-Cash Return
3.9%
Cap rate
0.7%
Rent to Value Ratio
Active
$589,900
5
bds
|
4
ba
|
3,789
sqft
|
built
2002
3613 Sugar Maple Ct, Greenwood, IN 46142
$-839
Cash flow
-7.4%
Cash-on-Cash Return
4.4%
Cap rate
0.5%
Rent to Value Ratio
Active
$349,900
3
bds
|
2
ba
|
1,686
sqft
|
built
1974
784 S Restin Rd, Greenwood, IN 46142
$-412
Cash flow
-6.1%
Cash-on-Cash Return
4.7%
Cap rate
0.6%
Rent to Value Ratio
Active
$285,500
3
bds
|
2
ba
|
1,690
sqft
|
built
1980
1759 Michele Ln, Greenwood, IN 46142
$-82
Cash flow
-1.5%
Cash-on-Cash Return
5.8%
Cap rate
0.7%
Rent to Value Ratio
Active
$309,900
2
bds
|
2
ba
|
1,618
sqft
|
built
2002
564 Parkhurst Ct, Greenwood, IN 46142
$-370
Cash flow
-6.2%
Cash-on-Cash Return
4.7%
Cap rate
0.6%
Rent to Value Ratio
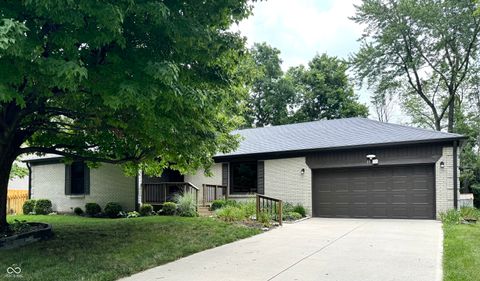
Active
$345,000
4
bds
|
3
ba
|
2,016
sqft
|
built
1976
336 N Windsong Ln, Greenwood, IN 46142
$-42
Cash flow
-0.6%
Cash-on-Cash Return
6.0%
Cap rate
0.7%
Rent to Value Ratio