46142 Investment Properties for Sale
Browse homes for sale and investment properties in 46142. Refine your search by price, property type, or more.
Best cash flowing properties in 46142
Active
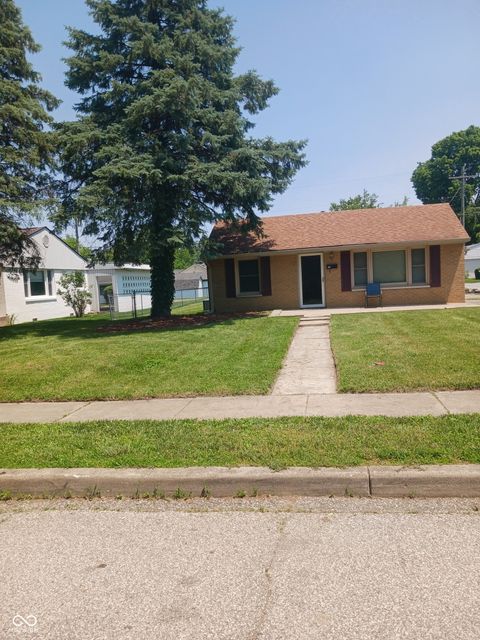
$202,000
3
bds
|
1
ba
|
1,248
sqft
|
built
1956
351 N Smart St, Greenwood, IN 46142
$49
Cash flow
1.3%
Cash-on-Cash Return
6.6%
Cap rate
0.8%
Rent to Value Ratio

Active
$230,000
3
bds
|
1
ba
|
1,048
sqft
|
built
1963
975 Rolling Hill Rd, Greenwood, IN 46142
$41
Cash flow
0.9%
Cash-on-Cash Return
6.5%
Cap rate
0.8%
Rent to Value Ratio
23 out of 51 properties for sale in 46142
Limited Results Shown
Create a free account, or log in to reveal all property listings and enjoy the complete experience.
Active
$615,000
5
bds
|
4
ba
|
6,808
sqft
|
built
1999
545 Walnut Woods Dr, Greenwood, IN 46142
$-819
Cash flow
-6.9%
Cash-on-Cash Return
4.7%
Cap rate
0.6%
Rent to Value Ratio
Active
$202,000
3
bds
|
1
ba
|
1,248
sqft
|
built
1956
351 N Smart St, Greenwood, IN 46142
$49
Cash flow
1.3%
Cash-on-Cash Return
6.6%
Cap rate
0.8%
Rent to Value Ratio
Active
$650,000
5
bds
|
5
ba
|
4,680
sqft
|
built
1988
1021 Hudson Bay Dr, Greenwood, IN 46142
$-1,185
Cash flow
-9.5%
Cash-on-Cash Return
4.1%
Cap rate
0.5%
Rent to Value Ratio
Active
$365,000
3
bds
|
3
ba
|
2,545
sqft
|
built
1973
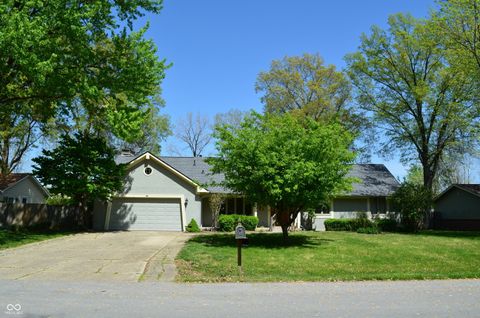
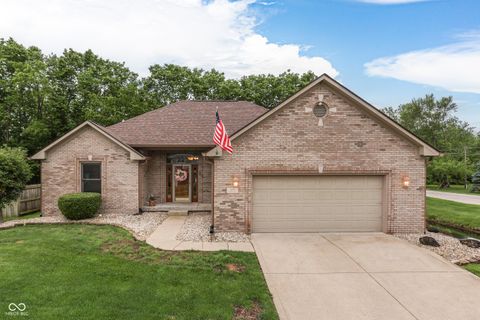
629 Williamsburg Ln, Greenwood, IN 46142
$-388
Cash flow
-5.5%
Cash-on-Cash Return
5.0%
Cap rate
0.6%
Rent to Value Ratio
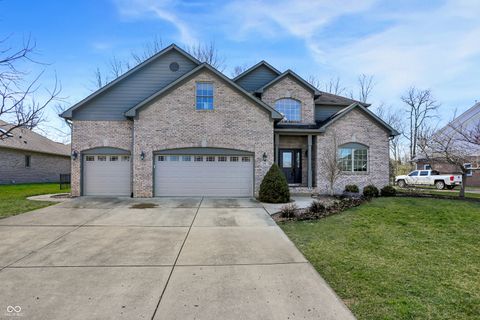
Active
$599,999
4
bds
|
3
ba
|
3,691
sqft
|
built
2005
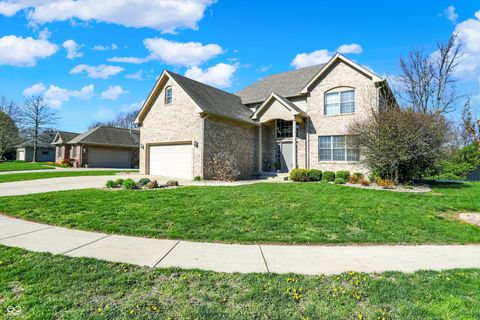
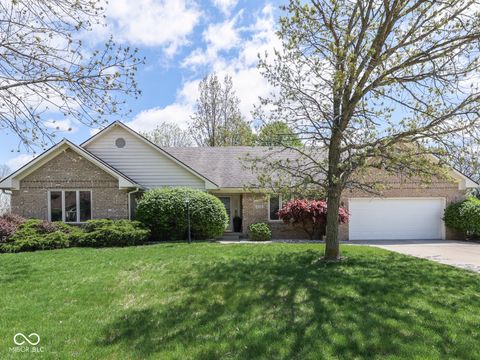
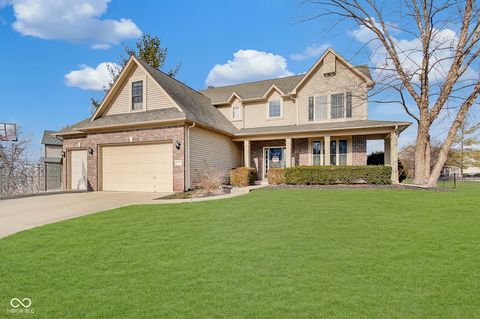
386 White Oak Ln, Greenwood, IN 46142
$-1,361
Cash flow
-11.8%
Cash-on-Cash Return
3.5%
Cap rate
0.4%
Rent to Value Ratio

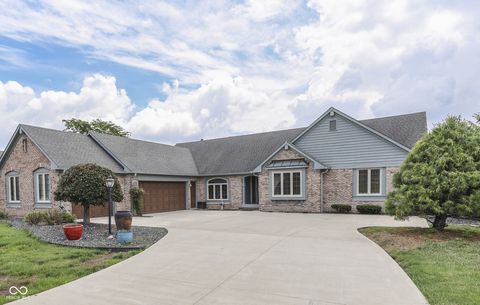
Active
$543,000
4
bds
|
3
ba
|
3,820
sqft
|
built
1995
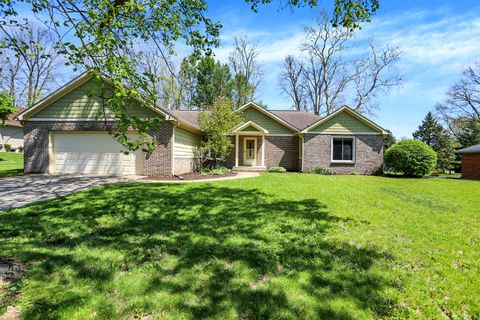
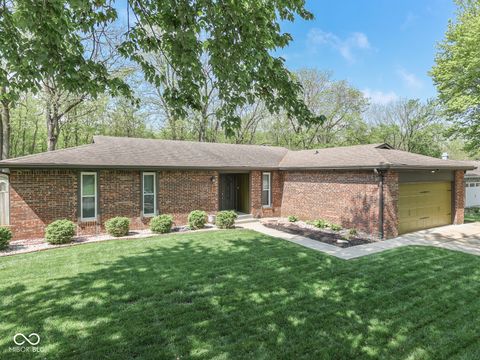
1160 Mount Vernon Dr, Greenwood, IN 46142
$-438
Cash flow
-4.2%
Cash-on-Cash Return
5.3%
Cap rate
0.6%
Rent to Value Ratio
Active
$230,000
3
bds
|
1
ba
|
1,048
sqft
|
built
1963
975 Rolling Hill Rd, Greenwood, IN 46142
$41
Cash flow
0.9%
Cash-on-Cash Return
6.5%
Cap rate
0.8%
Rent to Value Ratio
Active
$299,900
3
bds
|
2
ba
|
1,471
sqft
|
built
1960
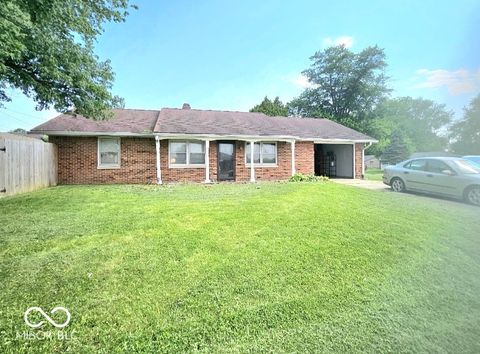
705 Orchard Ln, Greenwood, IN 46142
$-393
Cash flow
-6.8%
Cash-on-Cash Return
4.7%
Cap rate
0.6%
Rent to Value Ratio
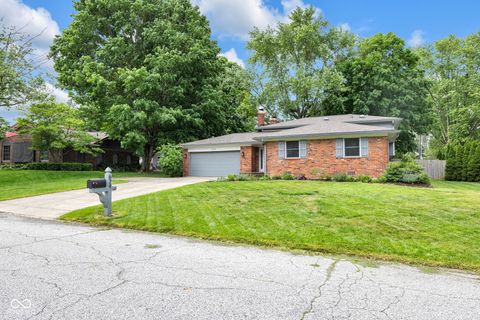
Active
$365,000
4
bds
|
3
ba
|
1,908
sqft
|
built
1970
750 Hillcrest Dr, Greenwood, IN 46142
$-526
Cash flow
-7.5%
Cash-on-Cash Return
4.5%
Cap rate
0.5%
Rent to Value Ratio
Active
$355,000
4
bds
|
3
ba
|
2,353
sqft
|
built
1973
955 Wood Creek Pl, Greenwood, IN 46142
$-128
Cash flow
-1.9%
Cash-on-Cash Return
5.8%
Cap rate
0.7%
Rent to Value Ratio
Active
$315,000
3
bds
|
2
ba
|
2,172
sqft
|
built
1973
931 Beech Dr, Greenwood, IN 46142
$-334
Cash flow
-5.5%
Cash-on-Cash Return
5.0%
Cap rate
0.6%
Rent to Value Ratio
Active
$400,000
3
bds
|
3
ba
|
1,984
sqft
|
built
1991
4759 Silver Hill Dr, Greenwood, IN 46142
$-382
Cash flow
-5.0%
Cash-on-Cash Return
5.1%
Cap rate
0.6%
Rent to Value Ratio
Active
$345,000
3
bds
|
2
ba
|
1,875
sqft
|
built
1972
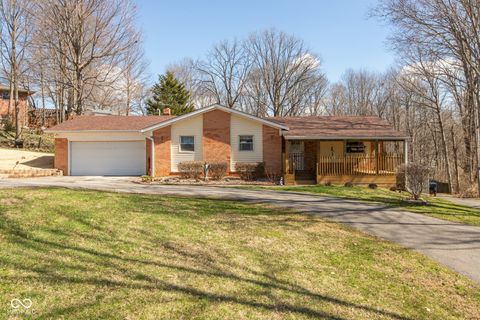
601 Shady Ln, Greenwood, IN 46142
$-308
Cash flow
-4.7%
Cash-on-Cash Return
5.2%
Cap rate
0.6%
Rent to Value Ratio
Active
$265,000
3
bds
|
2
ba
|
1,260
sqft
|
built
1960
731 Sunset Blvd, Greenwood, IN 46142
$-210
Cash flow
-4.1%
Cash-on-Cash Return
5.3%
Cap rate
0.6%
Rent to Value Ratio
Active
$365,000
3
bds
|
2
ba
|
1,832
sqft
|
built
1965
251 Howard Rd, Greenwood, IN 46142
$-319
Cash flow
-4.6%
Cash-on-Cash Return
5.2%
Cap rate
0.6%
Rent to Value Ratio
Active
$335,000
4
bds
|
2
ba
|
1,844
sqft
|
built
1970
386 Shadow Hill Dr, Greenwood, IN 46142
$-369
Cash flow
-5.7%
Cash-on-Cash Return
4.9%
Cap rate
0.6%
Rent to Value Ratio

Active
$415,000
4
bds
|
3
ba
|
2,048
sqft
|
built
1976
4155 Rolling Trails Rd, Greenwood, IN 46142
$-442
Cash flow
-5.6%
Cash-on-Cash Return
5.0%
Cap rate
0.6%
Rent to Value Ratio
Active
$289,999
3
bds
|
2
ba
|
1,774
sqft
|
built
1967
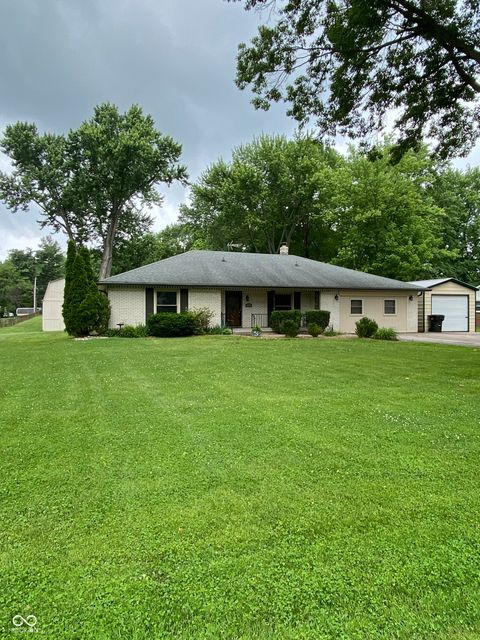
5585 Gallagher Dr, Greenwood, IN 46142
$-272
Cash flow
-4.9%
Cash-on-Cash Return
5.1%
Cap rate
0.6%
Rent to Value Ratio
Active
$350,000
3
bds
|
2
ba
|
2,054
sqft
|
built
1978
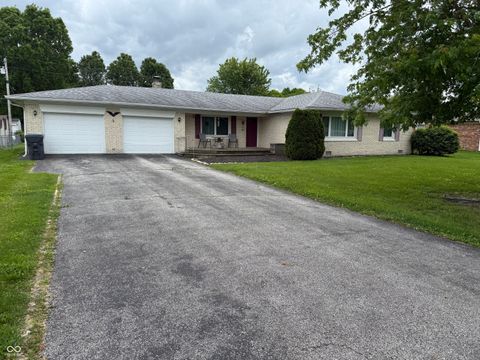
640 Shady Creek Ct, Greenwood, IN 46142
$-309
Cash flow
-4.6%
Cash-on-Cash Return
5.2%
Cap rate
0.6%
Rent to Value Ratio
Active
$369,000
3
bds
|
2
ba
|
1,853
sqft
|
built
2003
5499 Steven Dr, Greenwood, IN 46142
$-226
Cash flow
-3.2%
Cash-on-Cash Return
5.5%
Cap rate
0.7%
Rent to Value Ratio
Active
$249,900
3
bds
|
2
ba
|
1,190
sqft
|
built
1970
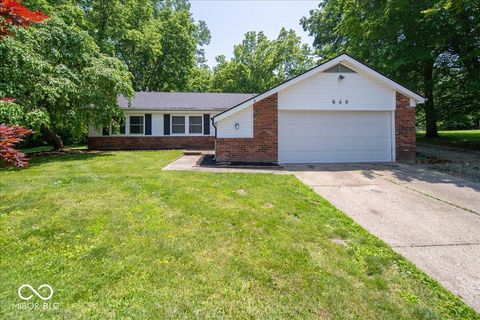
935 Fry Rd, Greenwood, IN 46142
$-63
Cash flow
-1.3%
Cash-on-Cash Return
6.0%
Cap rate
0.7%
Rent to Value Ratio
Active
$399,900
4
bds
|
3
ba
|
2,333
sqft
|
built
2003
5230 Berkshire South Blvd, Greenwood, IN 46142
$-194
Cash flow
-2.5%
Cash-on-Cash Return
5.7%
Cap rate
0.7%
Rent to Value Ratio
Active
$375,000
3
bds
|
3
ba
|
2,824
sqft
|
built
1973
748 Woodcreek Ct, Greenwood, IN 46142
$-371
Cash flow
-5.2%
Cash-on-Cash Return
5.1%
Cap rate
0.6%
Rent to Value Ratio