46205 Investment Properties for Sale
Browse homes for sale and investment properties in 46205. Refine your search by price, property type, or more.
Best cash flowing properties in 46205
Active
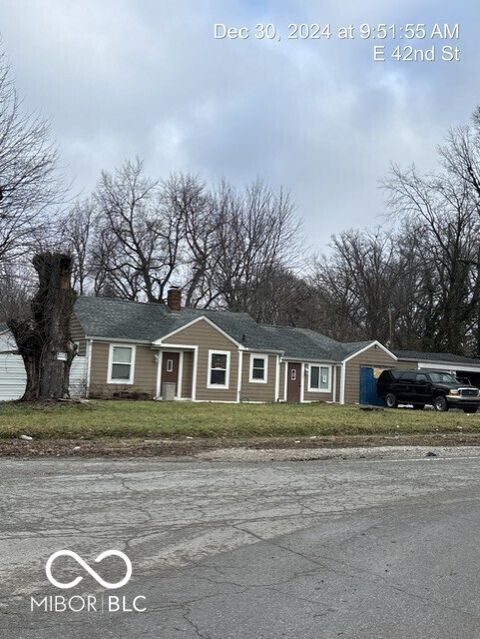
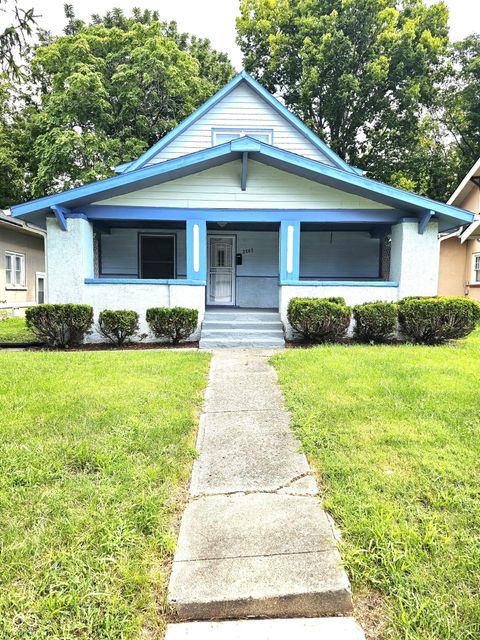
$140,000
3
bds
|
2
ba
|
1,204
sqft
|
built
1950
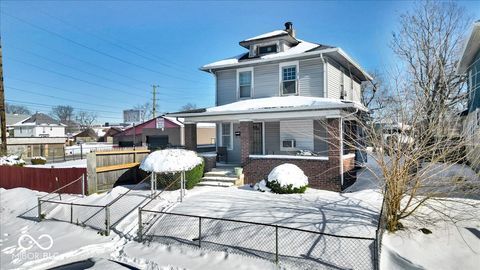
3302 E 42nd St, Indianapolis, IN 46205
$525
Cash flow
19.6%
Cash-on-Cash Return
10.6%
Cap rate
1.3%
Rent to Value Ratio

Active
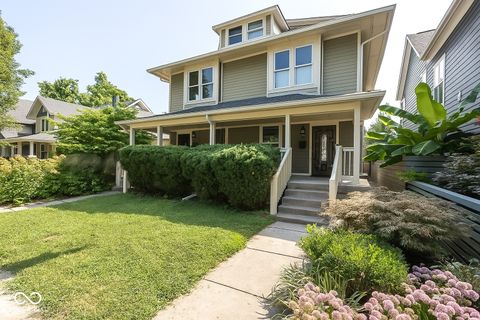
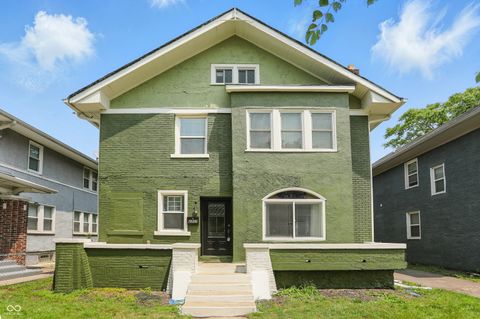
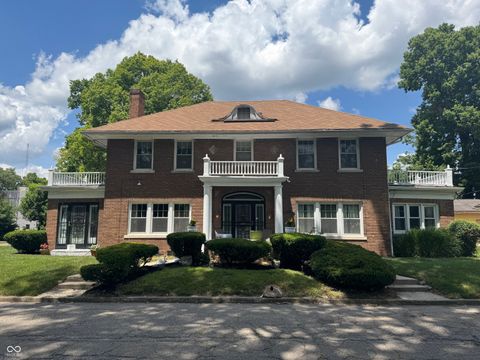
$305,000
4
bds
|
2
ba
|
2,841
sqft
|
built
1910
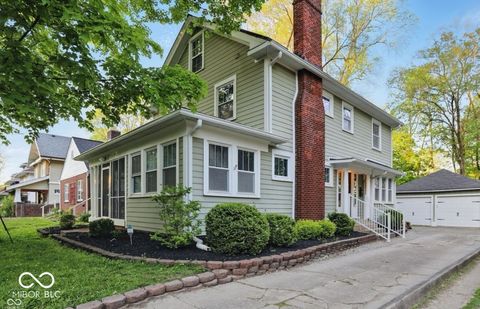
2508 Carrollton Ave, Indianapolis, IN 46205
$370
Cash flow
6.3%
Cash-on-Cash Return
7.6%
Cap rate
0.9%
Rent to Value Ratio
111 out of 123 properties for sale in 46205
Limited Results Shown
Create a free account, or log in to reveal all property listings and enjoy the complete experience.
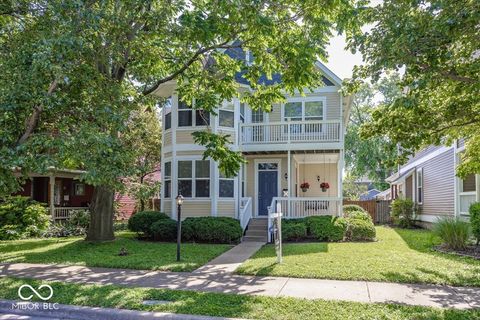
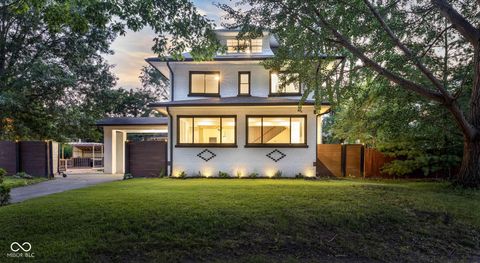
Active
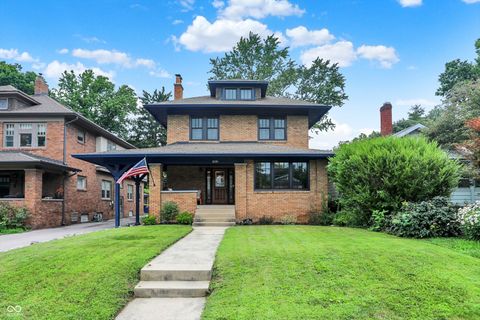
$439,000
3
bds
|
3
ba
|
3,026
sqft
|
built
1980
2233 N Talbott St, Indianapolis, IN 46205
$-317
Cash flow
-3.8%
Cash-on-Cash Return
5.3%
Cap rate
0.6%
Rent to Value Ratio
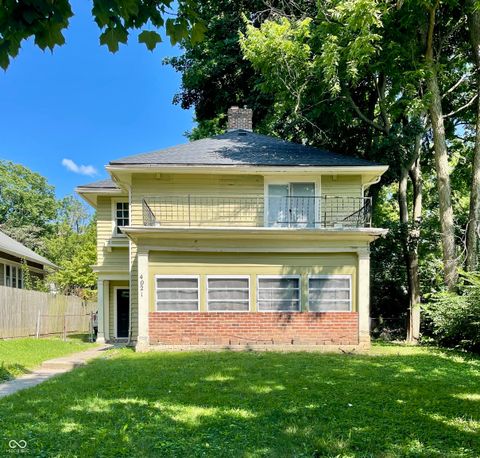
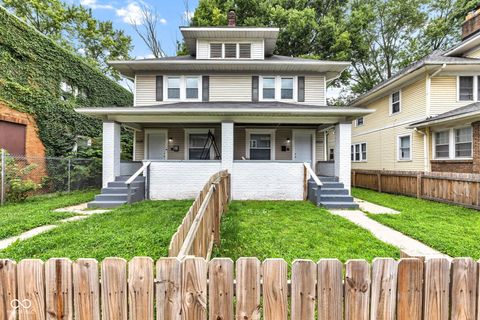
Active
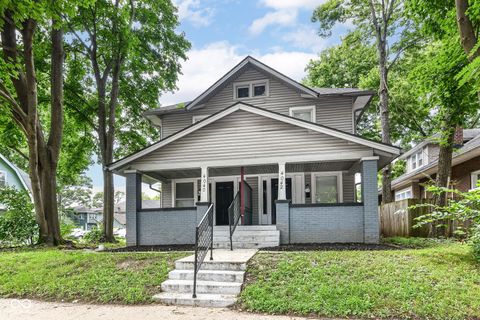
$300,000
4
bds
|
3
ba
|
2,578
sqft
|
built
1922
4021 Guilford Ave, Indianapolis, IN 46205
$50
Cash flow
0.9%
Cash-on-Cash Return
6.3%
Cap rate
0.8%
Rent to Value Ratio
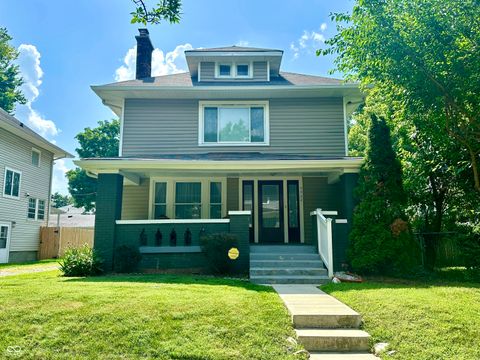
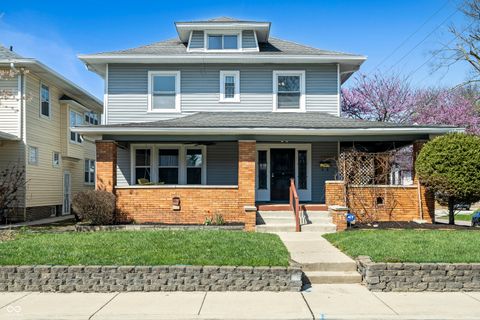
Active
$399,900
3
bds
|
2
ba
|
2,060
sqft
|
built
1914
3922 N Park Ave, Indianapolis, IN 46205
$-116
Cash flow
-1.5%
Cash-on-Cash Return
5.8%
Cap rate
0.7%
Rent to Value Ratio
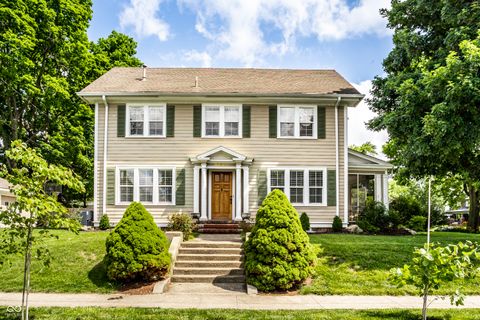
Active
$450,000
3
bds
|
3
ba
|
2,930
sqft
|
built
2004
2325 N Talbott St, Indianapolis, IN 46205
$91
Cash flow
1.1%
Cash-on-Cash Return
6.4%
Cap rate
0.8%
Rent to Value Ratio
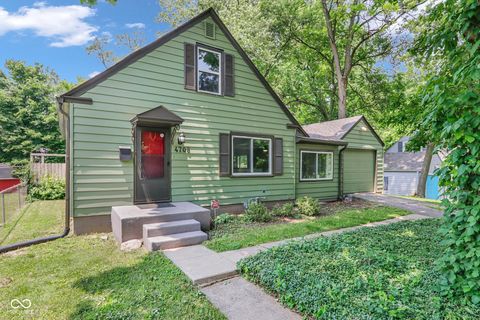
Active
$269,900
3
bds
|
2
ba
|
1,620
sqft
|
built
1947
4708 Haverford Ave, Indianapolis, IN 46205
$66
Cash flow
1.3%
Cash-on-Cash Return
6.4%
Cap rate
0.8%
Rent to Value Ratio

Active
$329,900
3
bds
|
3
ba
|
1,440
sqft
|
built
2003
2434 N Pennsylvania St, Indianapolis, IN 46205
$-191
Cash flow
-3.0%
Cash-on-Cash Return
5.5%
Cap rate
0.7%
Rent to Value Ratio

Active
$269,900
2
bds
|
1
ba
|
1,056
sqft
|
built
1915
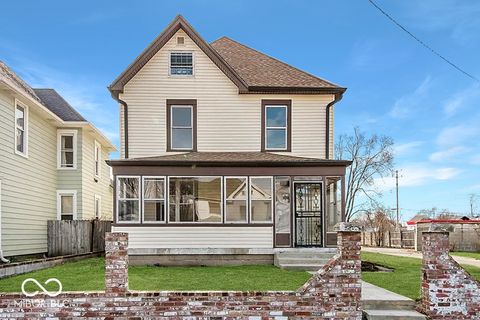
923 E 42nd St, Indianapolis, IN 46205
$342
Cash flow
6.6%
Cash-on-Cash Return
7.7%
Cap rate
0.9%
Rent to Value Ratio
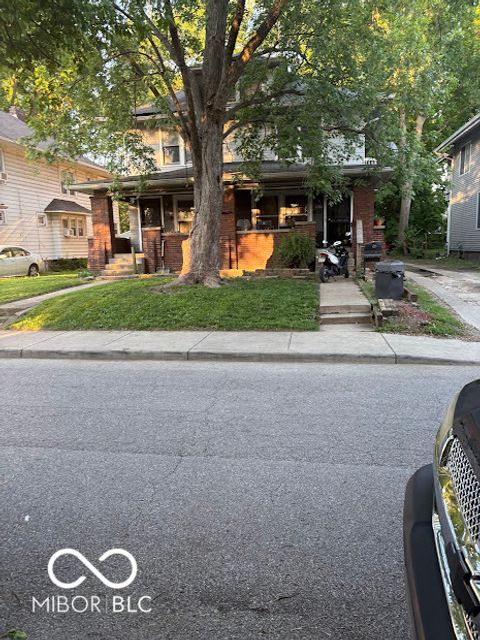
Active
$298,000
4
bds
|
0
ba
|
0
sqft
|
built
1917
3837 Carrollton Ave, Indianapolis, IN 46205
$-630
Cash flow
-11.0%
Cash-on-Cash Return
3.6%
Cap rate
0.4%
Rent to Value Ratio
Active
$190,000
2
bds
|
2
ba
|
2,148
sqft
|
built
1955
114 E 27th St, Indianapolis, IN 46205
$109
Cash flow
3.0%
Cash-on-Cash Return
6.8%
Cap rate
0.9%
Rent to Value Ratio
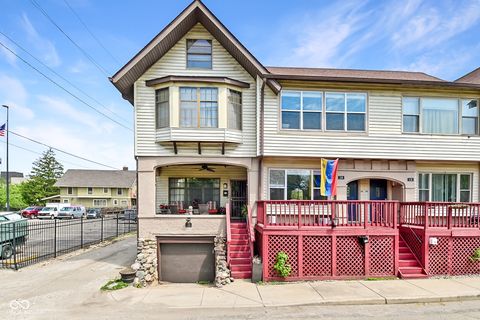
Active
$549,900
5
bds
|
3
ba
|
2,945
sqft
|
built
1923
4447 N College Ave, Indianapolis, IN 46205
$-816
Cash flow
-7.7%
Cash-on-Cash Return
4.4%
Cap rate
0.5%
Rent to Value Ratio
Active
$345,000
4
bds
|
2
ba
|
3,001
sqft
|
built
1915
4029 Broadway St, Indianapolis, IN 46205
$-42
Cash flow
-0.6%
Cash-on-Cash Return
6.0%
Cap rate
0.7%
Rent to Value Ratio
Active
$400,000
5
bds
|
3
ba
|
2,944
sqft
|
built
1915
2450 Carrollton Ave, Indianapolis, IN 46205
$90
Cash flow
1.2%
Cash-on-Cash Return
6.4%
Cap rate
0.8%
Rent to Value Ratio
Active
$335,000
3
bds
|
3
ba
|
1,828
sqft
|
built
2010
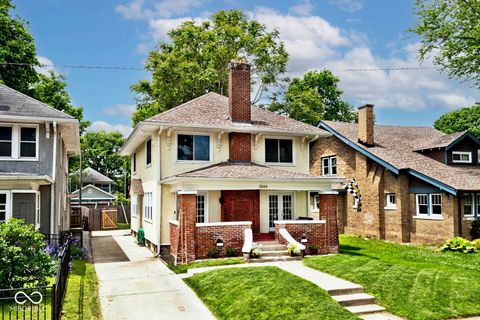
3544 Guilford Ave, Indianapolis, IN 46205
$9
Cash flow
0.1%
Cash-on-Cash Return
6.2%
Cap rate
0.7%
Rent to Value Ratio
Active
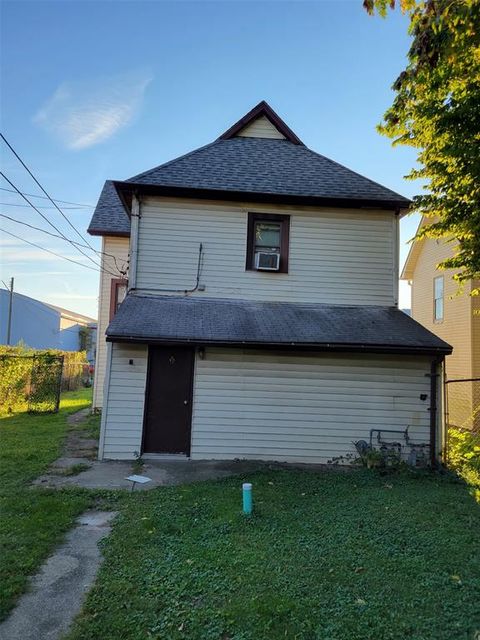
$180,000
2
bds
|
1
ba
|
1,140
sqft
|
built
1918
2957 Winthrop Ave, Indianapolis, IN 46205
$44
Cash flow
1.3%
Cash-on-Cash Return
6.4%
Cap rate
0.8%
Rent to Value Ratio
Active
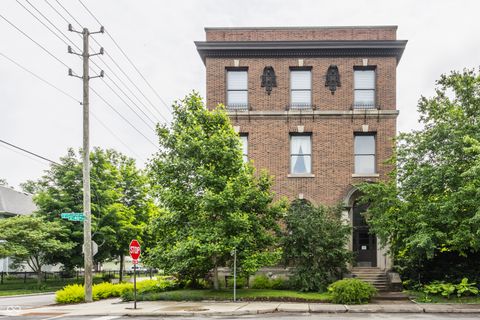
$1,450,000
2
bds
|
2
ba
|
10,312
sqft
|
built
1915
3959 Central Ave, Indianapolis, IN 46205
$-6,048
Cash flow
-21.8%
Cash-on-Cash Return
1.1%
Cap rate
0.1%
Rent to Value Ratio
Active
$224,900
3
bds
|
0
ba
|
0
sqft
|
built
1900
2520 Winthrop Ave, Indianapolis, IN 46205
$-186
Cash flow
-4.3%
Cash-on-Cash Return
5.2%
Cap rate
0.6%
Rent to Value Ratio
Active
$324,000
3
bds
|
3
ba
|
2,544
sqft
|
built
1921
3307 N College Ave, Indianapolis, IN 46205
$-418
Cash flow
-6.7%
Cash-on-Cash Return
4.6%
Cap rate
0.6%
Rent to Value Ratio
Active
$349,900
4
bds
|
3
ba
|
2,247
sqft
|
built
1913
3356 N Park Ave, Indianapolis, IN 46205
$2
Cash flow
0.0%
Cash-on-Cash Return
6.2%
Cap rate
0.7%
Rent to Value Ratio
Active
$450,000
3
bds
|
0
ba
|
0
sqft
|
built
1900
2623 Guilford Ave, Indianapolis, IN 46205
$-1,201
Cash flow
-13.9%
Cash-on-Cash Return
2.9%
Cap rate
0.4%
Rent to Value Ratio
Active
$399,900
4
bds
|
3
ba
|
3,861
sqft
|
built
1920
909 E 38th St, Indianapolis, IN 46205
$-323
Cash flow
-4.2%
Cash-on-Cash Return
5.2%
Cap rate
0.6%
Rent to Value Ratio

Active
$253,000
3
bds
|
2
ba
|
1,696
sqft
|
built
1955
2641 Guilford Ave, Indianapolis, IN 46205
$84
Cash flow
1.7%
Cash-on-Cash Return
6.5%
Cap rate
0.8%
Rent to Value Ratio
Active
$225,000
4
bds
|
1
ba
|
1,809
sqft
|
built
1910
2534 Carrollton Ave, Indianapolis, IN 46205
$-187
Cash flow
-4.3%
Cash-on-Cash Return
5.2%
Cap rate
0.6%
Rent to Value Ratio
Active
$386,900
4
bds
|
2
ba
|
3,046
sqft
|
built
1947
1221 E 52nd St, Indianapolis, IN 46205
$-809
Cash flow
-10.9%
Cash-on-Cash Return
3.6%
Cap rate
0.4%
Rent to Value Ratio
Active
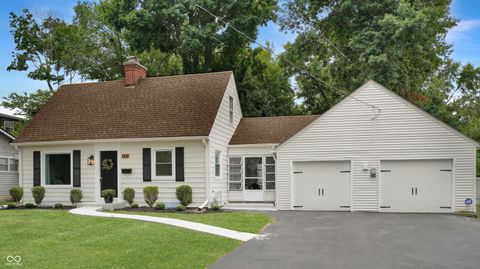
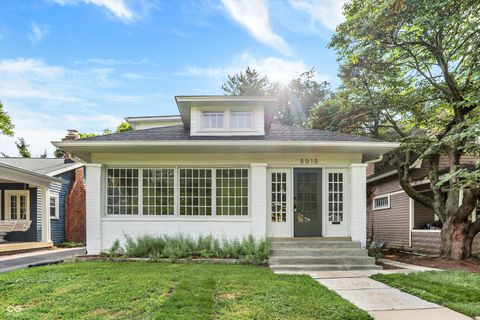
$639,900
3
bds
|
3
ba
|
1,868
sqft
|
built
1921
5015 Broadway St, Indianapolis, IN 46205
$-2,312
Cash flow
-18.9%
Cash-on-Cash Return
1.8%
Cap rate
0.2%
Rent to Value Ratio
Active
$375,000
5
bds
|
1
ba
|
2,054
sqft
|
built
1910
104 E 38th St, Indianapolis, IN 46205
$80
Cash flow
1.1%
Cash-on-Cash Return
6.4%
Cap rate
0.8%
Rent to Value Ratio
Active
$229,900
2
bds
|
1
ba
|
950
sqft
|
built
1925
3923 Winthrop Ave, Indianapolis, IN 46205
$-419
Cash flow
-9.5%
Cash-on-Cash Return
4.0%
Cap rate
0.5%
Rent to Value Ratio
Active
$599,000
3
bds
|
4
ba
|
3,356
sqft
|
built
1920
3118 E Fall Creek Parkway North Dr, Indianapolis, IN 46205
$-1,481
Cash flow
-12.9%
Cash-on-Cash Return
3.2%
Cap rate
0.4%
Rent to Value Ratio
Active
$380,000
2
bds
|
0
ba
|
0
sqft
|
built
1911
3626 Birchwood Ave, Indianapolis, IN 46205
$-843
Cash flow
-11.6%
Cash-on-Cash Return
3.5%
Cap rate
0.4%
Rent to Value Ratio
Active
$348,000
5
bds
|
4
ba
|
3,078
sqft
|
built
1925
3970 Broadway St, Indianapolis, IN 46205
$-265
Cash flow
-4.0%
Cash-on-Cash Return
5.2%
Cap rate
0.6%
Rent to Value Ratio
Active
$674,900
4
bds
|
4
ba
|
2,930
sqft
|
built
1918
4904 Washington Blvd, Indianapolis, IN 46205
$-973
Cash flow
-7.5%
Cash-on-Cash Return
4.4%
Cap rate
0.5%
Rent to Value Ratio

Active
$415,000
3
bds
|
3
ba
|
1,844
sqft
|
built
1914
4040 Carrollton Ave, Indianapolis, IN 46205
$82
Cash flow
1.0%
Cash-on-Cash Return
6.4%
Cap rate
0.8%
Rent to Value Ratio
Active
$254,900
4
bds
|
3
ba
|
2,048
sqft
|
built
1940
3565 Evergreen Ave, Indianapolis, IN 46205
$-409
Cash flow
-8.4%
Cash-on-Cash Return
4.2%
Cap rate
0.5%
Rent to Value Ratio

Active
$215,000
4
bds
|
2
ba
|
1,640
sqft
|
built
1953
3006 E 45th St, Indianapolis, IN 46205
$141
Cash flow
3.4%
Cash-on-Cash Return
6.9%
Cap rate
0.8%
Rent to Value Ratio
Active
$325,000
3
bds
|
4
ba
|
2,184
sqft
|
built
1955
3733 Winthrop Ave, Indianapolis, IN 46205
$-285
Cash flow
-4.6%
Cash-on-Cash Return
5.1%
Cap rate
0.6%
Rent to Value Ratio
Active
$635,000
3
bds
|
3
ba
|
1,966
sqft
|
built
1924
206 E 51st St, Indianapolis, IN 46205
$-562
Cash flow
-4.6%
Cash-on-Cash Return
5.1%
Cap rate
0.6%
Rent to Value Ratio
Active
$389,900
0
bds
|
0
ba
|
0
sqft
|
built
1910
4040 N College Ave, Indianapolis, IN 46205
$-824
Cash flow
-11.0%
Cash-on-Cash Return
3.6%
Cap rate
0.4%
Rent to Value Ratio

Active
$220,000
4
bds
|
2
ba
|
1,888
sqft
|
built
1920
518 Central Ct S, Indianapolis, IN 46205
$253
Cash flow
6.0%
Cash-on-Cash Return
7.5%
Cap rate
0.9%
Rent to Value Ratio
Active
$245,000
2
bds
|
1
ba
|
826
sqft
|
built
1925
4926 Crittenden Ave, Indianapolis, IN 46205
$125
Cash flow
2.7%
Cash-on-Cash Return
6.8%
Cap rate
0.8%
Rent to Value Ratio