46208 Investment Properties for Sale
Browse homes for sale and investment properties in 46208. Refine your search by price, property type, or more.
Best cash flowing properties in 46208
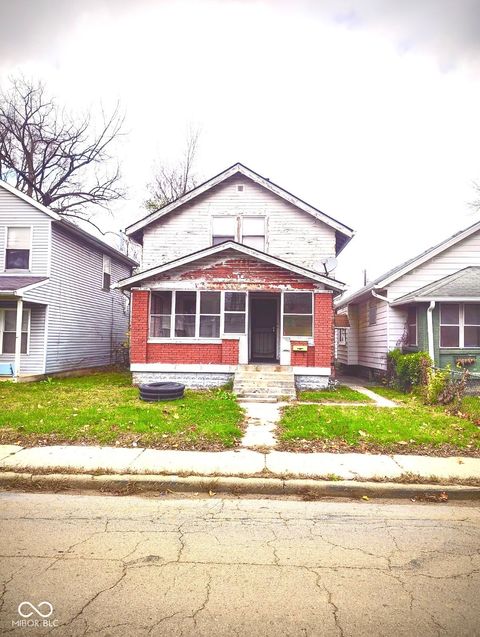
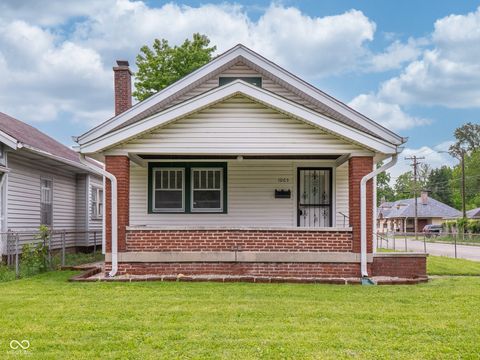
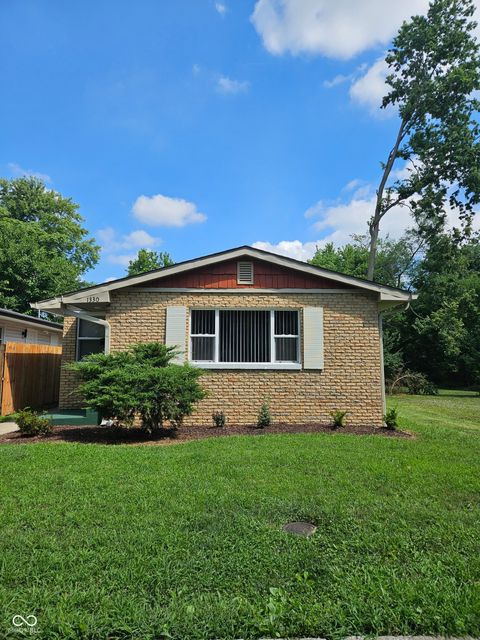
Active
$87,500
2
bds
|
1
ba
|
1,232
sqft
|
built
1955
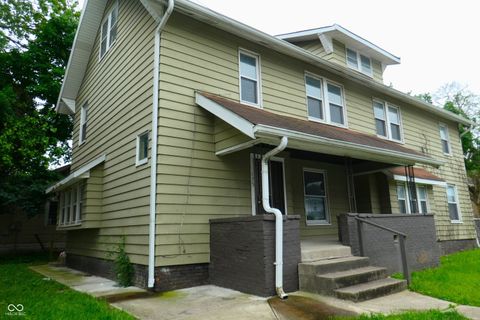
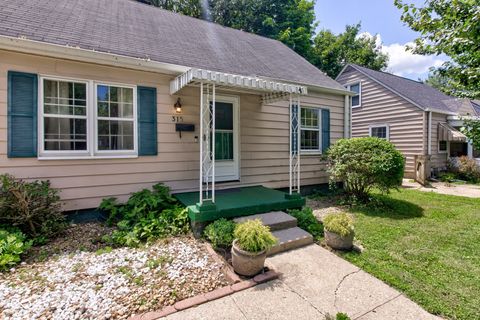
1166 W 29th St, Indianapolis, IN 46208
$587
Cash flow
35.0%
Cash-on-Cash Return
14.2%
Cap rate
1.7%
Rent to Value Ratio

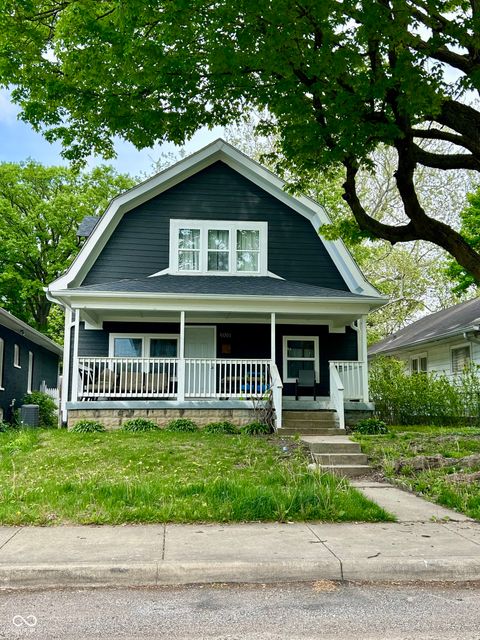
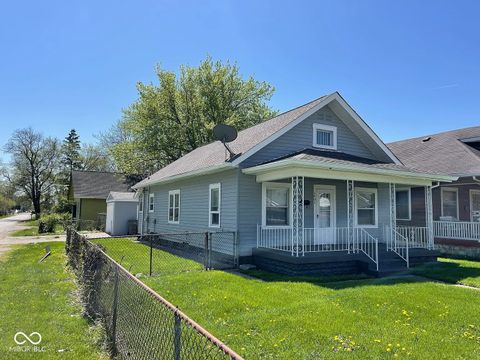
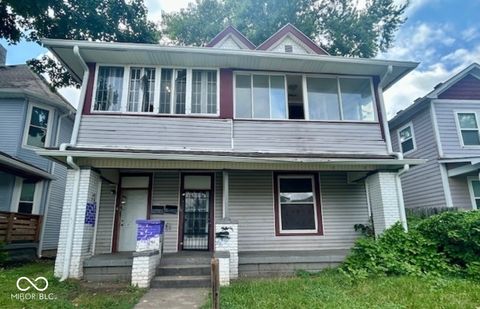
Active
$76,000
4
bds
|
3
ba
|
1,538
sqft
|
built
1920
1014 W 33rd St, Indianapolis, IN 46208
$508
Cash flow
34.9%
Cash-on-Cash Return
14.2%
Cap rate
1.7%
Rent to Value Ratio
62 out of 75 properties for sale in 46208
Limited Results Shown
Create a free account, or log in to reveal all property listings and enjoy the complete experience.
Active
$315,000
4
bds
|
3
ba
|
1,999
sqft
|
built
1920
4061 Byram Ave, Indianapolis, IN 46208
$-27
Cash flow
-0.4%
Cash-on-Cash Return
6.0%
Cap rate
0.7%
Rent to Value Ratio
Active
$120,000
1
bds
|
1
ba
|
941
sqft
|
built
1965
3965 N Meridian St, Indianapolis, IN 46208
$-28
Cash flow
-1.2%
Cash-on-Cash Return
5.9%
Cap rate
1.3%
Rent to Value Ratio
Active
$180,000
3
bds
|
2
ba
|
1,417
sqft
|
built
1920
713 W 32nd St, Indianapolis, IN 46208
$-232
Cash flow
-6.7%
Cash-on-Cash Return
4.6%
Cap rate
0.6%
Rent to Value Ratio
Active
$173,000
2
bds
|
1
ba
|
1,114
sqft
|
built
1920
1065 W 36th St, Indianapolis, IN 46208
$80
Cash flow
2.4%
Cash-on-Cash Return
6.7%
Cap rate
0.8%
Rent to Value Ratio
Active
$142,000
2
bds
|
1
ba
|
960
sqft
|
built
1930
1401 W 34th St, Indianapolis, IN 46208
$239
Cash flow
8.8%
Cash-on-Cash Return
8.2%
Cap rate
1.0%
Rent to Value Ratio

Active
$164,900
3
bds
|
2
ba
|
1,020
sqft
|
built
1920
3636 Crescent Ave, Indianapolis, IN 46208
$121
Cash flow
3.8%
Cash-on-Cash Return
7.0%
Cap rate
0.8%
Rent to Value Ratio
Active
$344,900
4
bds
|
4
ba
|
2,491
sqft
|
built
1911
1141 W 35th St, Indianapolis, IN 46208
$165
Cash flow
2.5%
Cash-on-Cash Return
6.7%
Cap rate
0.8%
Rent to Value Ratio

Active
$825,000
4
bds
|
4
ba
|
3,198
sqft
|
built
1890
4130 N Meridian St, Indianapolis, IN 46208
$-1,535
Cash flow
-9.7%
Cash-on-Cash Return
3.9%
Cap rate
0.5%
Rent to Value Ratio

Active
$209,900
3
bds
|
2
ba
|
1,556
sqft
|
built
1920
3458 N Kenwood Ave, Indianapolis, IN 46208
$98
Cash flow
2.4%
Cash-on-Cash Return
6.7%
Cap rate
0.8%
Rent to Value Ratio
Active
$339,000
4
bds
|
3
ba
|
1,970
sqft
|
built
1909
3936 Graceland Ave, Indianapolis, IN 46208
$-219
Cash flow
-3.4%
Cash-on-Cash Return
5.4%
Cap rate
0.6%
Rent to Value Ratio
Active
$159,000
3
bds
|
1
ba
|
1,088
sqft
|
built
1963
1330 W Pruitt St, Indianapolis, IN 46208
$290
Cash flow
9.5%
Cash-on-Cash Return
8.3%
Cap rate
1.0%
Rent to Value Ratio
Active
$169,999
0
bds
|
0
ba
|
0
sqft
|
built
1910
2918 N Kenwood Ave, Indianapolis, IN 46208
$-181
Cash flow
-5.6%
Cash-on-Cash Return
4.9%
Cap rate
0.6%
Rent to Value Ratio
Active
$159,900
2
bds
|
0
ba
|
0
sqft
|
built
1956
1263 W 32nd St, Indianapolis, IN 46208
$-60
Cash flow
-2.0%
Cash-on-Cash Return
5.7%
Cap rate
0.7%
Rent to Value Ratio
Active
$230,000
3
bds
|
0
ba
|
0
sqft
|
built
1910
3502 N Kenwood Ave, Indianapolis, IN 46208
$-419
Cash flow
-9.5%
Cash-on-Cash Return
4.0%
Cap rate
0.5%
Rent to Value Ratio
Active
$179,900
3
bds
|
0
ba
|
0
sqft
|
built
1920
3469 N Capitol Ave, Indianapolis, IN 46208
$-163
Cash flow
-4.7%
Cash-on-Cash Return
5.1%
Cap rate
0.6%
Rent to Value Ratio
Active
$172,900
0
bds
|
0
ba
|
0
sqft
|
built
1917
2913 Boulevard Pl, Indianapolis, IN 46208
$-58
Cash flow
-1.8%
Cash-on-Cash Return
5.7%
Cap rate
0.7%
Rent to Value Ratio

Active
$450,000
3
bds
|
3
ba
|
2,340
sqft
|
built
1940
4629 Cornelius Ave, Indianapolis, IN 46208
$-373
Cash flow
-4.3%
Cash-on-Cash Return
5.2%
Cap rate
0.6%
Rent to Value Ratio

Active
$165,000
4
bds
|
2
ba
|
2,002
sqft
|
built
1920
1354 Edgemont Ave, Indianapolis, IN 46208
$52
Cash flow
1.6%
Cash-on-Cash Return
6.5%
Cap rate
0.8%
Rent to Value Ratio
Active
$335,000
3
bds
|
3
ba
|
2,948
sqft
|
built
1952
3805 Byram Ave, Indianapolis, IN 46208
$216
Cash flow
3.4%
Cash-on-Cash Return
6.9%
Cap rate
0.8%
Rent to Value Ratio
Active
$649,999
4
bds
|
0
ba
|
0
sqft
|
built
1915
4155 Graceland Ave, Indianapolis, IN 46208
$-2,088
Cash flow
-16.8%
Cash-on-Cash Return
2.3%
Cap rate
0.3%
Rent to Value Ratio
Active
$459,000
4
bds
|
3
ba
|
2,188
sqft
|
built
1930
140 W Hampton Dr, Indianapolis, IN 46208
$-350
Cash flow
-4.0%
Cash-on-Cash Return
5.2%
Cap rate
0.6%
Rent to Value Ratio
Active
$124,900
2
bds
|
1
ba
|
1,196
sqft
|
built
1920
4041 Boulevard Pl, Indianapolis, IN 46208
$326
Cash flow
13.6%
Cash-on-Cash Return
9.3%
Cap rate
1.1%
Rent to Value Ratio

Active
$109,900
3
bds
|
2
ba
|
1,928
sqft
|
built
1910
1207 W 35th St, Indianapolis, IN 46208
$265
Cash flow
12.6%
Cash-on-Cash Return
9.0%
Cap rate
1.1%
Rent to Value Ratio
Active
$260,000
3
bds
|
2
ba
|
1,600
sqft
|
built
1920
236 W 33rd St, Indianapolis, IN 46208
$-504
Cash flow
-10.1%
Cash-on-Cash Return
3.8%
Cap rate
0.5%
Rent to Value Ratio
Active
$109,000
2
bds
|
1
ba
|
672
sqft
|
built
1930
1445 W 34th St, Indianapolis, IN 46208
$201
Cash flow
9.6%
Cash-on-Cash Return
8.4%
Cap rate
1.0%
Rent to Value Ratio
Active
$215,000
2
bds
|
0
ba
|
0
sqft
|
built
1927
2862 Highland Pl, Indianapolis, IN 46208
$-411
Cash flow
-10.0%
Cash-on-Cash Return
3.9%
Cap rate
0.5%
Rent to Value Ratio

Active
$399,000
3
bds
|
2
ba
|
2,595
sqft
|
built
1925
4913 N Capitol Ave, Indianapolis, IN 46208
$-112
Cash flow
-1.5%
Cash-on-Cash Return
5.8%
Cap rate
0.7%
Rent to Value Ratio

Active
$335,000
3
bds
|
3
ba
|
1,805
sqft
|
built
1930
244 W 43rd St, Indianapolis, IN 46208
$78
Cash flow
1.2%
Cash-on-Cash Return
6.4%
Cap rate
0.8%
Rent to Value Ratio
Active
$100,000
3
bds
|
1
ba
|
872
sqft
|
built
1900
1206 W 25th St, Indianapolis, IN 46208
$247
Cash flow
12.9%
Cash-on-Cash Return
9.1%
Cap rate
1.1%
Rent to Value Ratio

Active
$2,035,000
4
bds
|
6
ba
|
5,082
sqft
|
built
1917
4621 N Meridian St, Indianapolis, IN 46208
$-4,835
Cash flow
-12.4%
Cash-on-Cash Return
3.3%
Cap rate
0.4%
Rent to Value Ratio

Active
$170,000
4
bds
|
2
ba
|
1,296
sqft
|
built
1972
3106 N Harding St, Indianapolis, IN 46208
$-112
Cash flow
-3.4%
Cash-on-Cash Return
5.4%
Cap rate
0.6%
Rent to Value Ratio

Active
$199,900
3
bds
|
1
ba
|
968
sqft
|
built
1930
4018 Boulevard Pl, Indianapolis, IN 46208
$80
Cash flow
2.1%
Cash-on-Cash Return
6.6%
Cap rate
0.8%
Rent to Value Ratio
Active
$119,800
2
bds
|
1
ba
|
828
sqft
|
built
1920
2627 Shriver Ave, Indianapolis, IN 46208
$145
Cash flow
6.3%
Cash-on-Cash Return
7.6%
Cap rate
0.9%
Rent to Value Ratio

Active
$550,000
6
bds
|
2
ba
|
1,392
sqft
|
built
1924
398 W 47th St, Indianapolis, IN 46208
$-333
Cash flow
-3.2%
Cash-on-Cash Return
5.4%
Cap rate
0.7%
Rent to Value Ratio

Active
$170,000
3
bds
|
2
ba
|
1,984
sqft
|
built
1930
1467 W 33rd St, Indianapolis, IN 46208
$95
Cash flow
2.9%
Cash-on-Cash Return
6.8%
Cap rate
0.8%
Rent to Value Ratio
Active
$189,000
3
bds
|
2
ba
|
1,494
sqft
|
built
1895
1346 W 27th St, Indianapolis, IN 46208
$-2
Cash flow
-0.1%
Cash-on-Cash Return
6.1%
Cap rate
0.7%
Rent to Value Ratio
Active
$284,900
3
bds
|
1
ba
|
1,980
sqft
|
built
1943
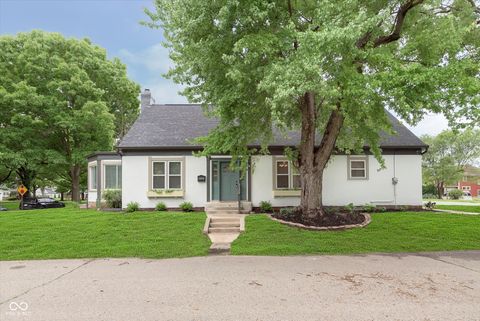
315 W 43rd St, Indianapolis, IN 46208
$-217
Cash flow
-4.0%
Cash-on-Cash Return
5.2%
Cap rate
0.6%
Rent to Value Ratio
Active
$364,000
3
bds
|
2
ba
|
1,730
sqft
|
built
1920
1502 Burdsal Pkwy, Indianapolis, IN 46208
$-1,037
Cash flow
-14.9%
Cash-on-Cash Return
2.7%
Cap rate
0.3%
Rent to Value Ratio