46214 Investment Properties for Sale
Browse homes for sale and investment properties in 46214. Refine your search by price, property type, or more.
Best cash flowing properties in 46214
Active
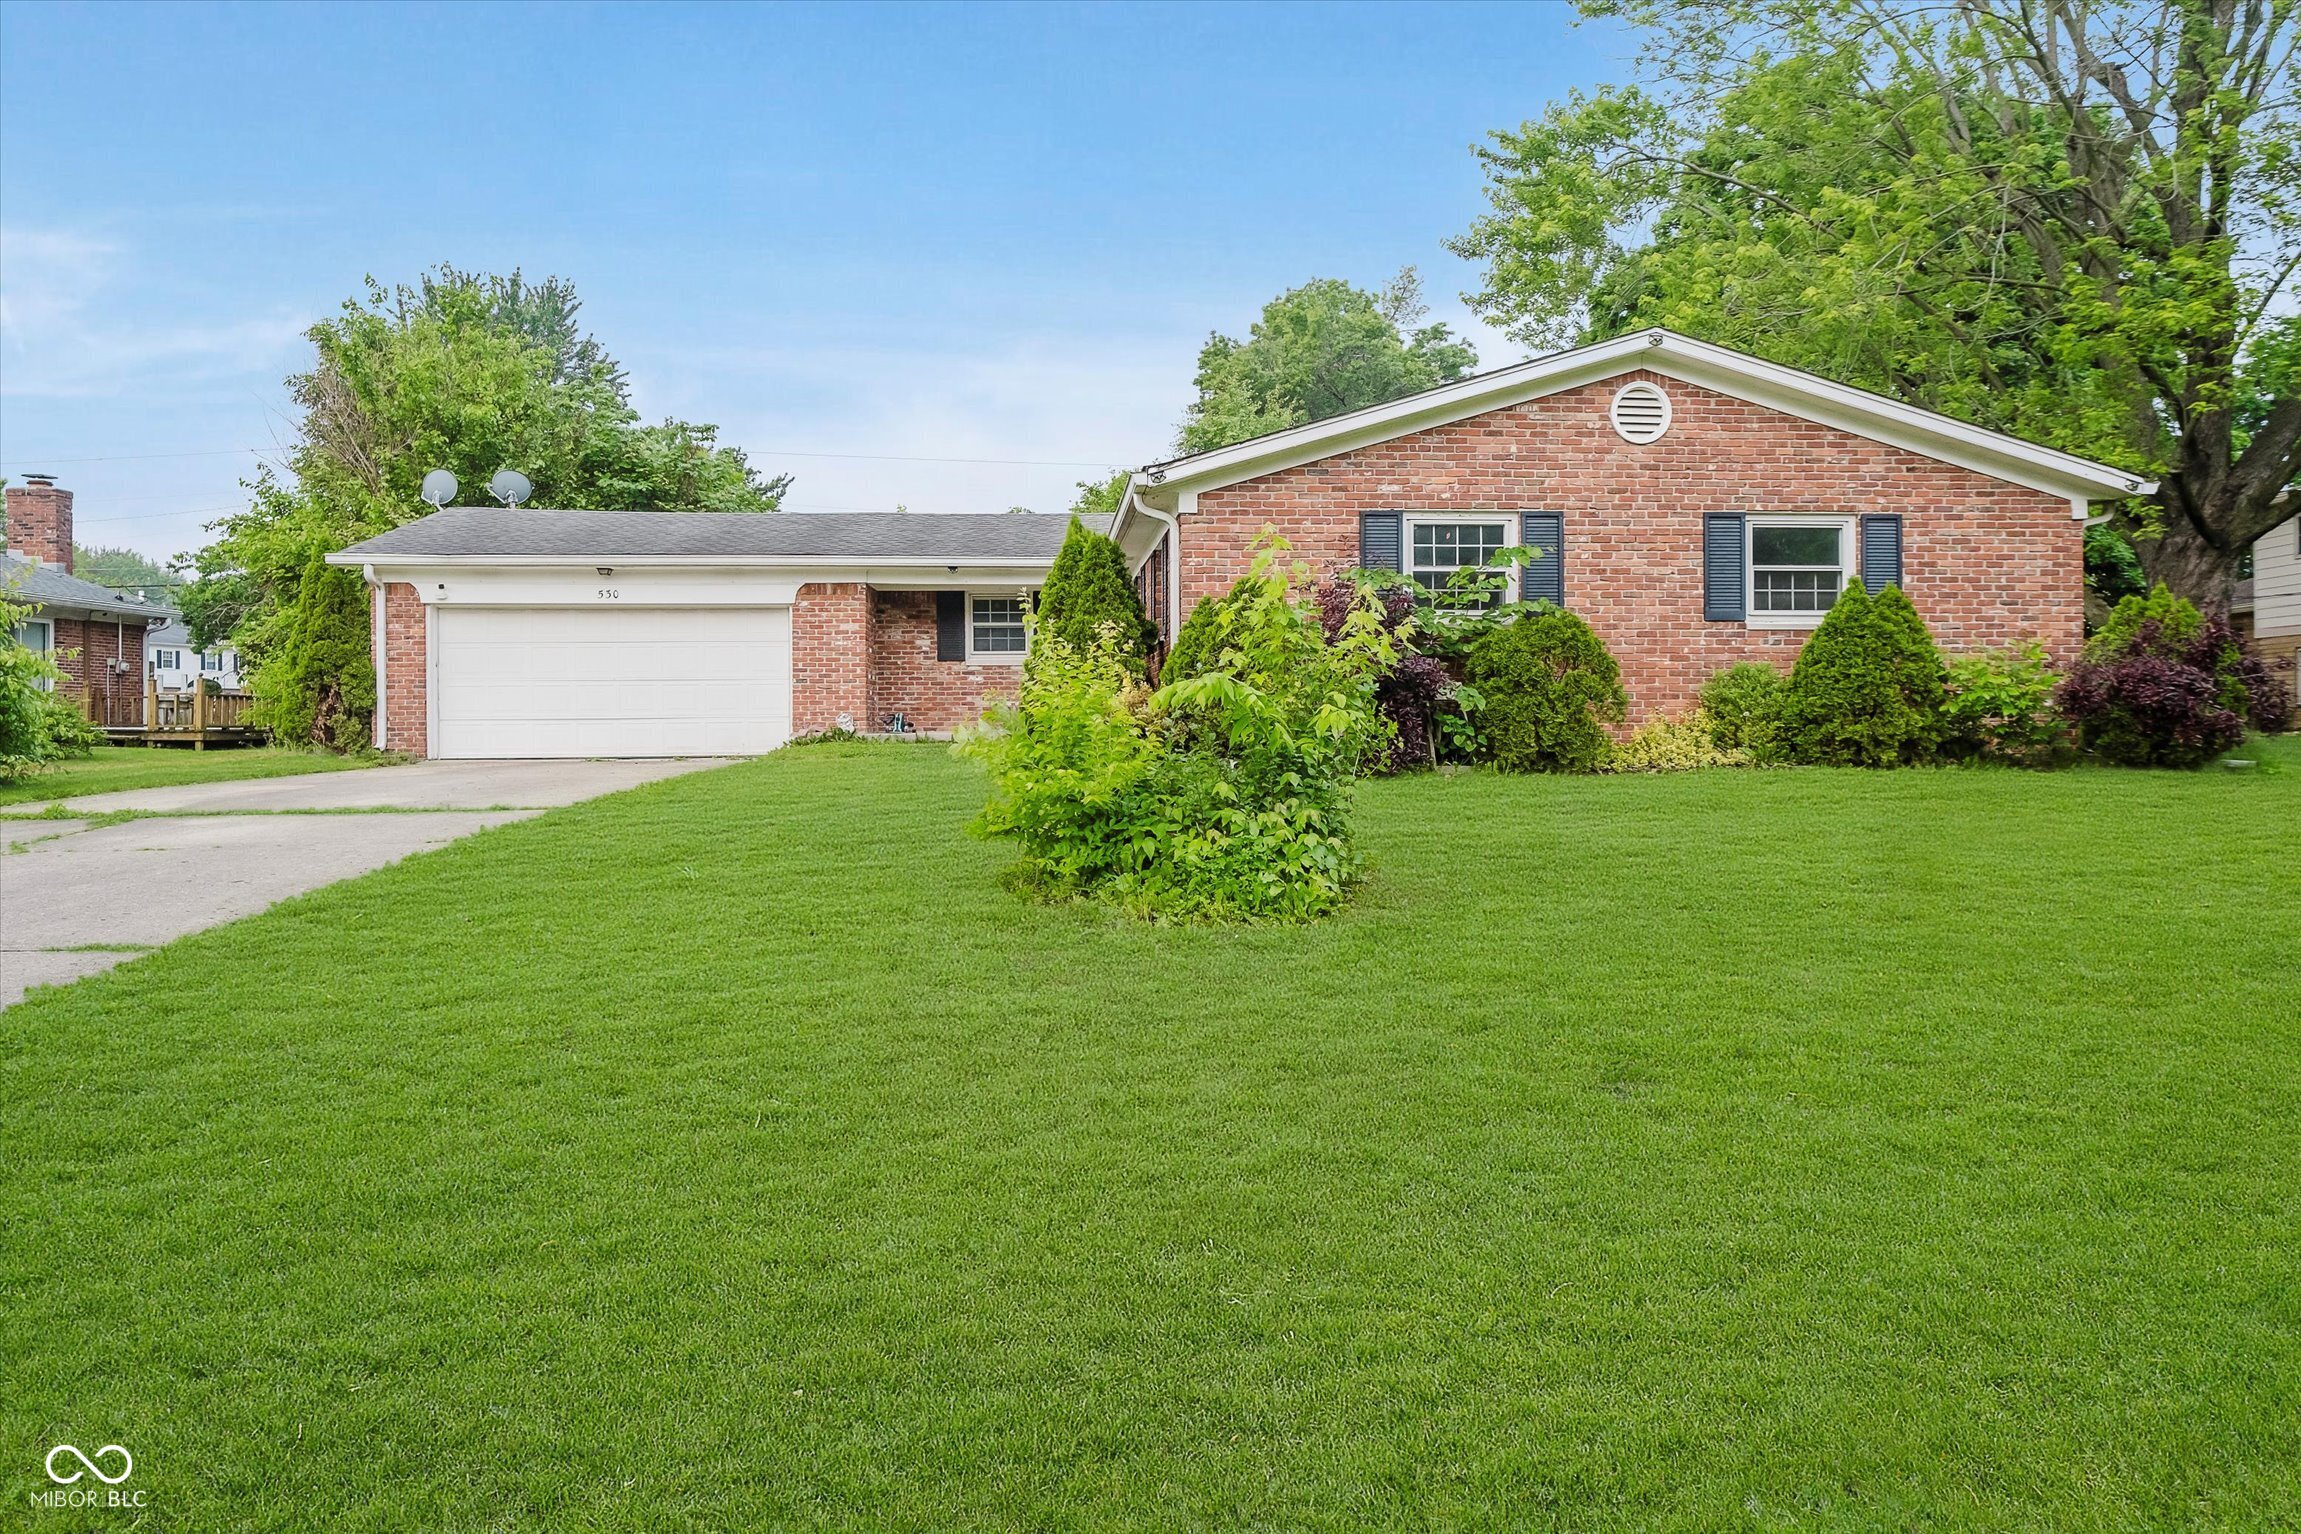
$225,000
3
bds
|
2
ba
|
1,710
sqft
|
built
1968
530 Westmore Dr, Indianapolis, IN 46214
$202
Cash flow
4.7%
Cash-on-Cash Return
7.4%
Cap rate
0.9%
Rent to Value Ratio
Active
$234,000
3
bds
|
3
ba
|
1,740
sqft
|
built
1977
3202 Acacia Dr, Indianapolis, IN 46214
$155
Cash flow
3.5%
Cash-on-Cash Return
7.1%
Cap rate
0.9%
Rent to Value Ratio
27 out of 28 properties for sale in 46214
Limited Results Shown
Create a free account, or log in to reveal all property listings and enjoy the complete experience.
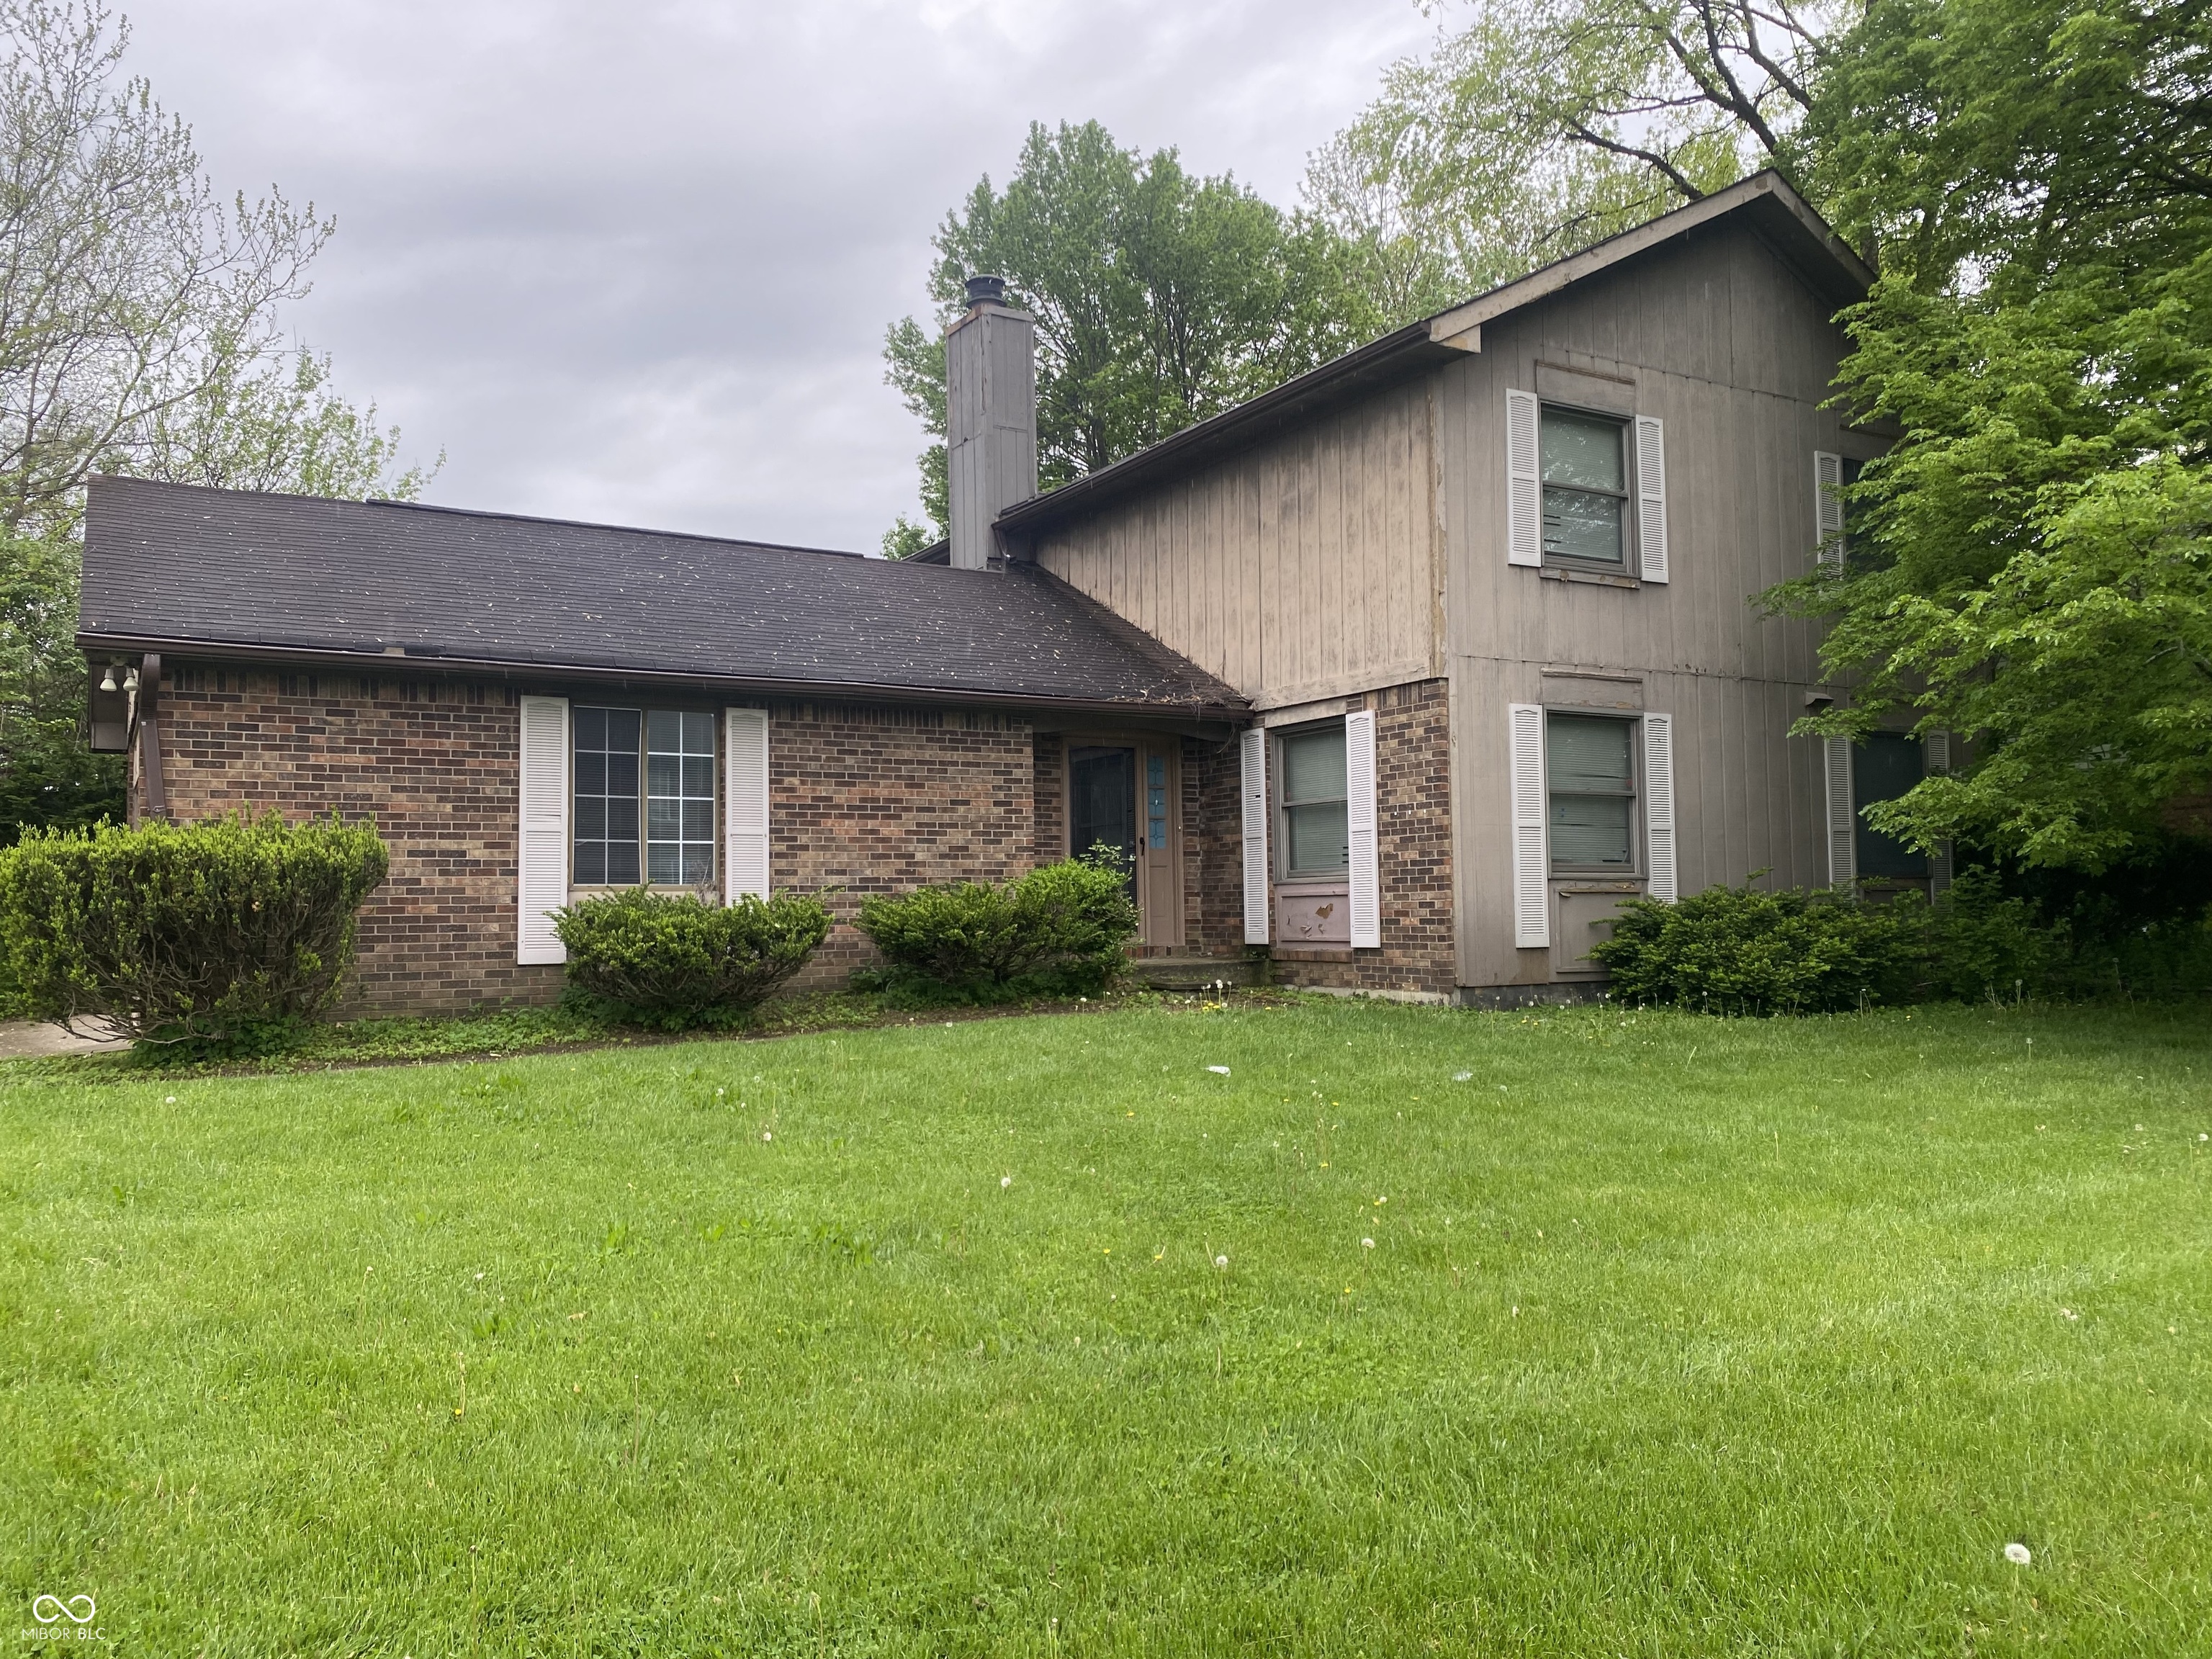
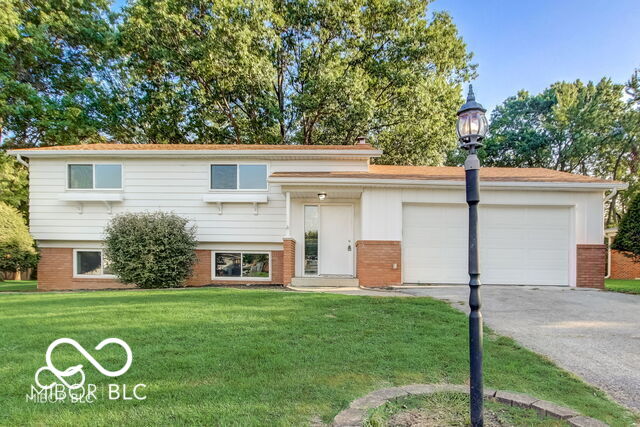
Active
$209,900
3
bds
|
2
ba
|
1,864
sqft
|
built
1981
2925 Horse Hill East Dr, Indianapolis, IN 46214
$-298
Cash flow
-7.4%
Cash-on-Cash Return
4.6%
Cap rate
0.8%
Rent to Value Ratio
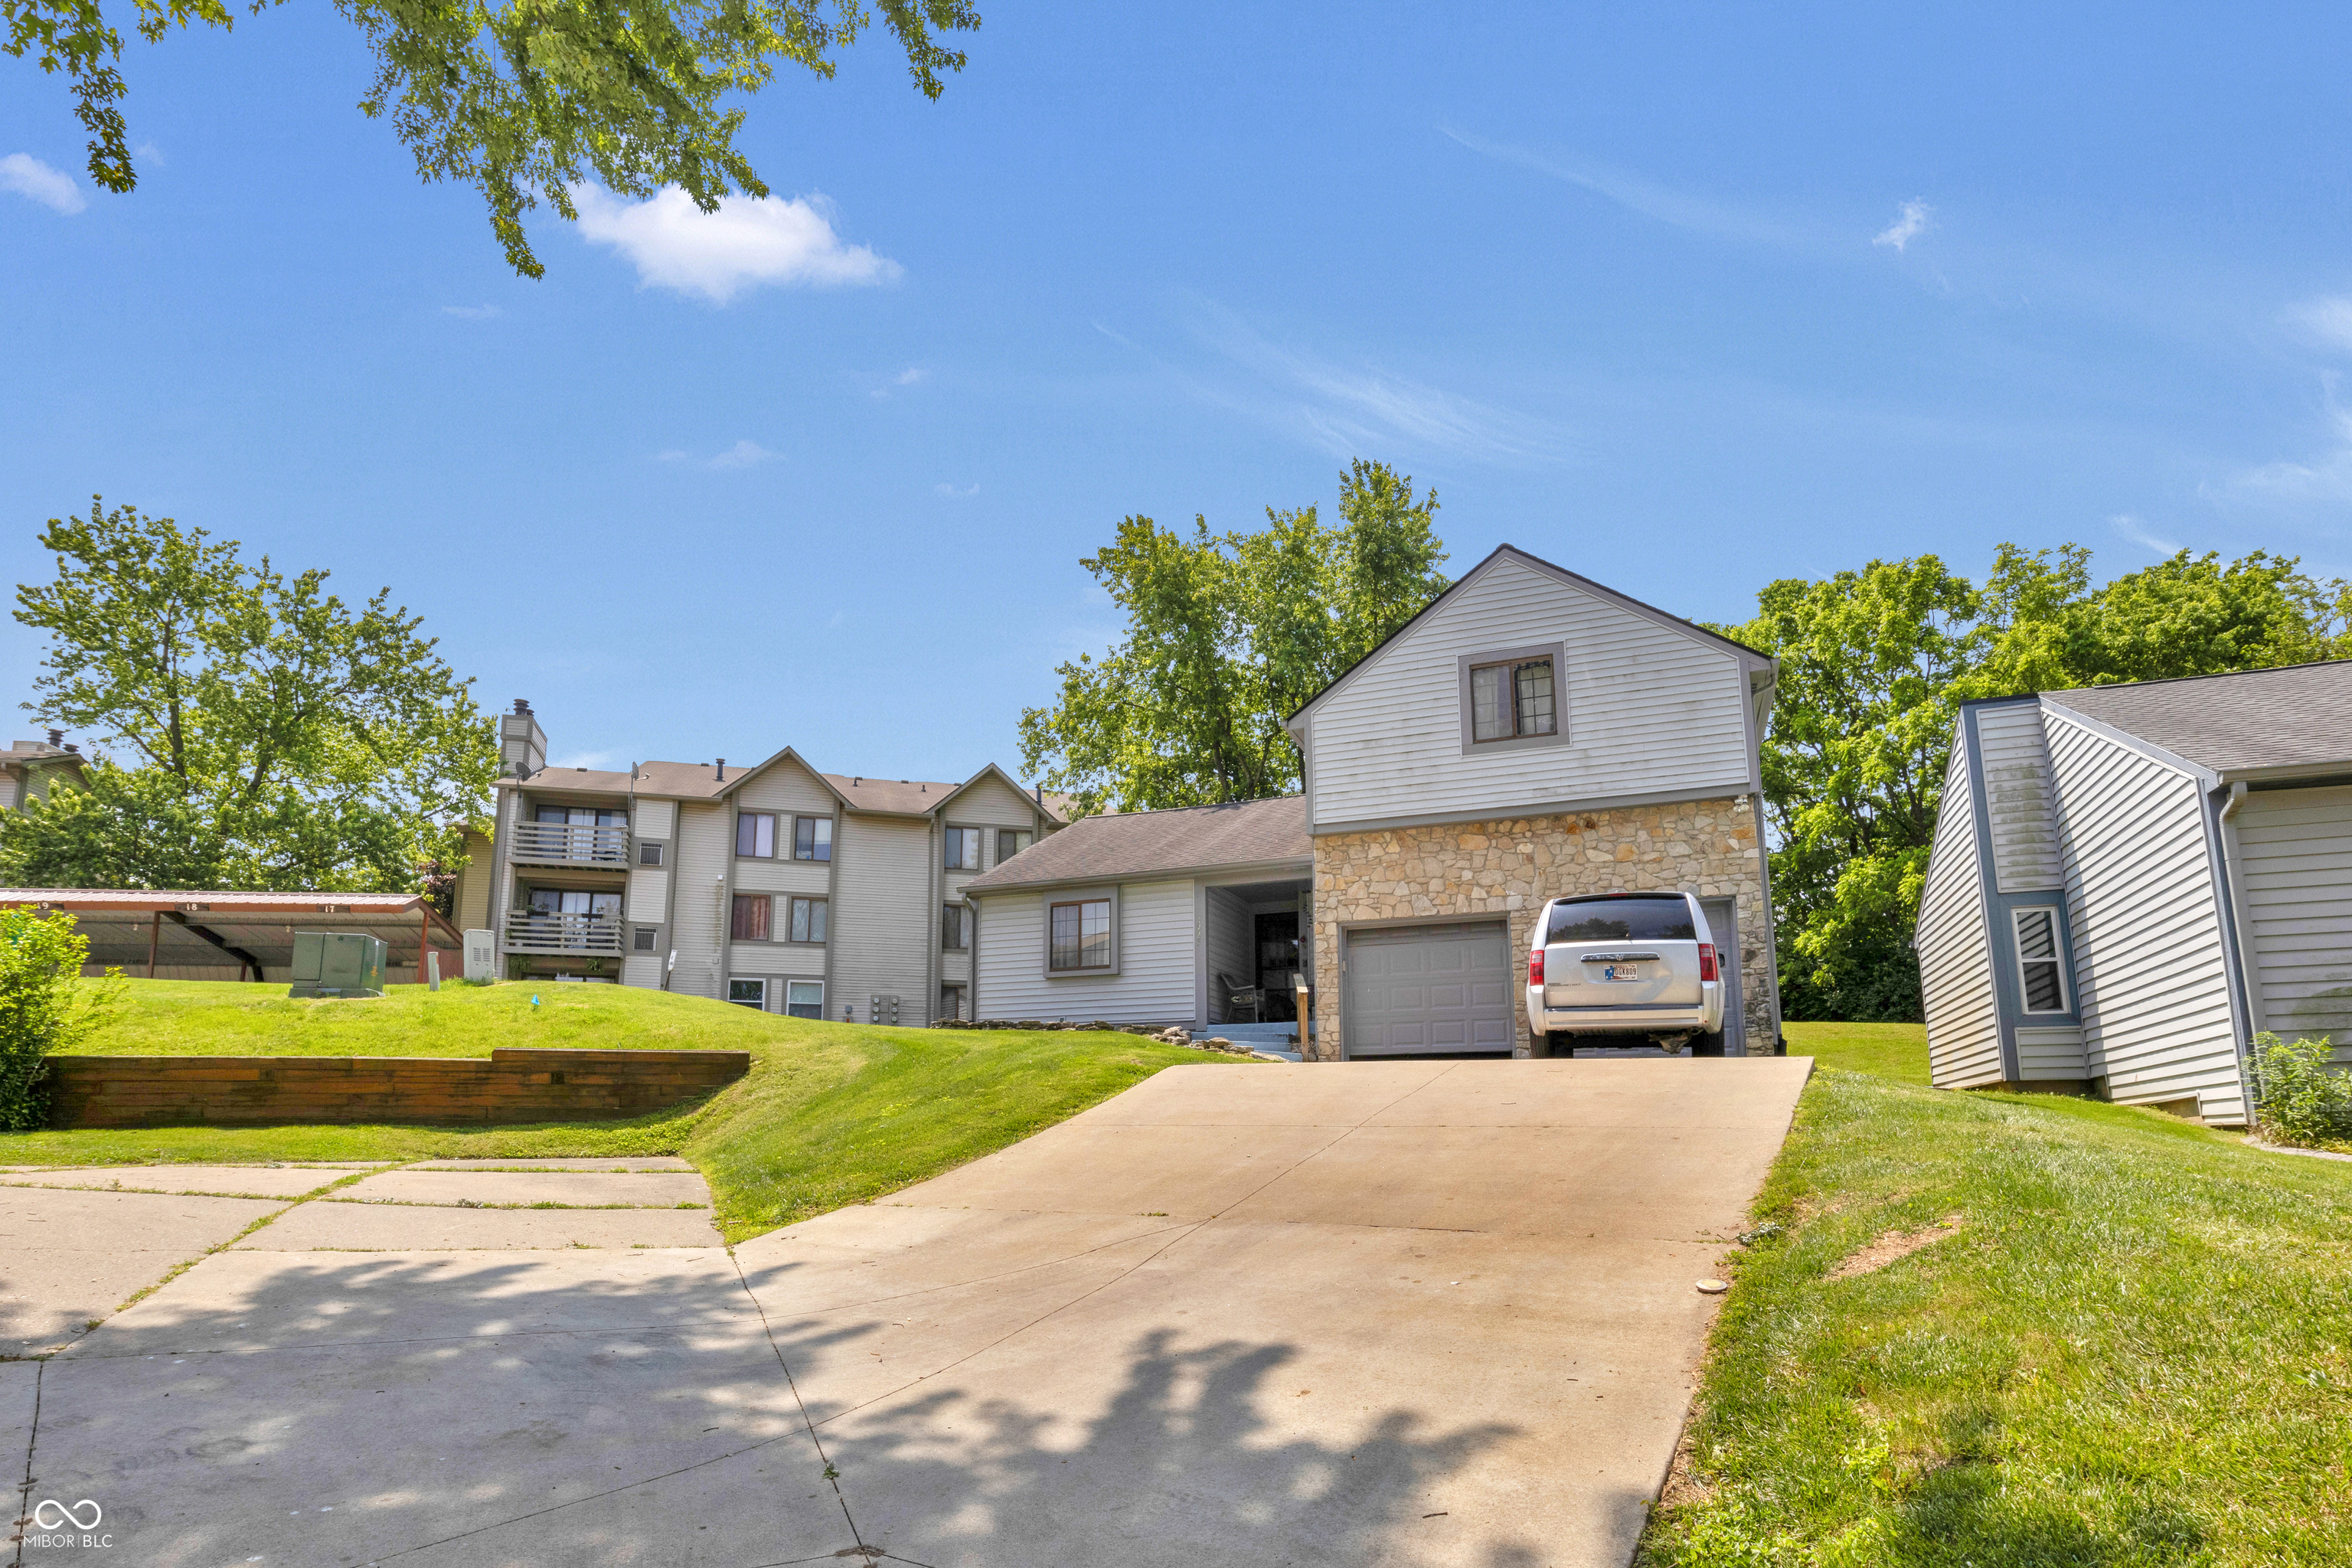
Pending
$178,000
2
bds
|
2
ba
|
965
sqft
|
built
1981
7837 Hunters Path, Indianapolis, IN 46214
$-156
Cash flow
-4.6%
Cash-on-Cash Return
5.2%
Cap rate
0.8%
Rent to Value Ratio
Active
$230,000
3
bds
|
2
ba
|
1,355
sqft
|
built
2000
540 Cahill Ln, Indianapolis, IN 46214
$1
Cash flow
0.0%
Cash-on-Cash Return
6.3%
Cap rate
0.8%
Rent to Value Ratio
Active
$210,000
2
bds
|
2
ba
|
1,214
sqft
|
built
1981
7950 Eagle Valley Pass, Indianapolis, IN 46214
$-335
Cash flow
-8.3%
Cash-on-Cash Return
4.4%
Cap rate
0.7%
Rent to Value Ratio
Active
$279,900
3
bds
|
2
ba
|
1,815
sqft
|
built
1962
7206 Halden Pl, Indianapolis, IN 46214
$121
Cash flow
2.3%
Cash-on-Cash Return
6.8%
Cap rate
0.8%
Rent to Value Ratio
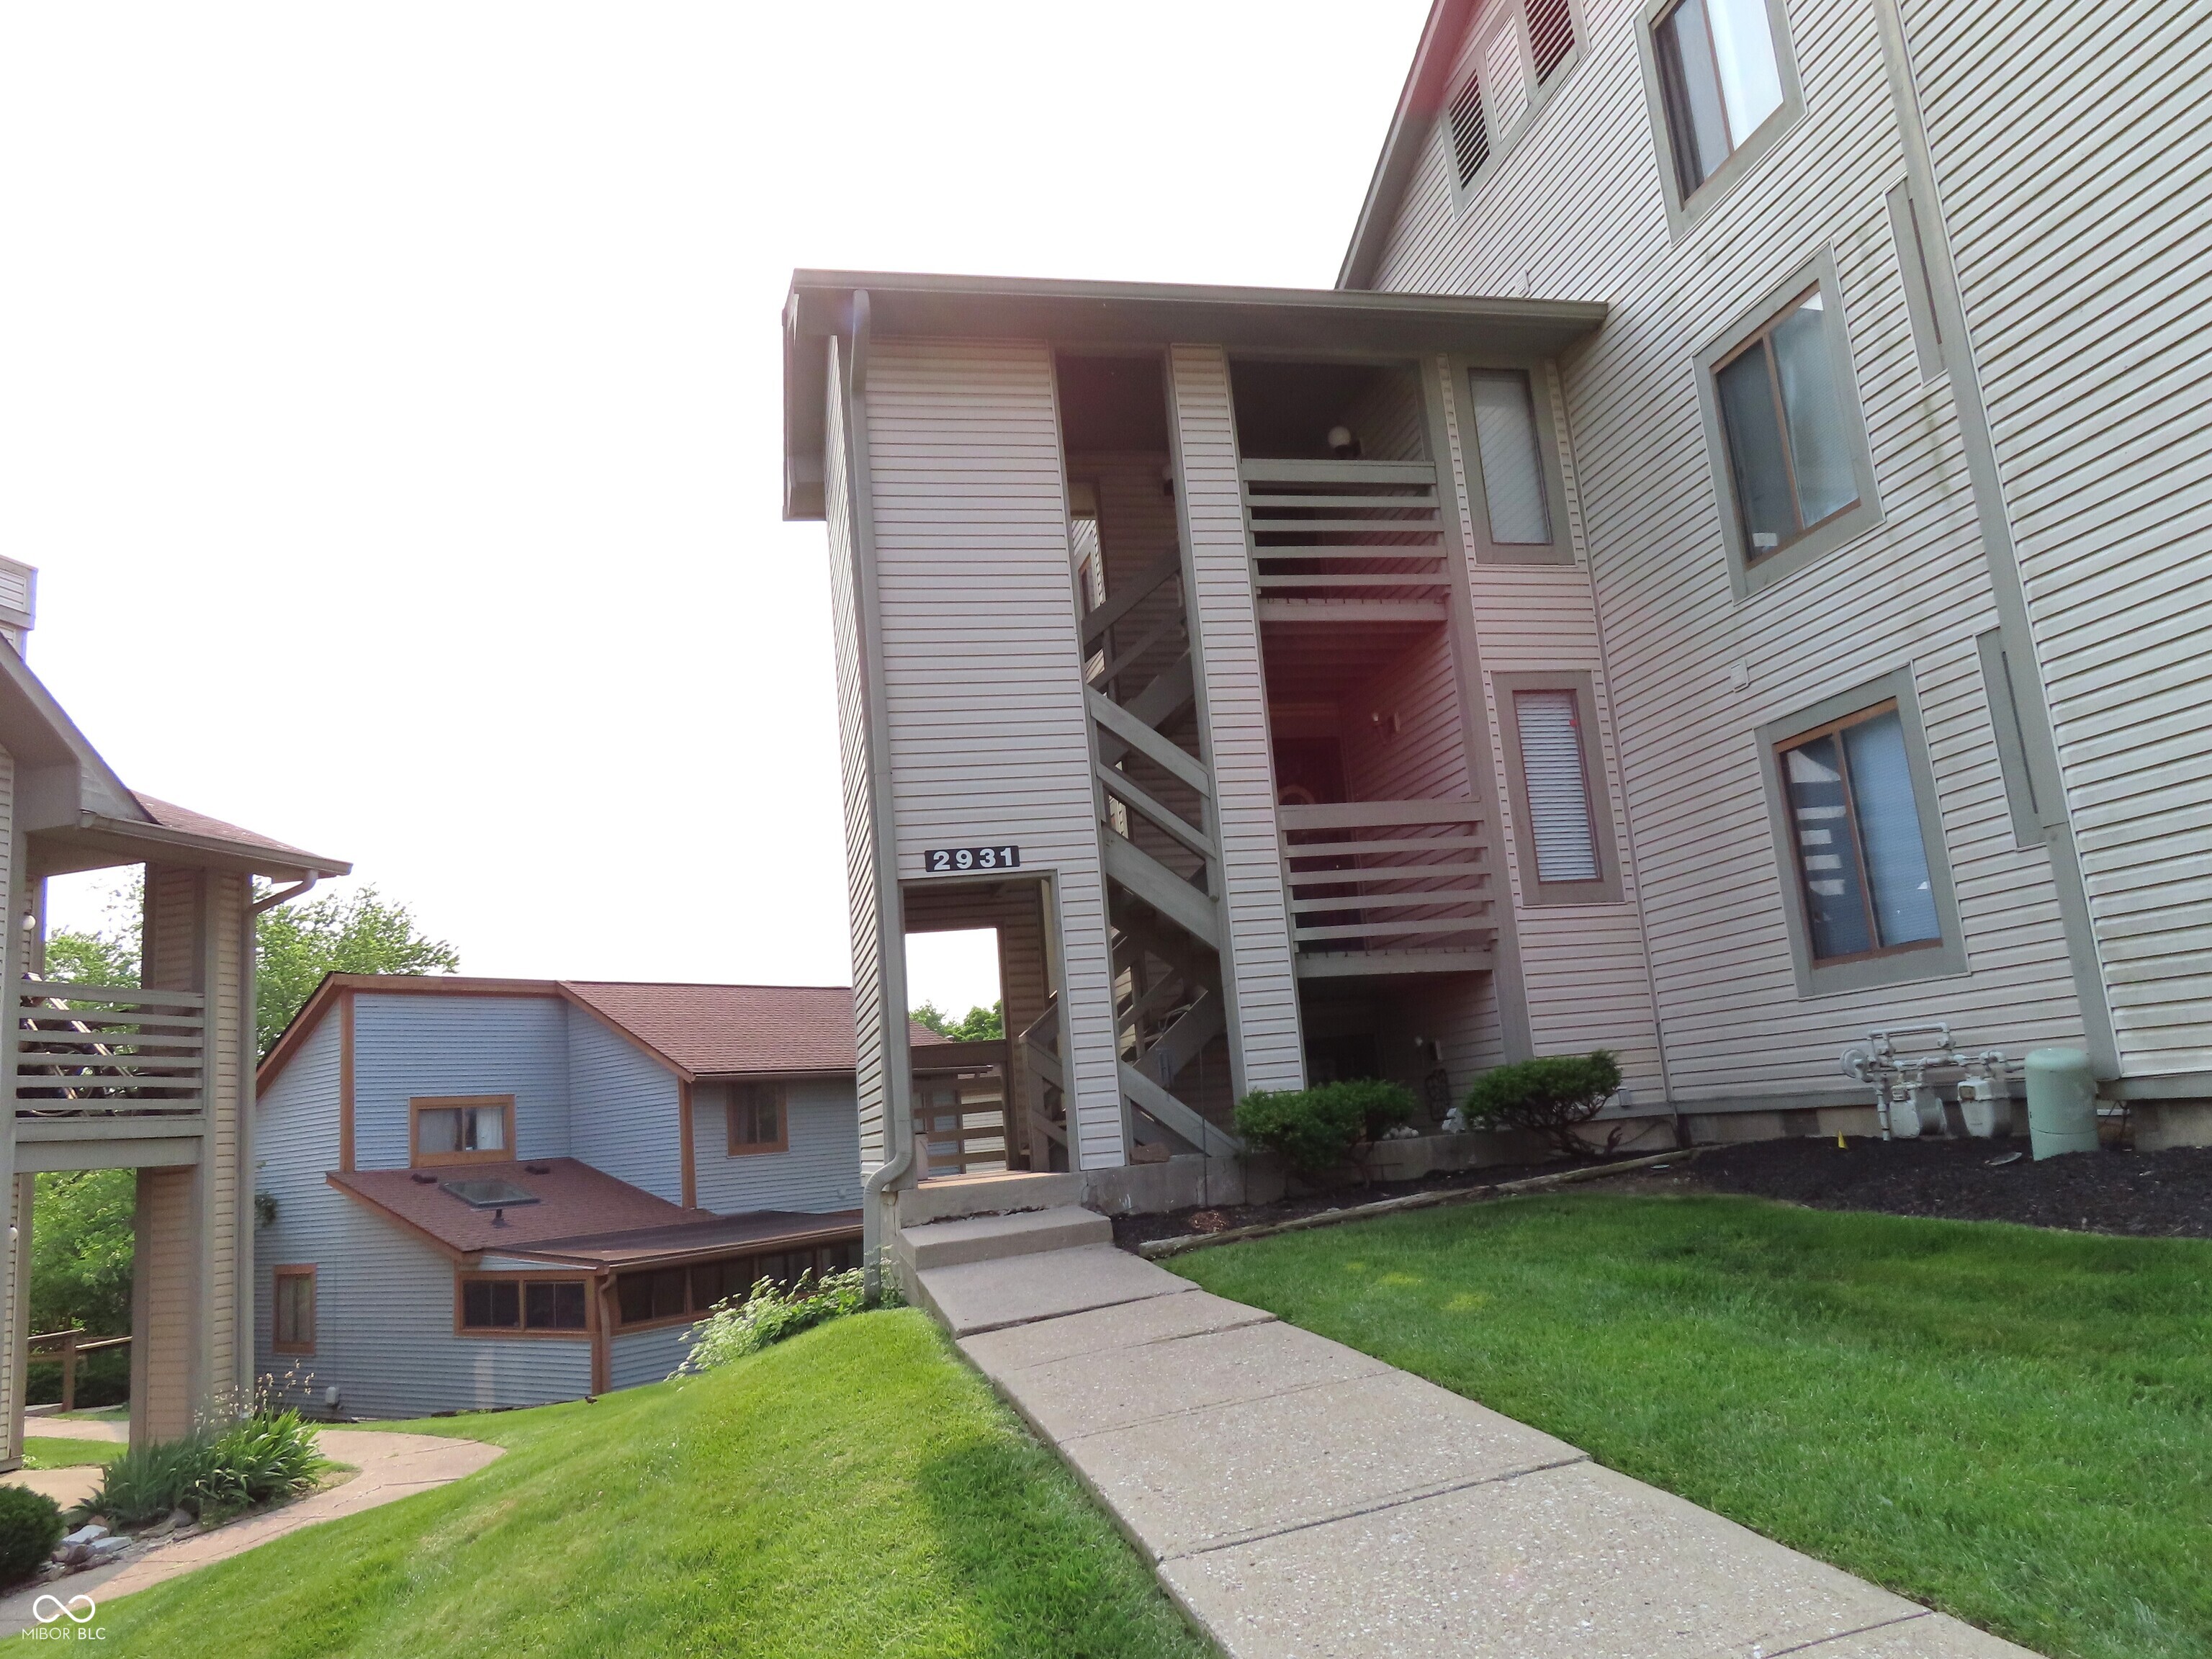
Active
$125,000
2
bds
|
1
ba
|
984
sqft
|
built
1983
2931 Eagles Crest Cir, Indianapolis, IN 46214
$86
Cash flow
3.6%
Cash-on-Cash Return
7.1%
Cap rate
1.1%
Rent to Value Ratio
Active
$294,900
3
bds
|
2
ba
|
2,097
sqft
|
built
1965
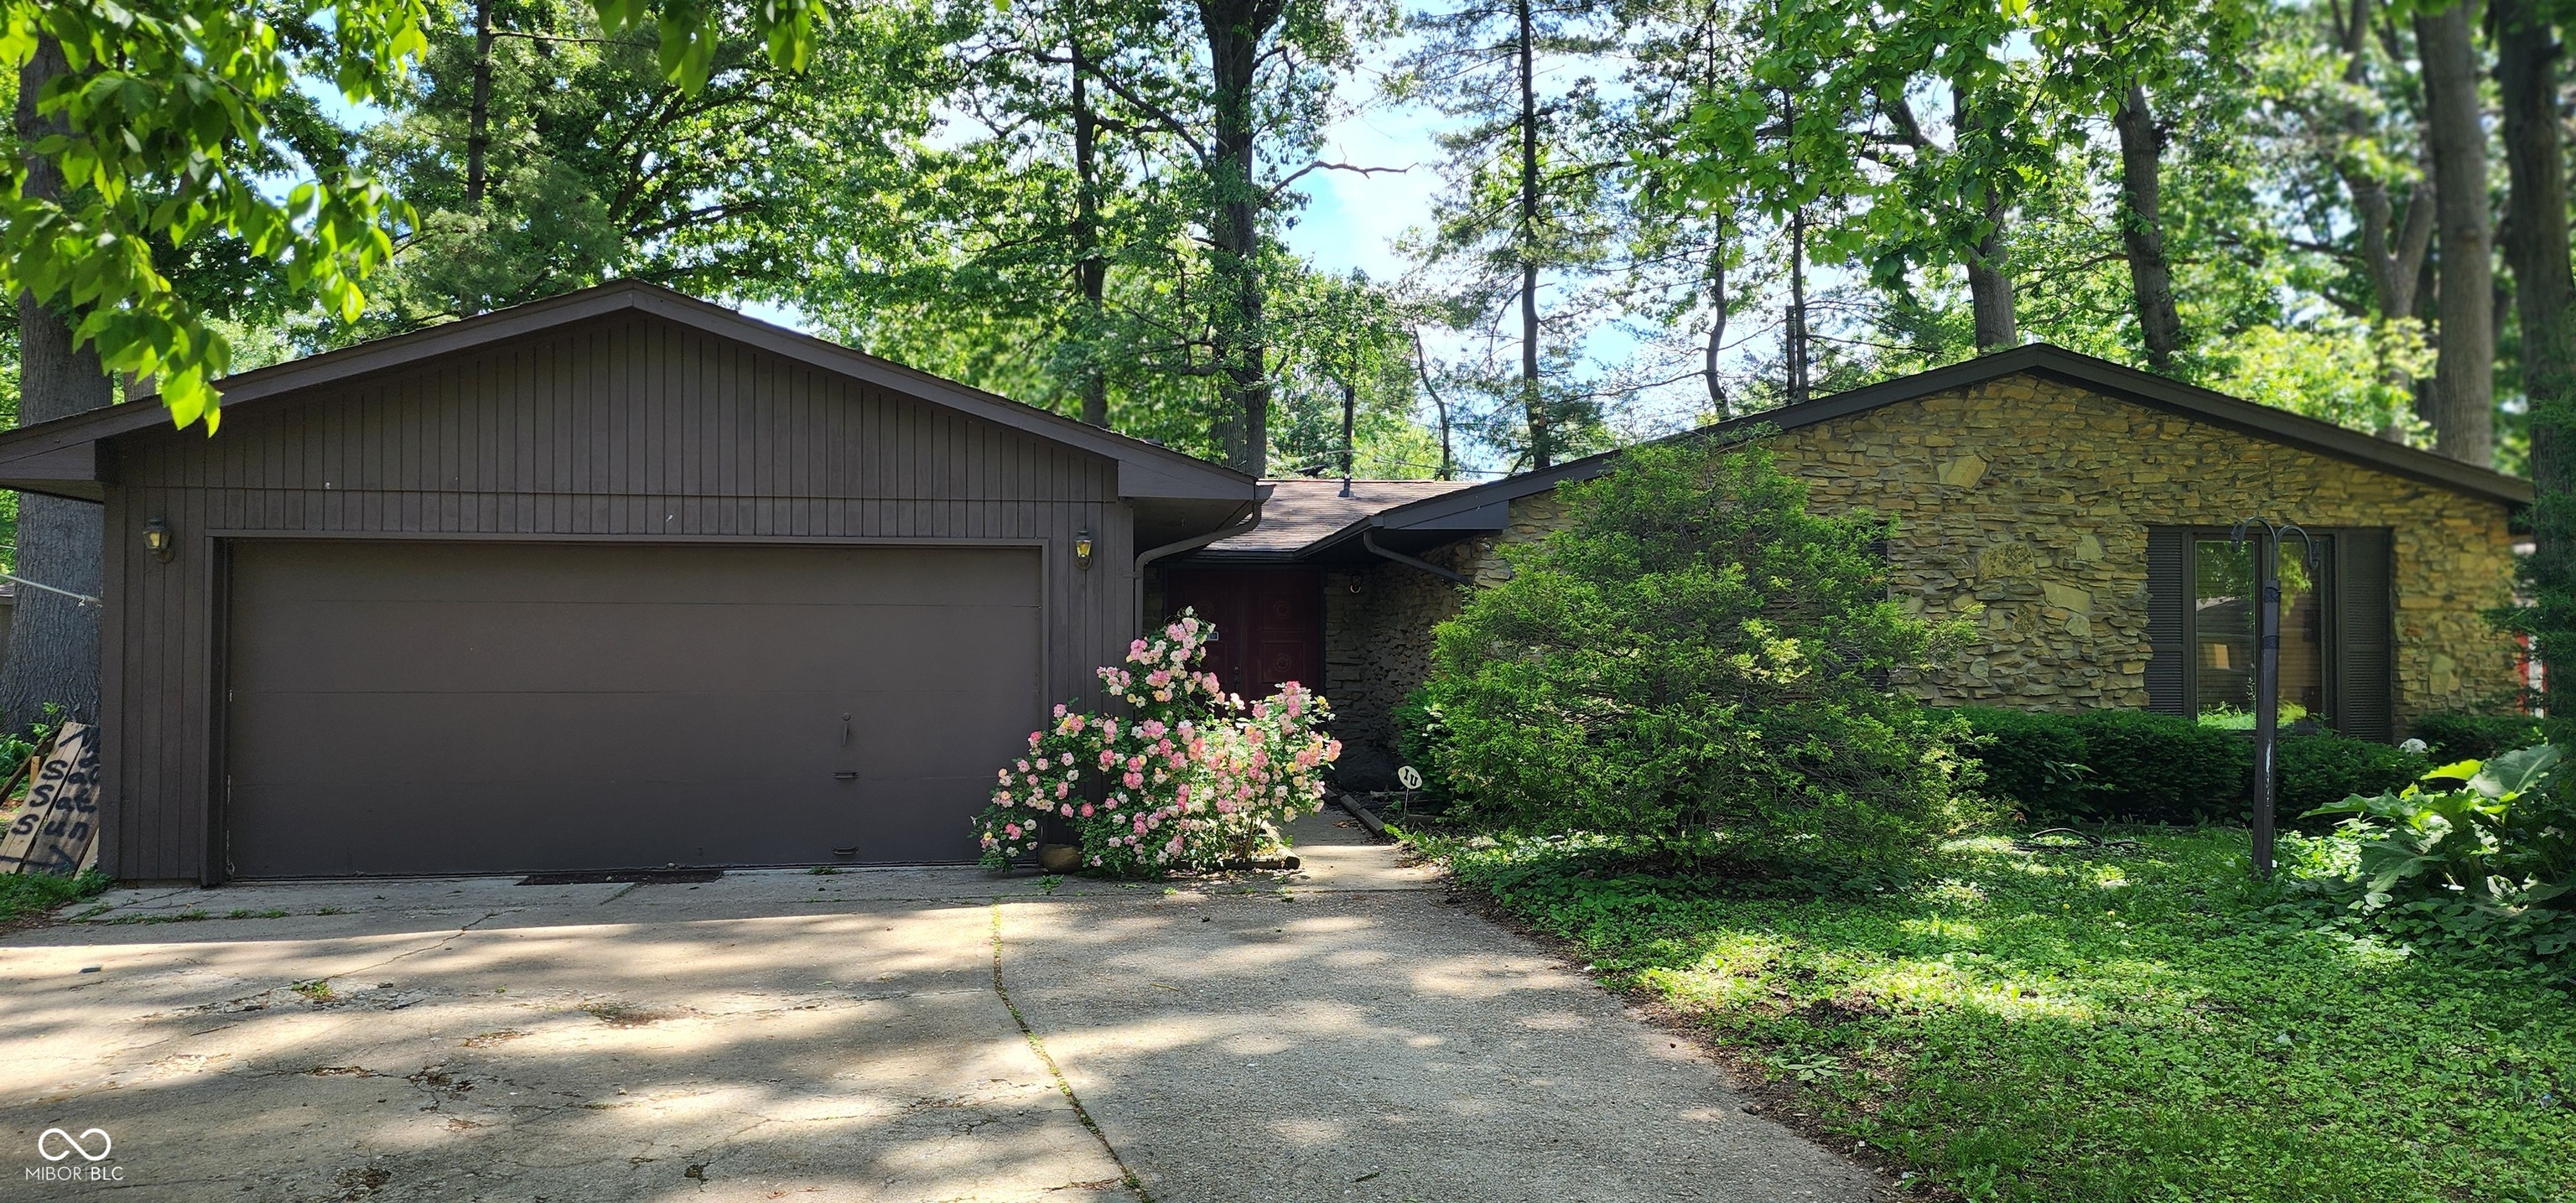
535 Radburn Dr, Indianapolis, IN 46214
$-164
Cash flow
-2.9%
Cash-on-Cash Return
5.6%
Cap rate
0.7%
Rent to Value Ratio
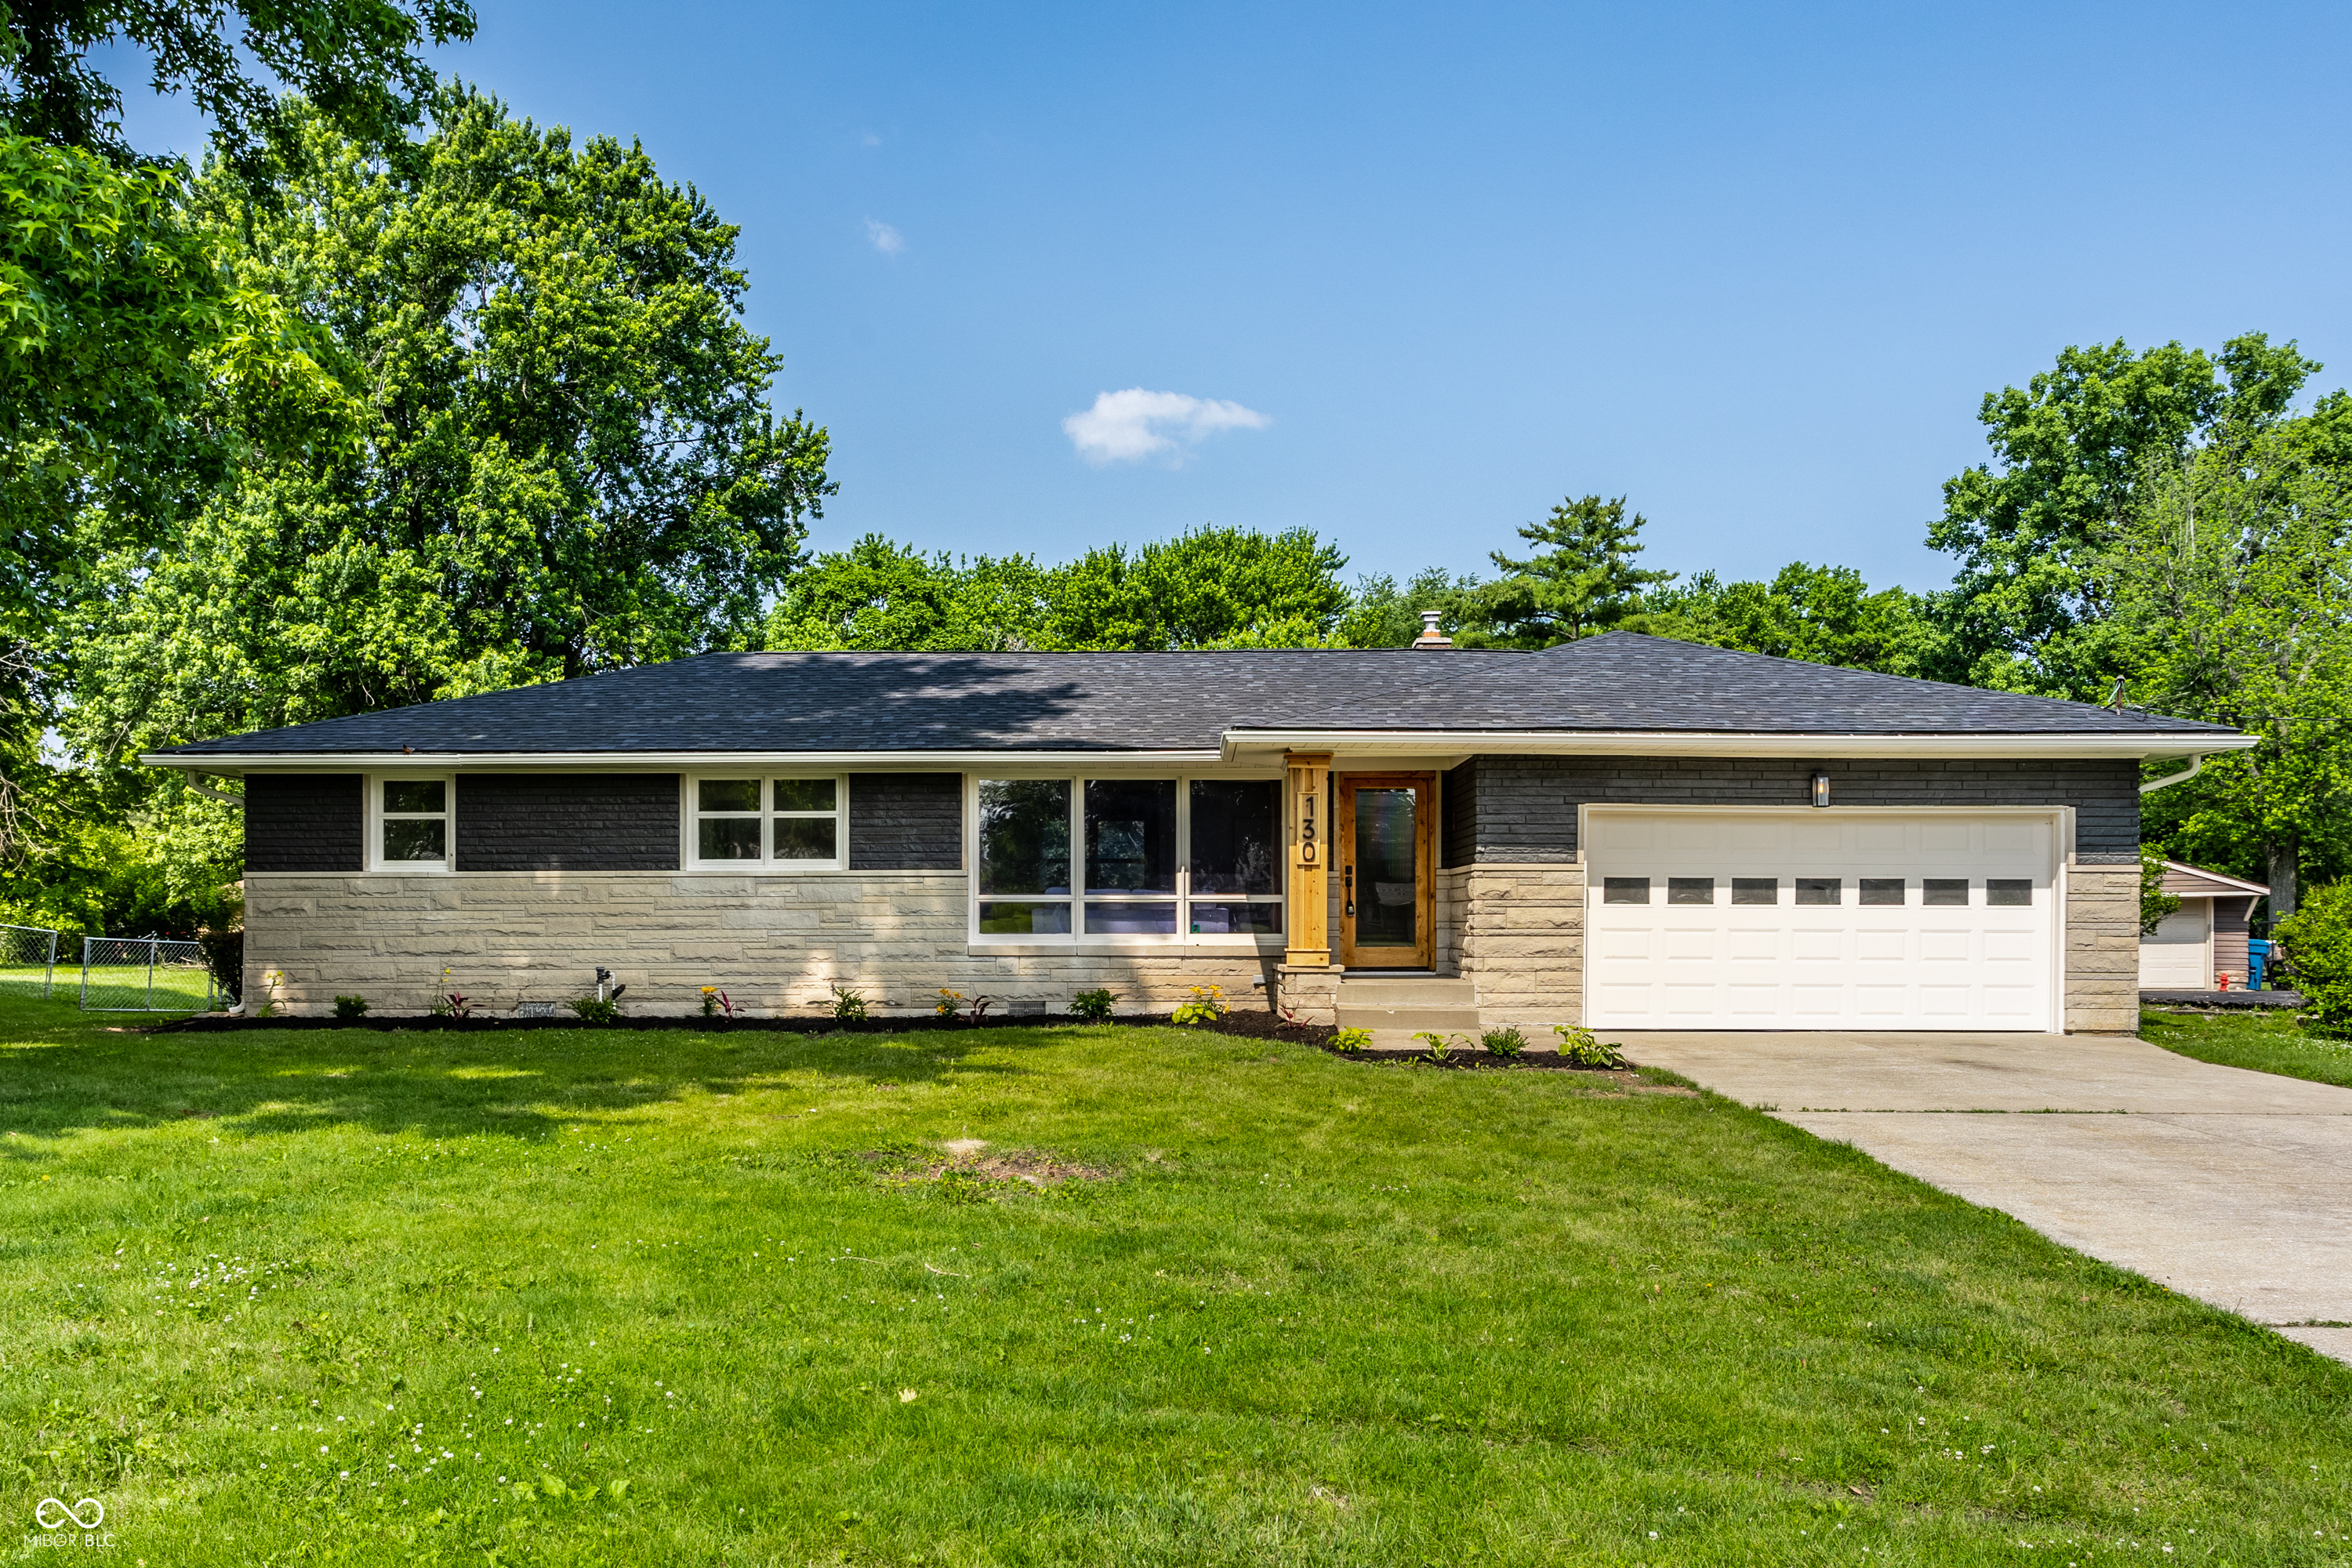
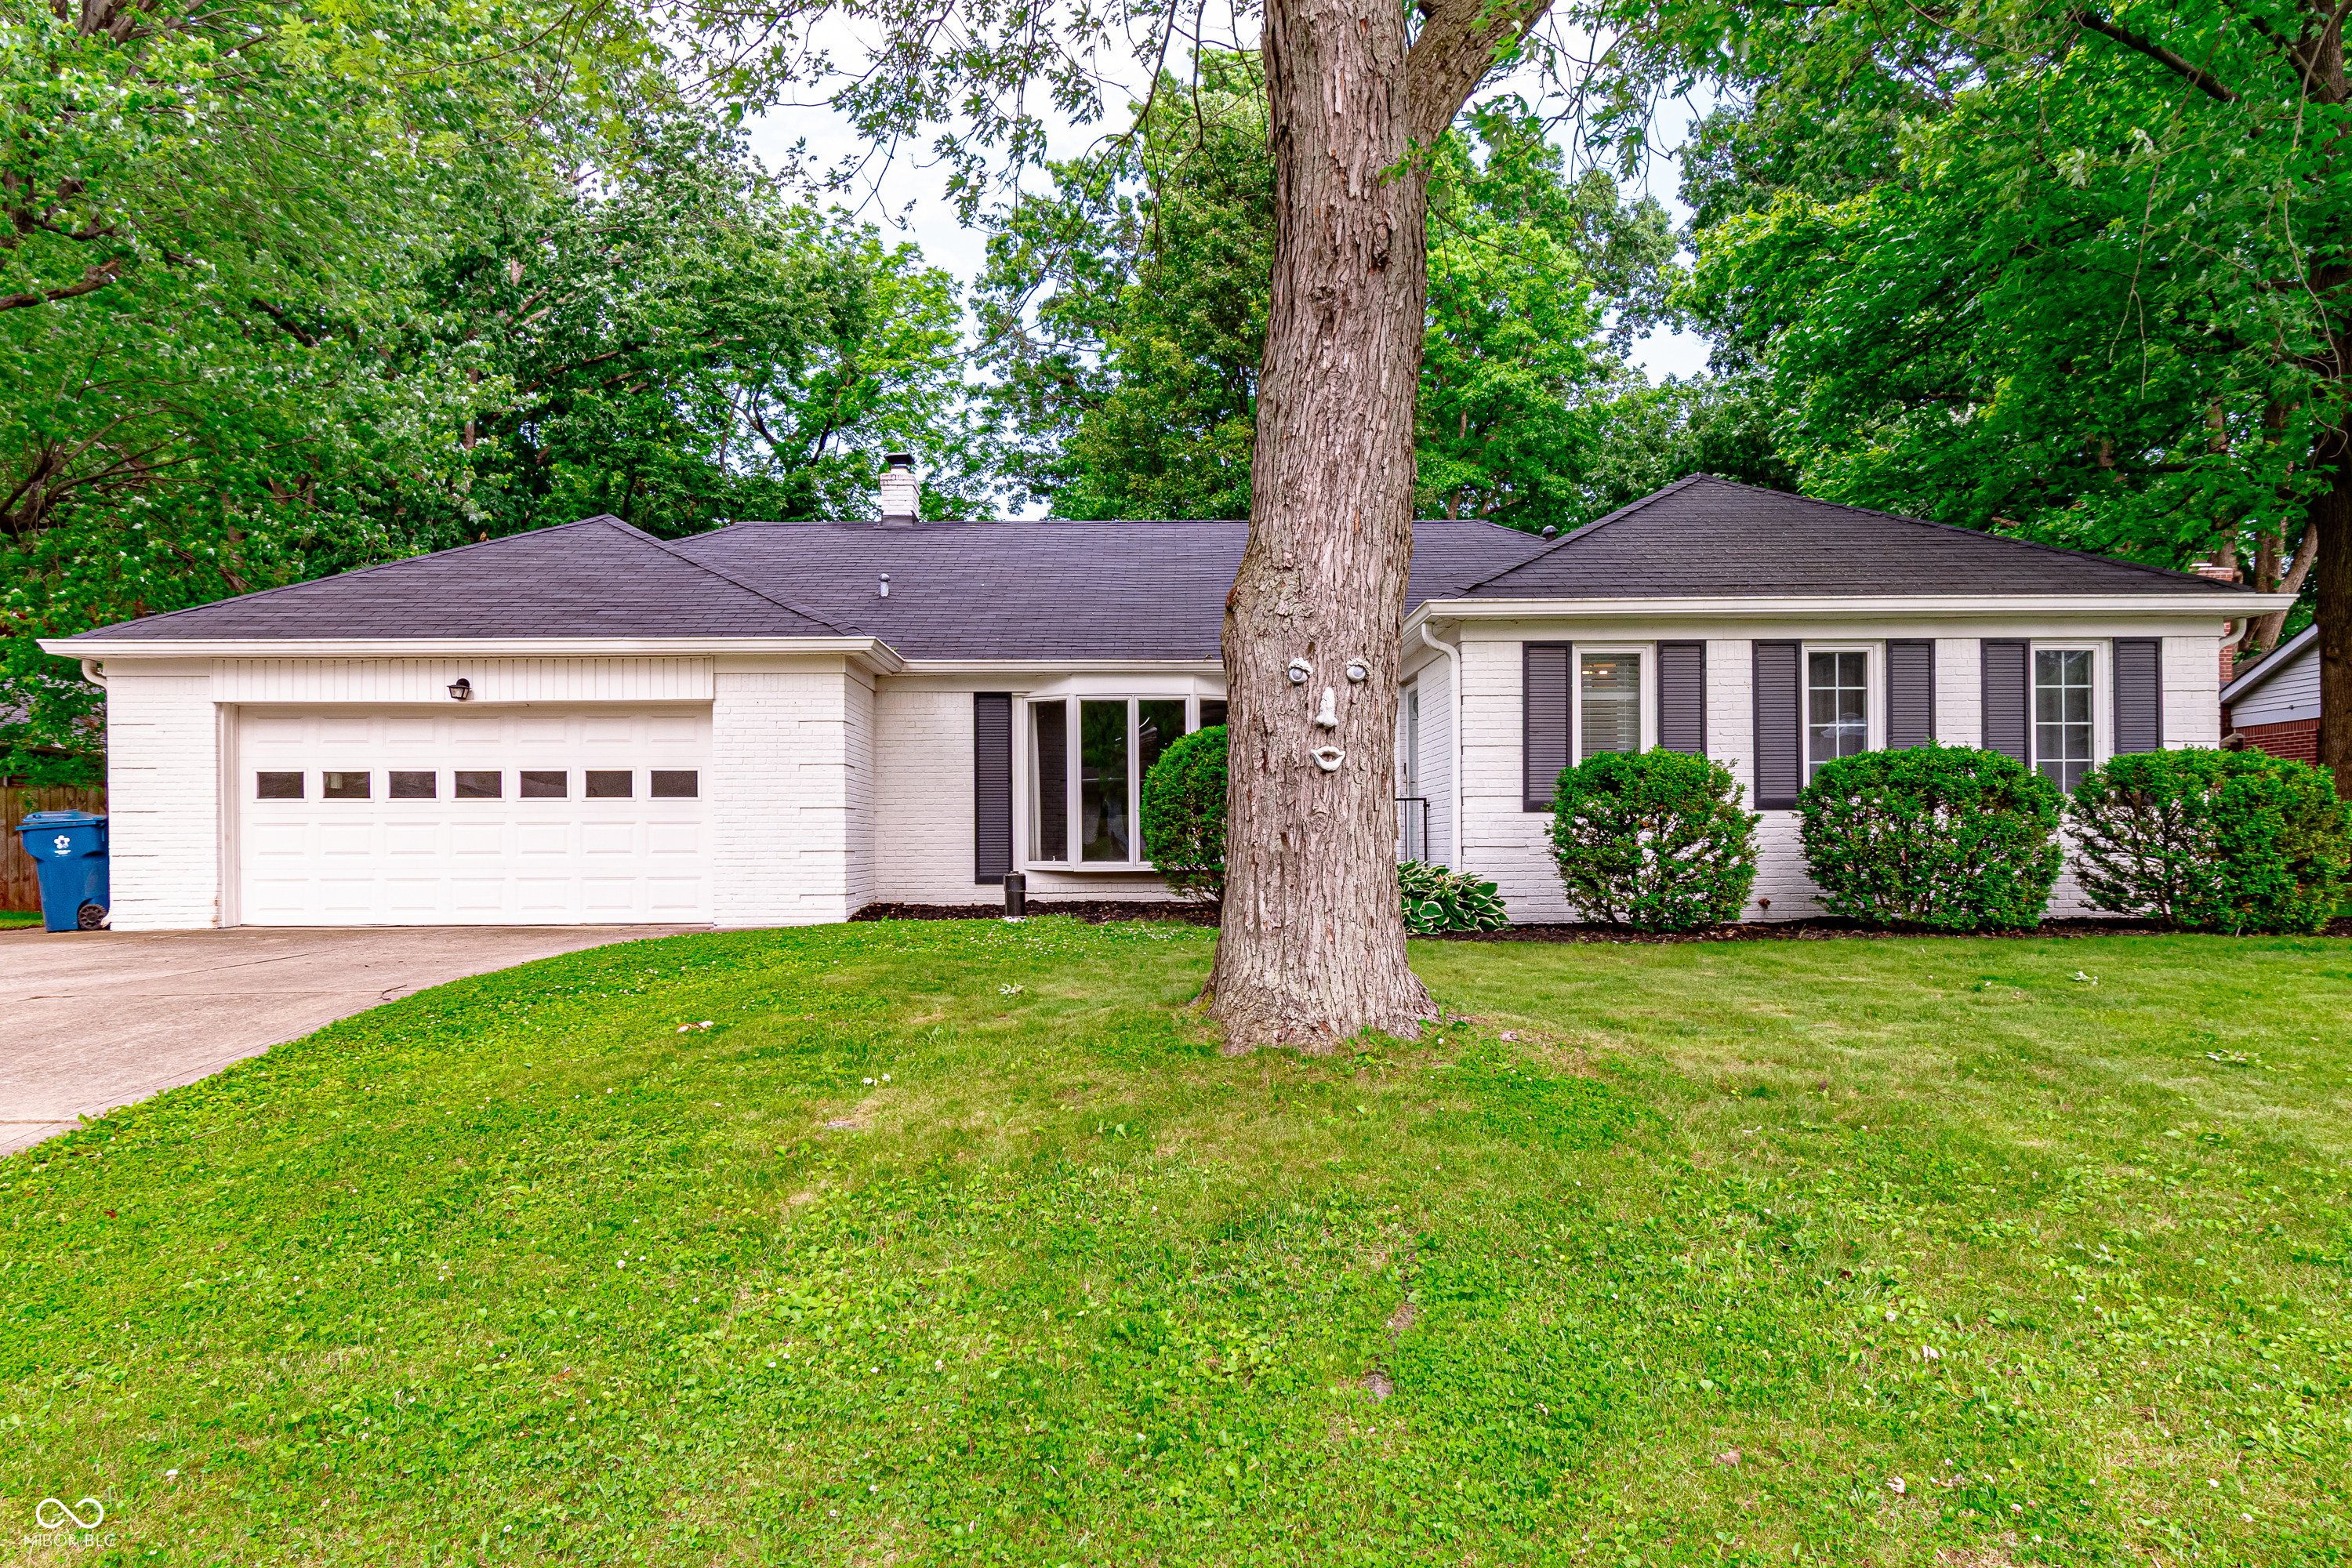
Active
$289,900
3
bds
|
2
ba
|
1,344
sqft
|
built
1959
130 N High School Rd, Indianapolis, IN 46214
$-276
Cash flow
-5.0%
Cash-on-Cash Return
5.1%
Cap rate
0.6%
Rent to Value Ratio
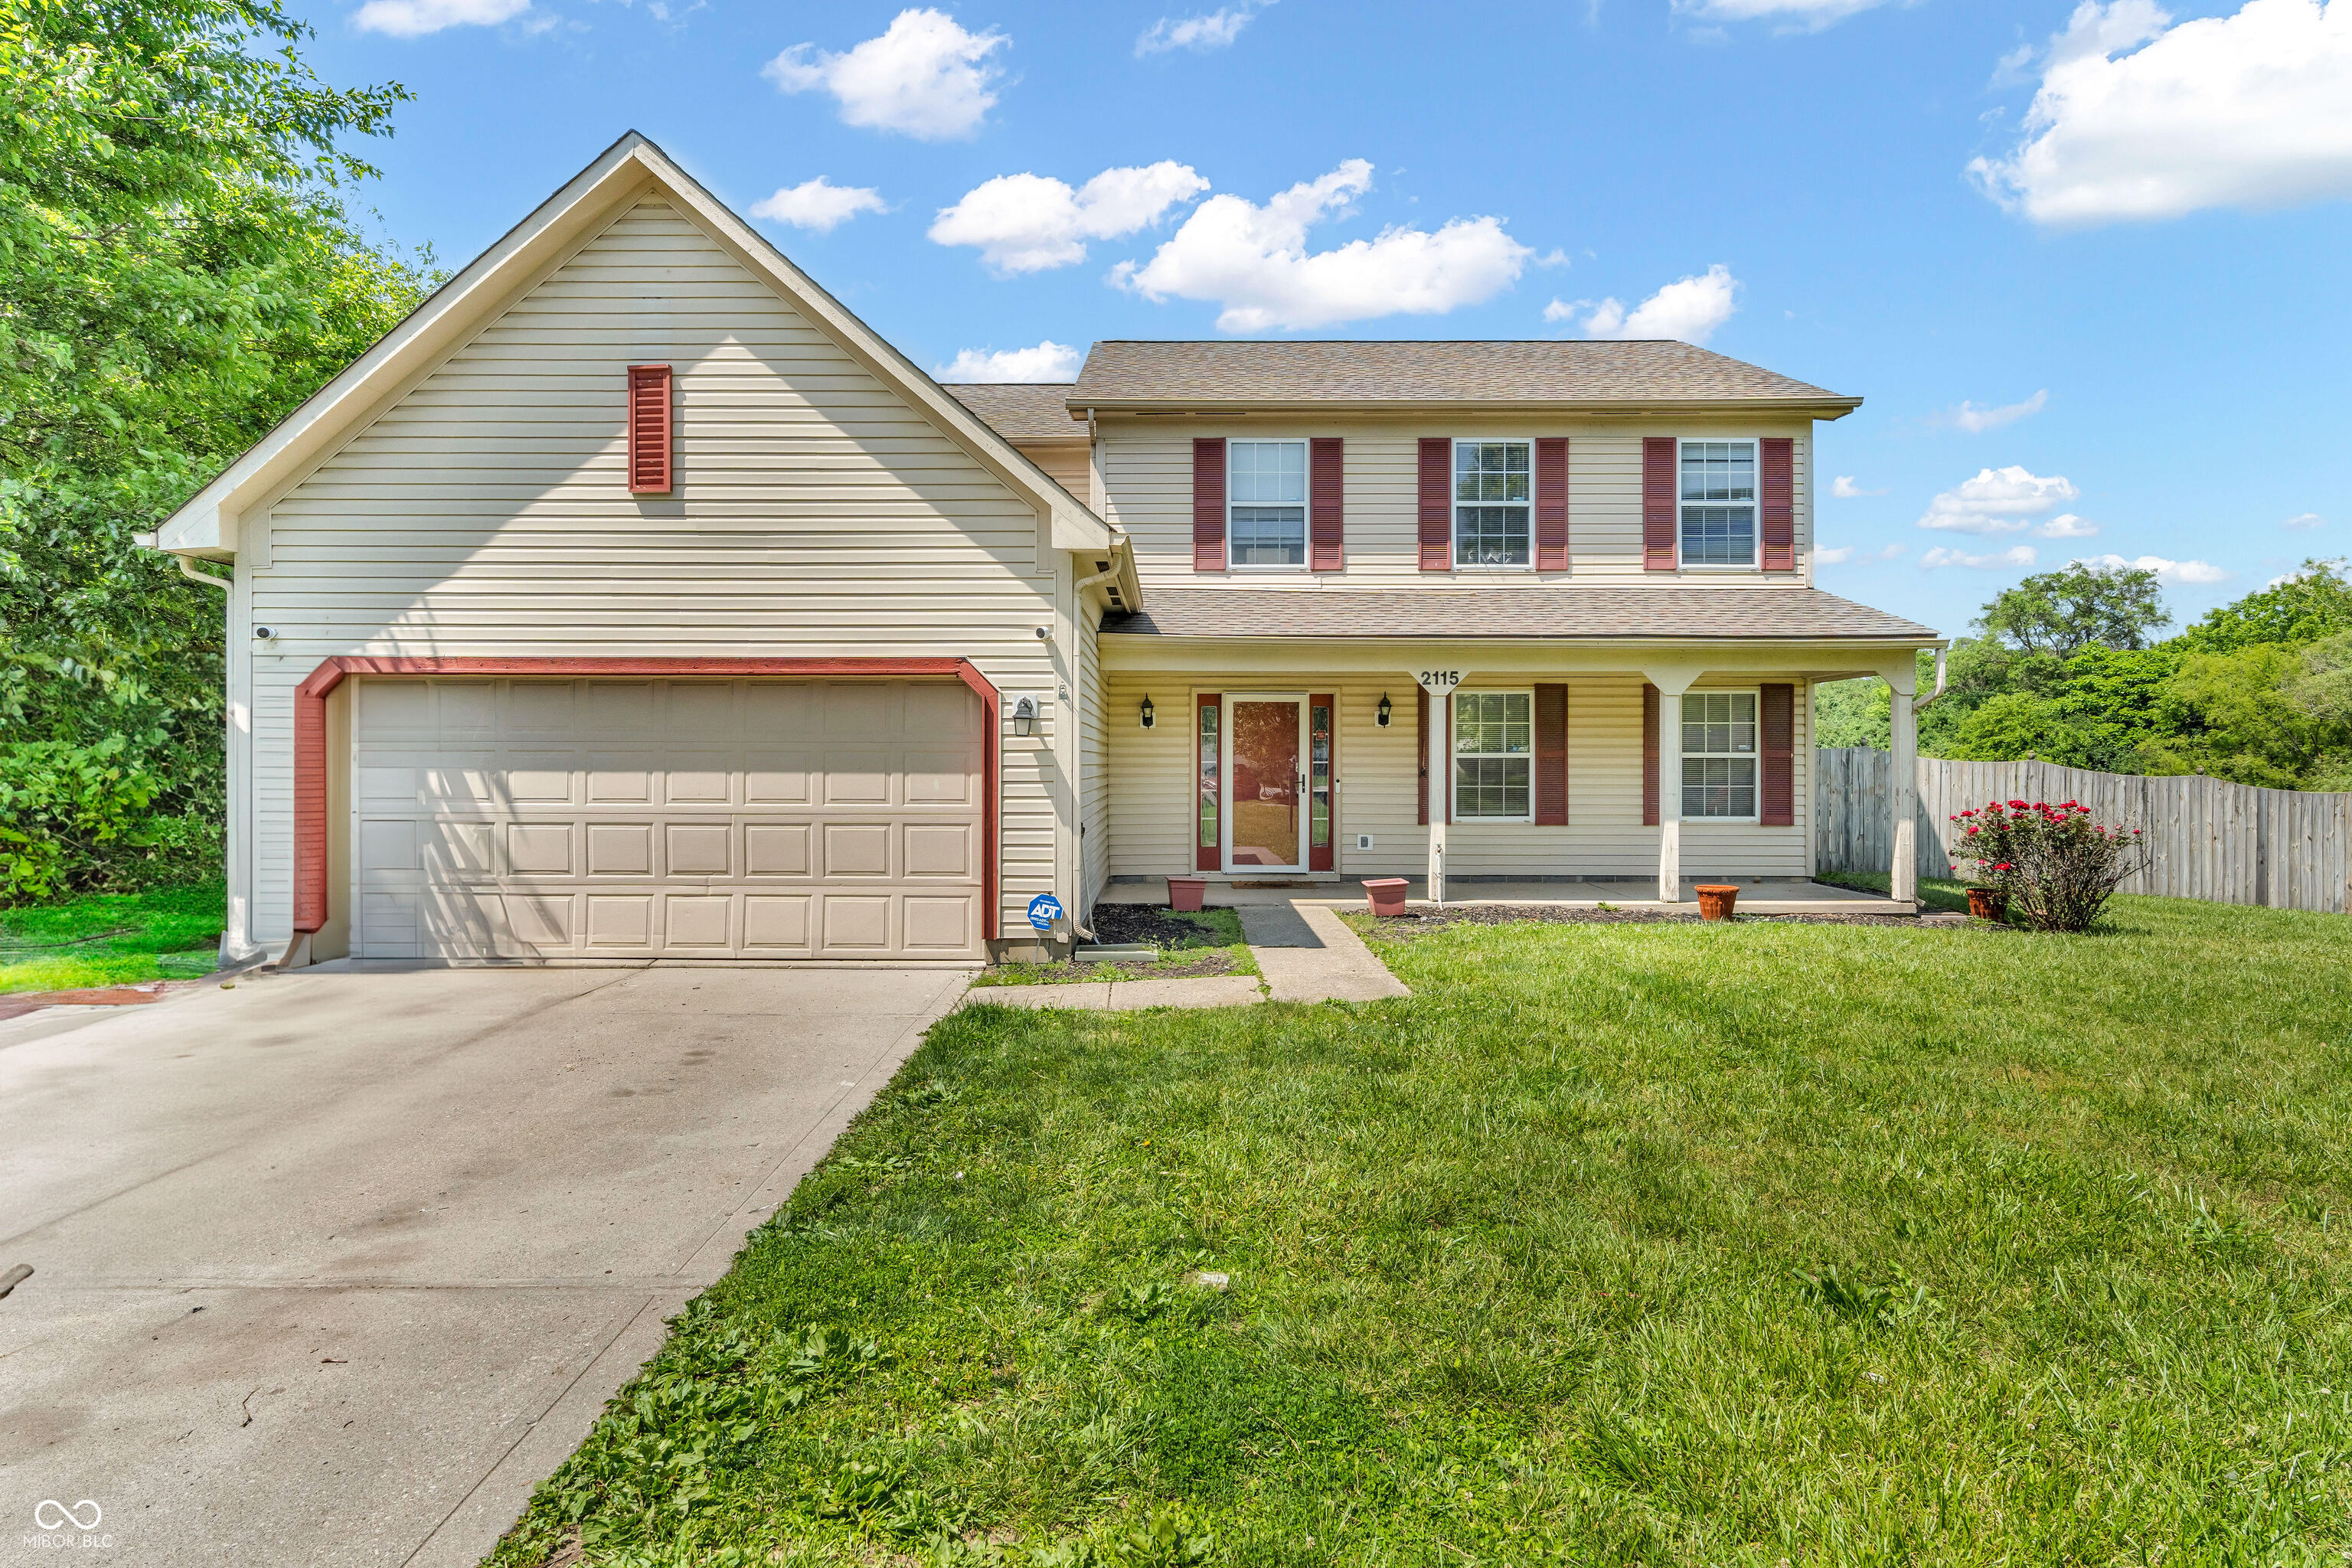
Active
$300,000
4
bds
|
3
ba
|
2,416
sqft
|
built
1995
2115 Napa Cir, Indianapolis, IN 46214
$16
Cash flow
0.3%
Cash-on-Cash Return
6.3%
Cap rate
0.8%
Rent to Value Ratio
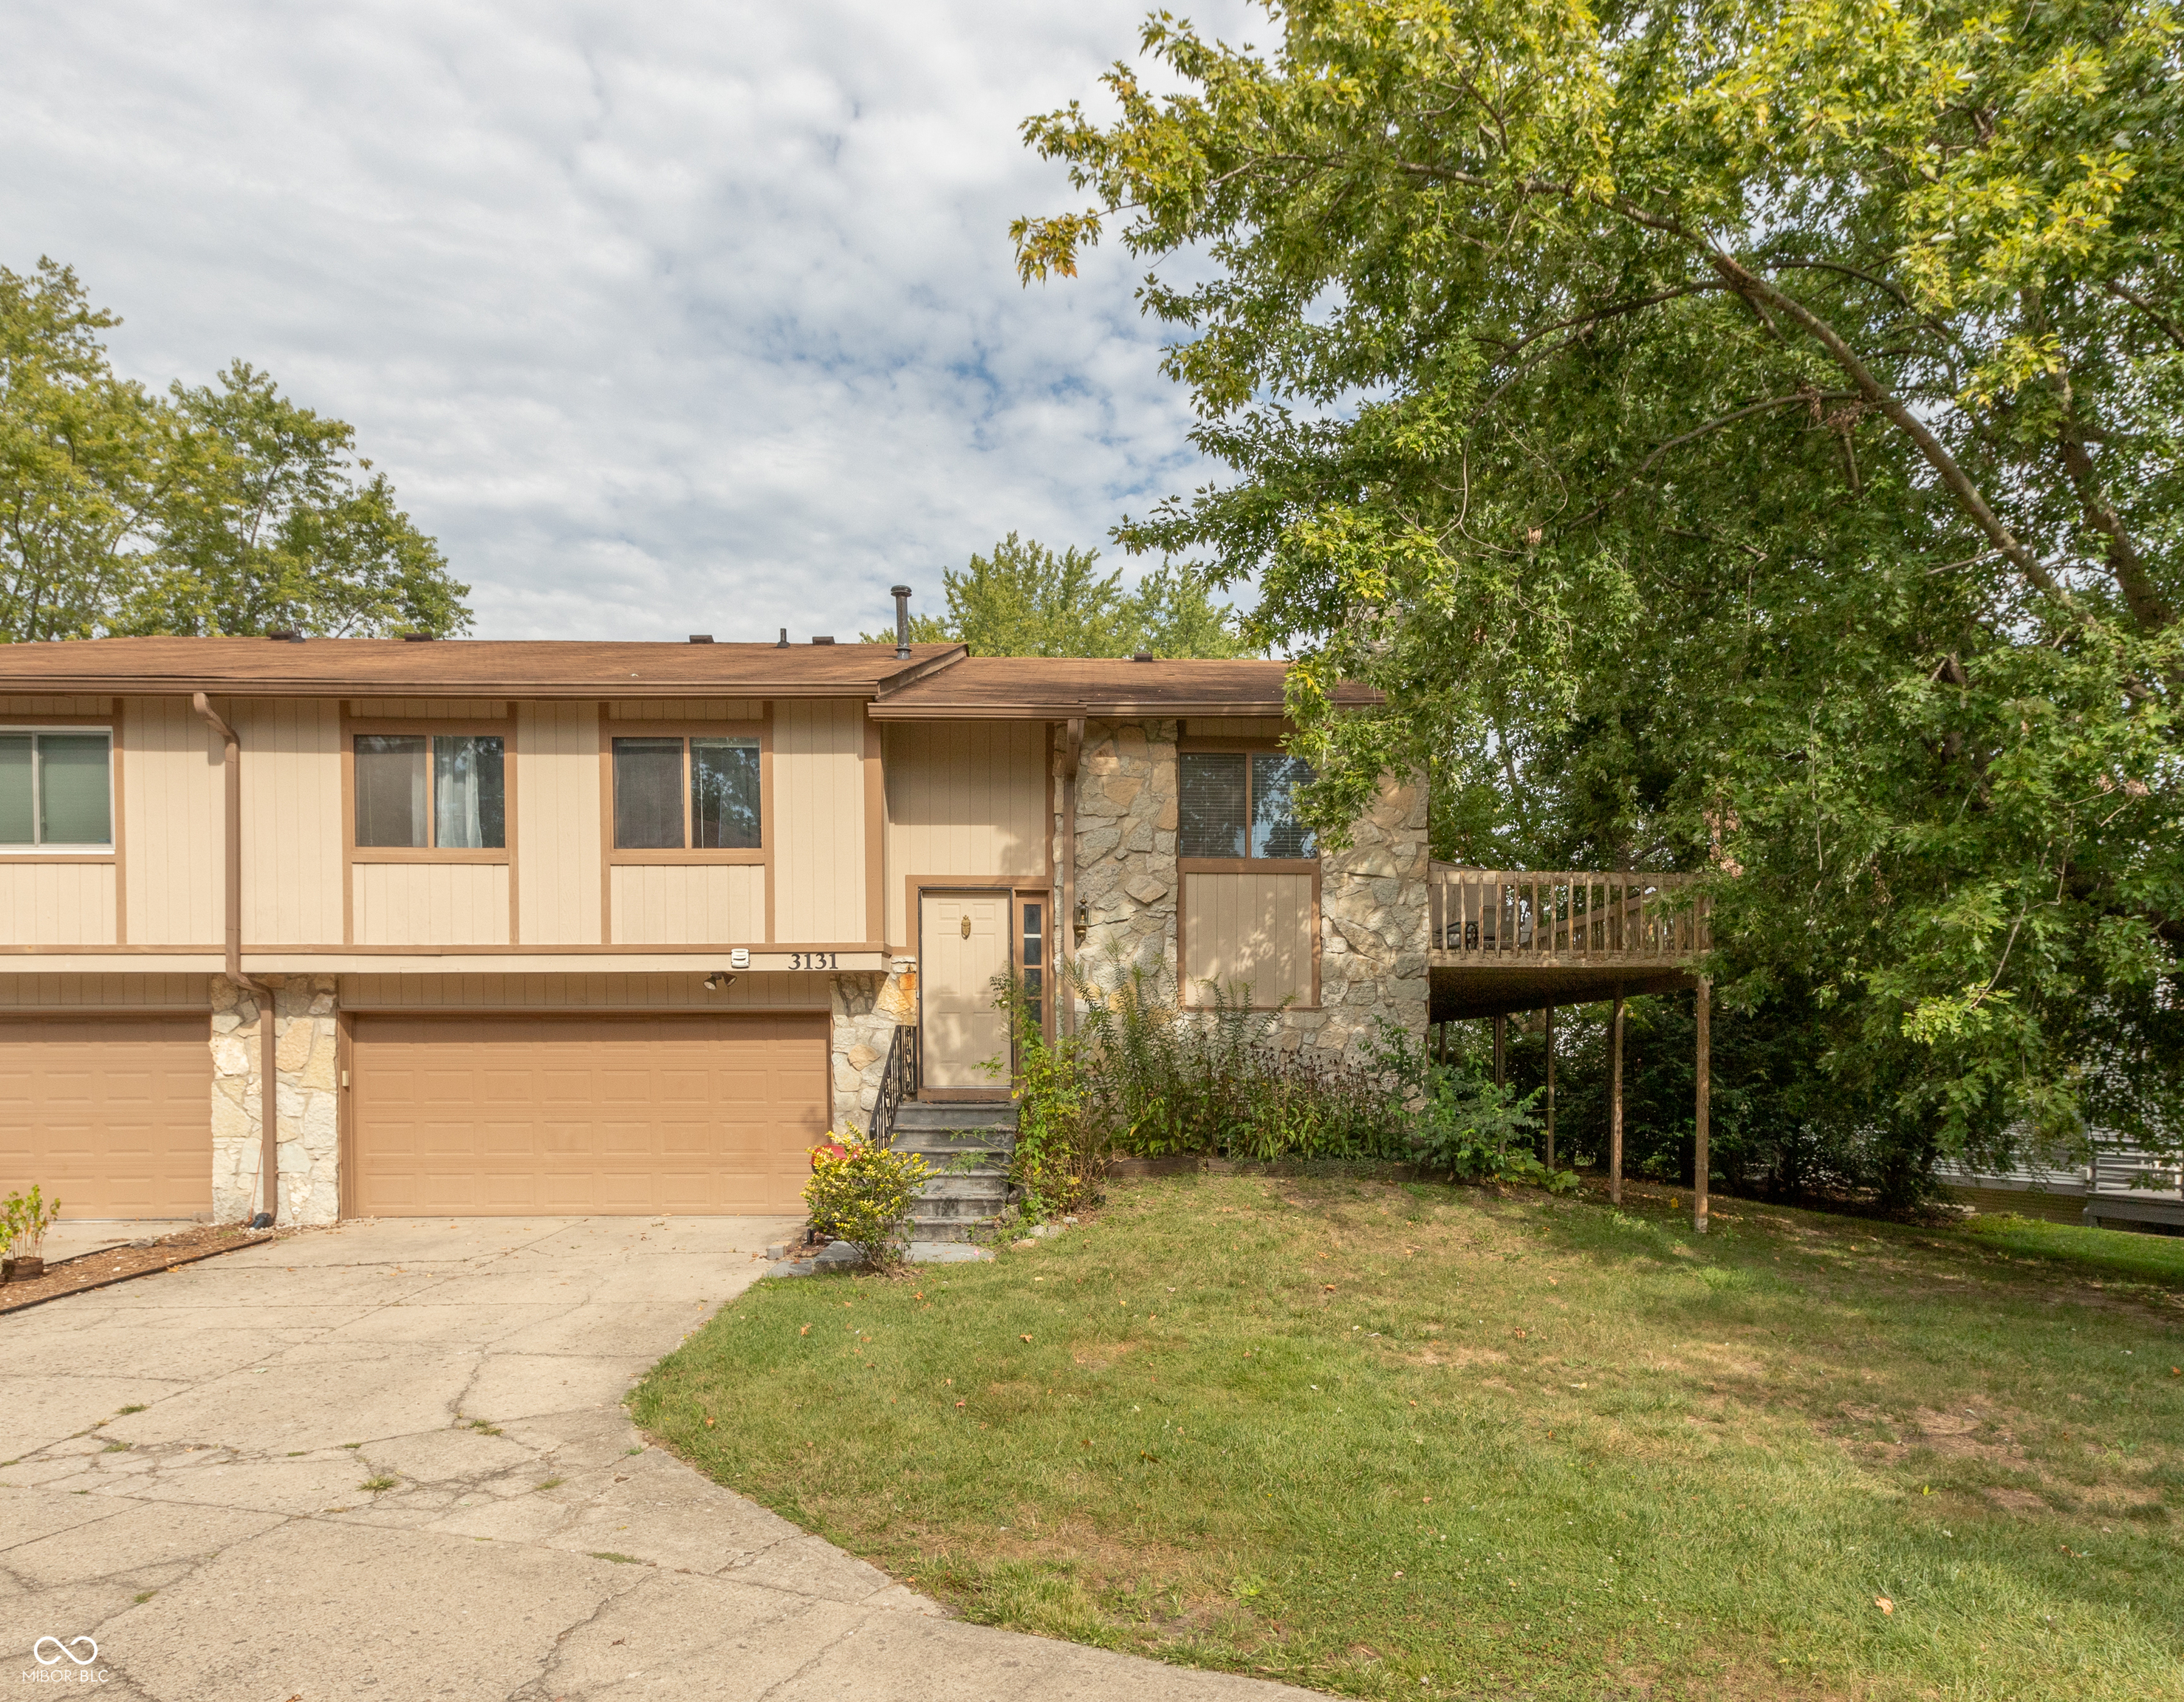
Active
$185,000
3
bds
|
2
ba
|
2,016
sqft
|
built
1979
3131 Stillmeadow Dr, Indianapolis, IN 46214
$-77
Cash flow
-2.2%
Cash-on-Cash Return
5.8%
Cap rate
0.9%
Rent to Value Ratio
Active
$375,000
2
bds
|
3
ba
|
1,554
sqft
|
built
1991
3260 Eddy Ct, Indianapolis, IN 46214
$-625
Cash flow
-8.7%
Cash-on-Cash Return
4.3%
Cap rate
0.5%
Rent to Value Ratio
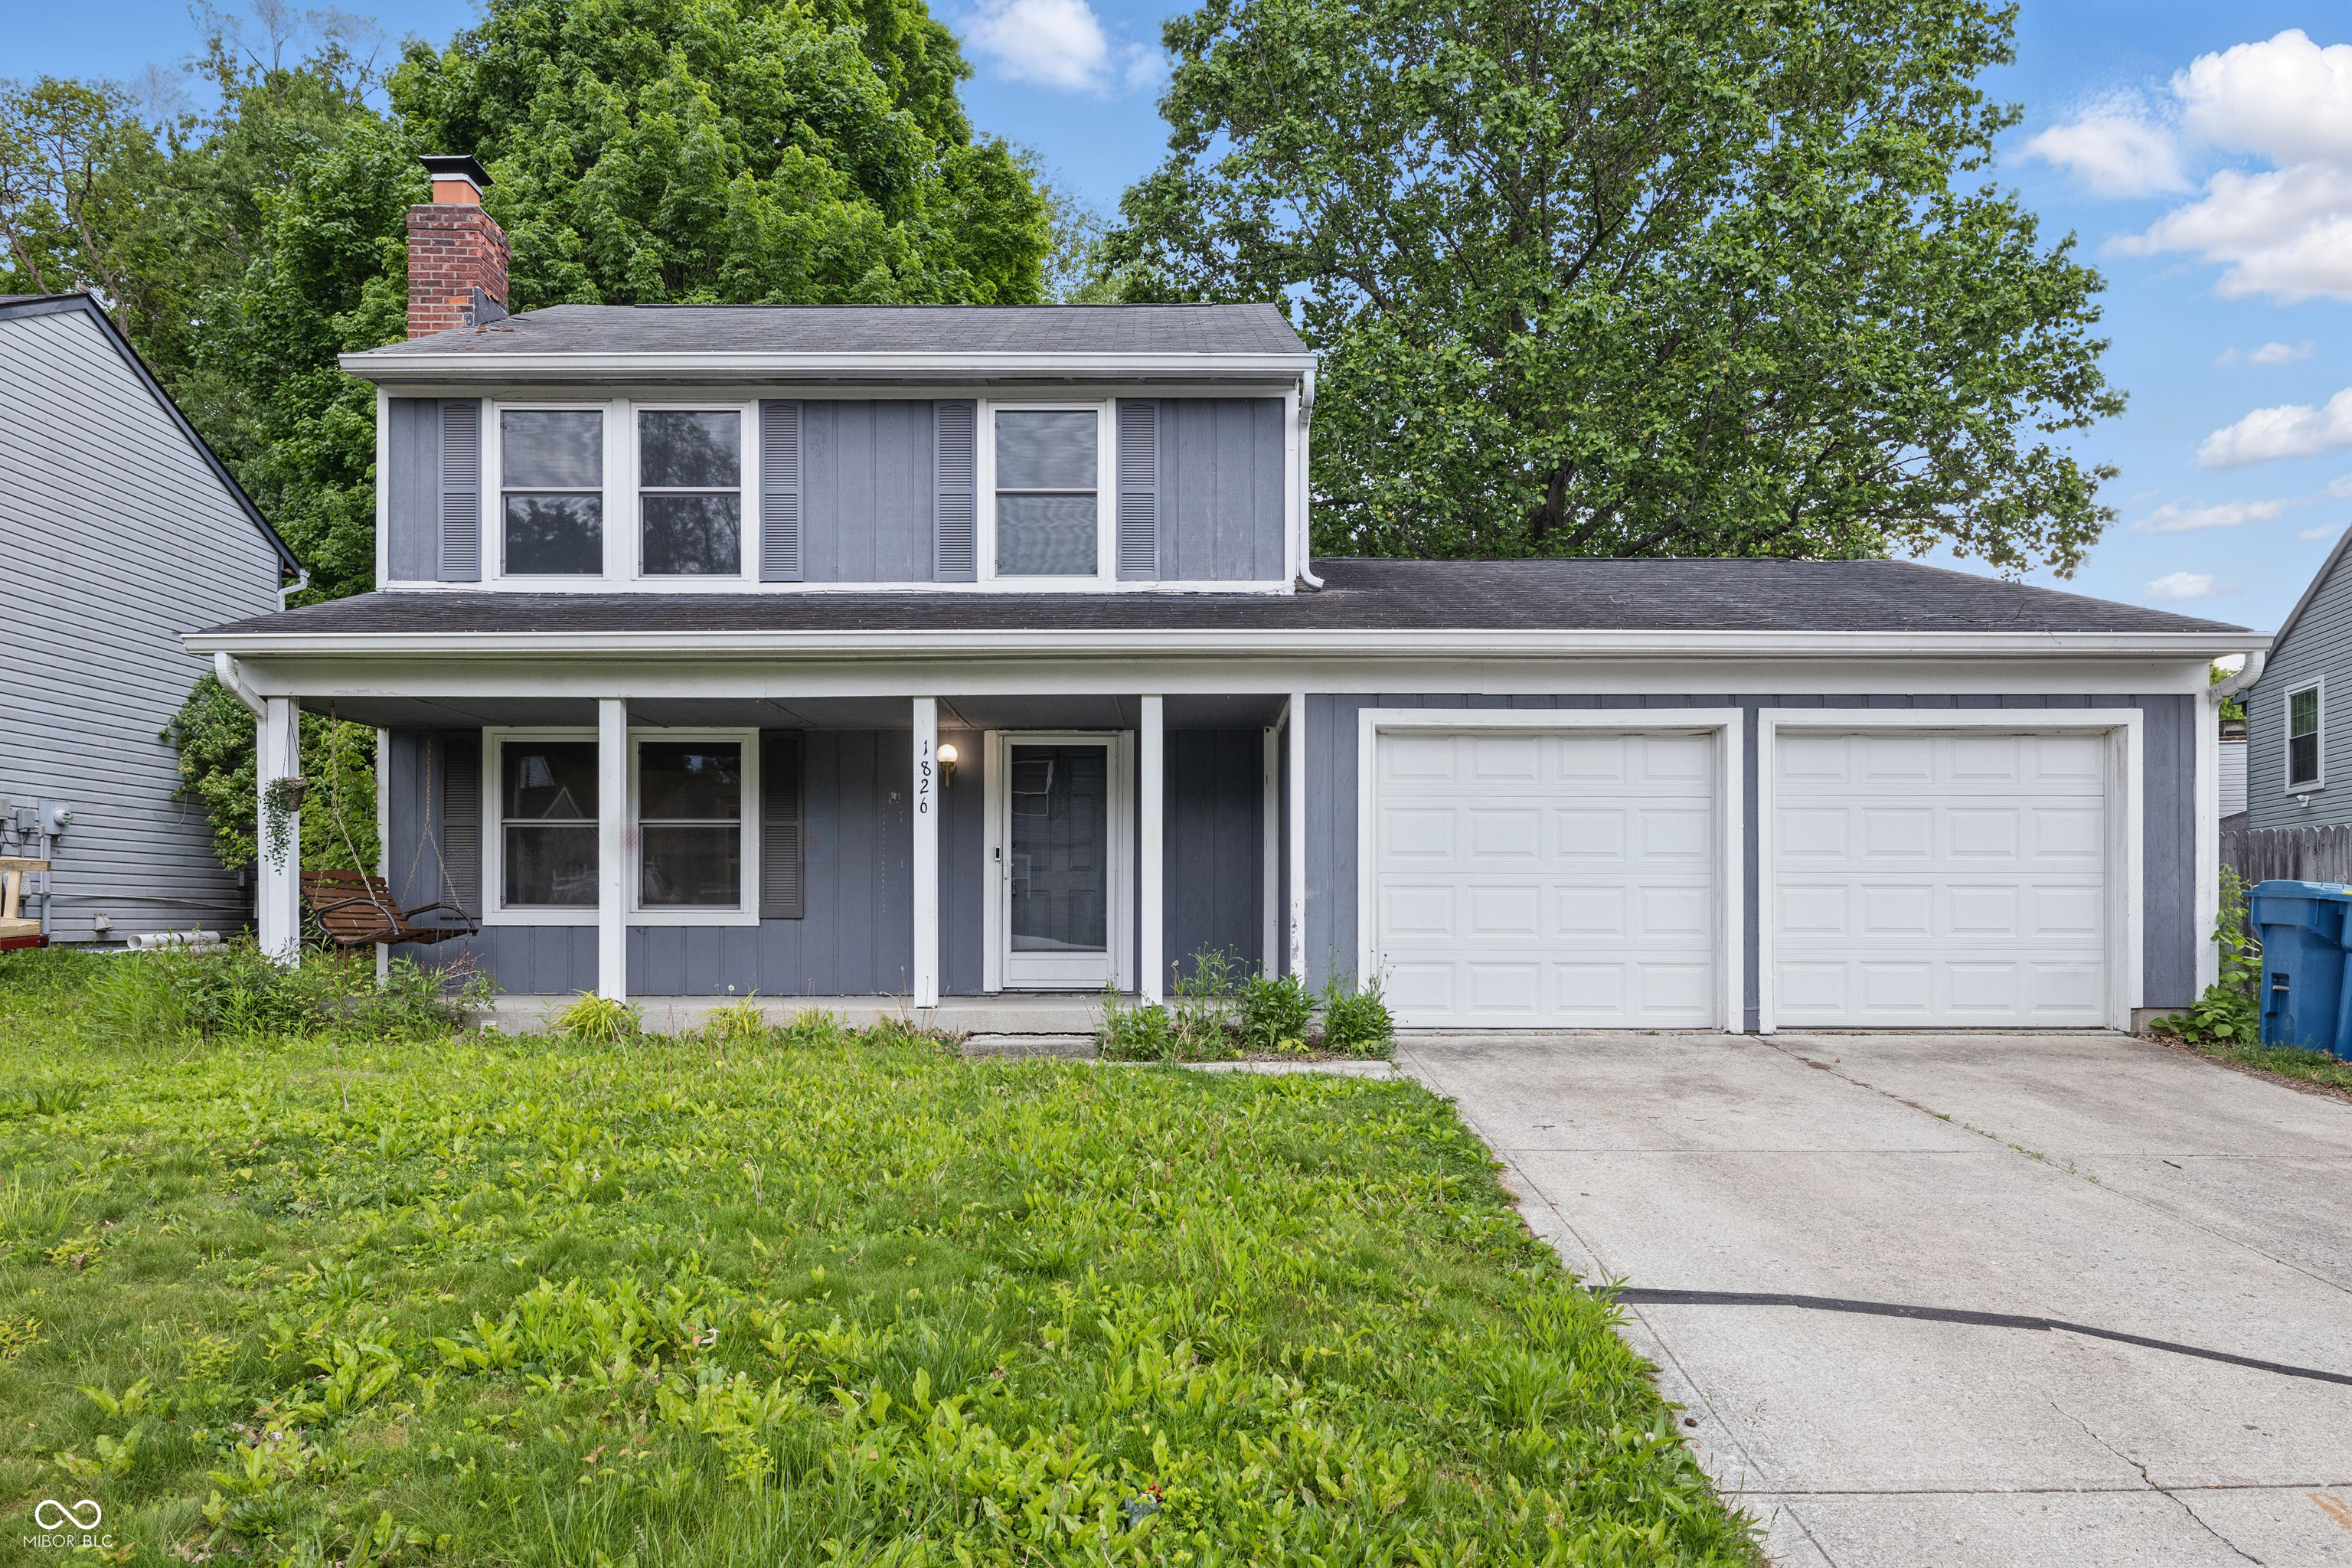
Active
$259,900
3
bds
|
3
ba
|
1,400
sqft
|
built
1986
1826 Shorter Dr, Indianapolis, IN 46214
$-119
Cash flow
-2.4%
Cash-on-Cash Return
5.7%
Cap rate
0.7%
Rent to Value Ratio
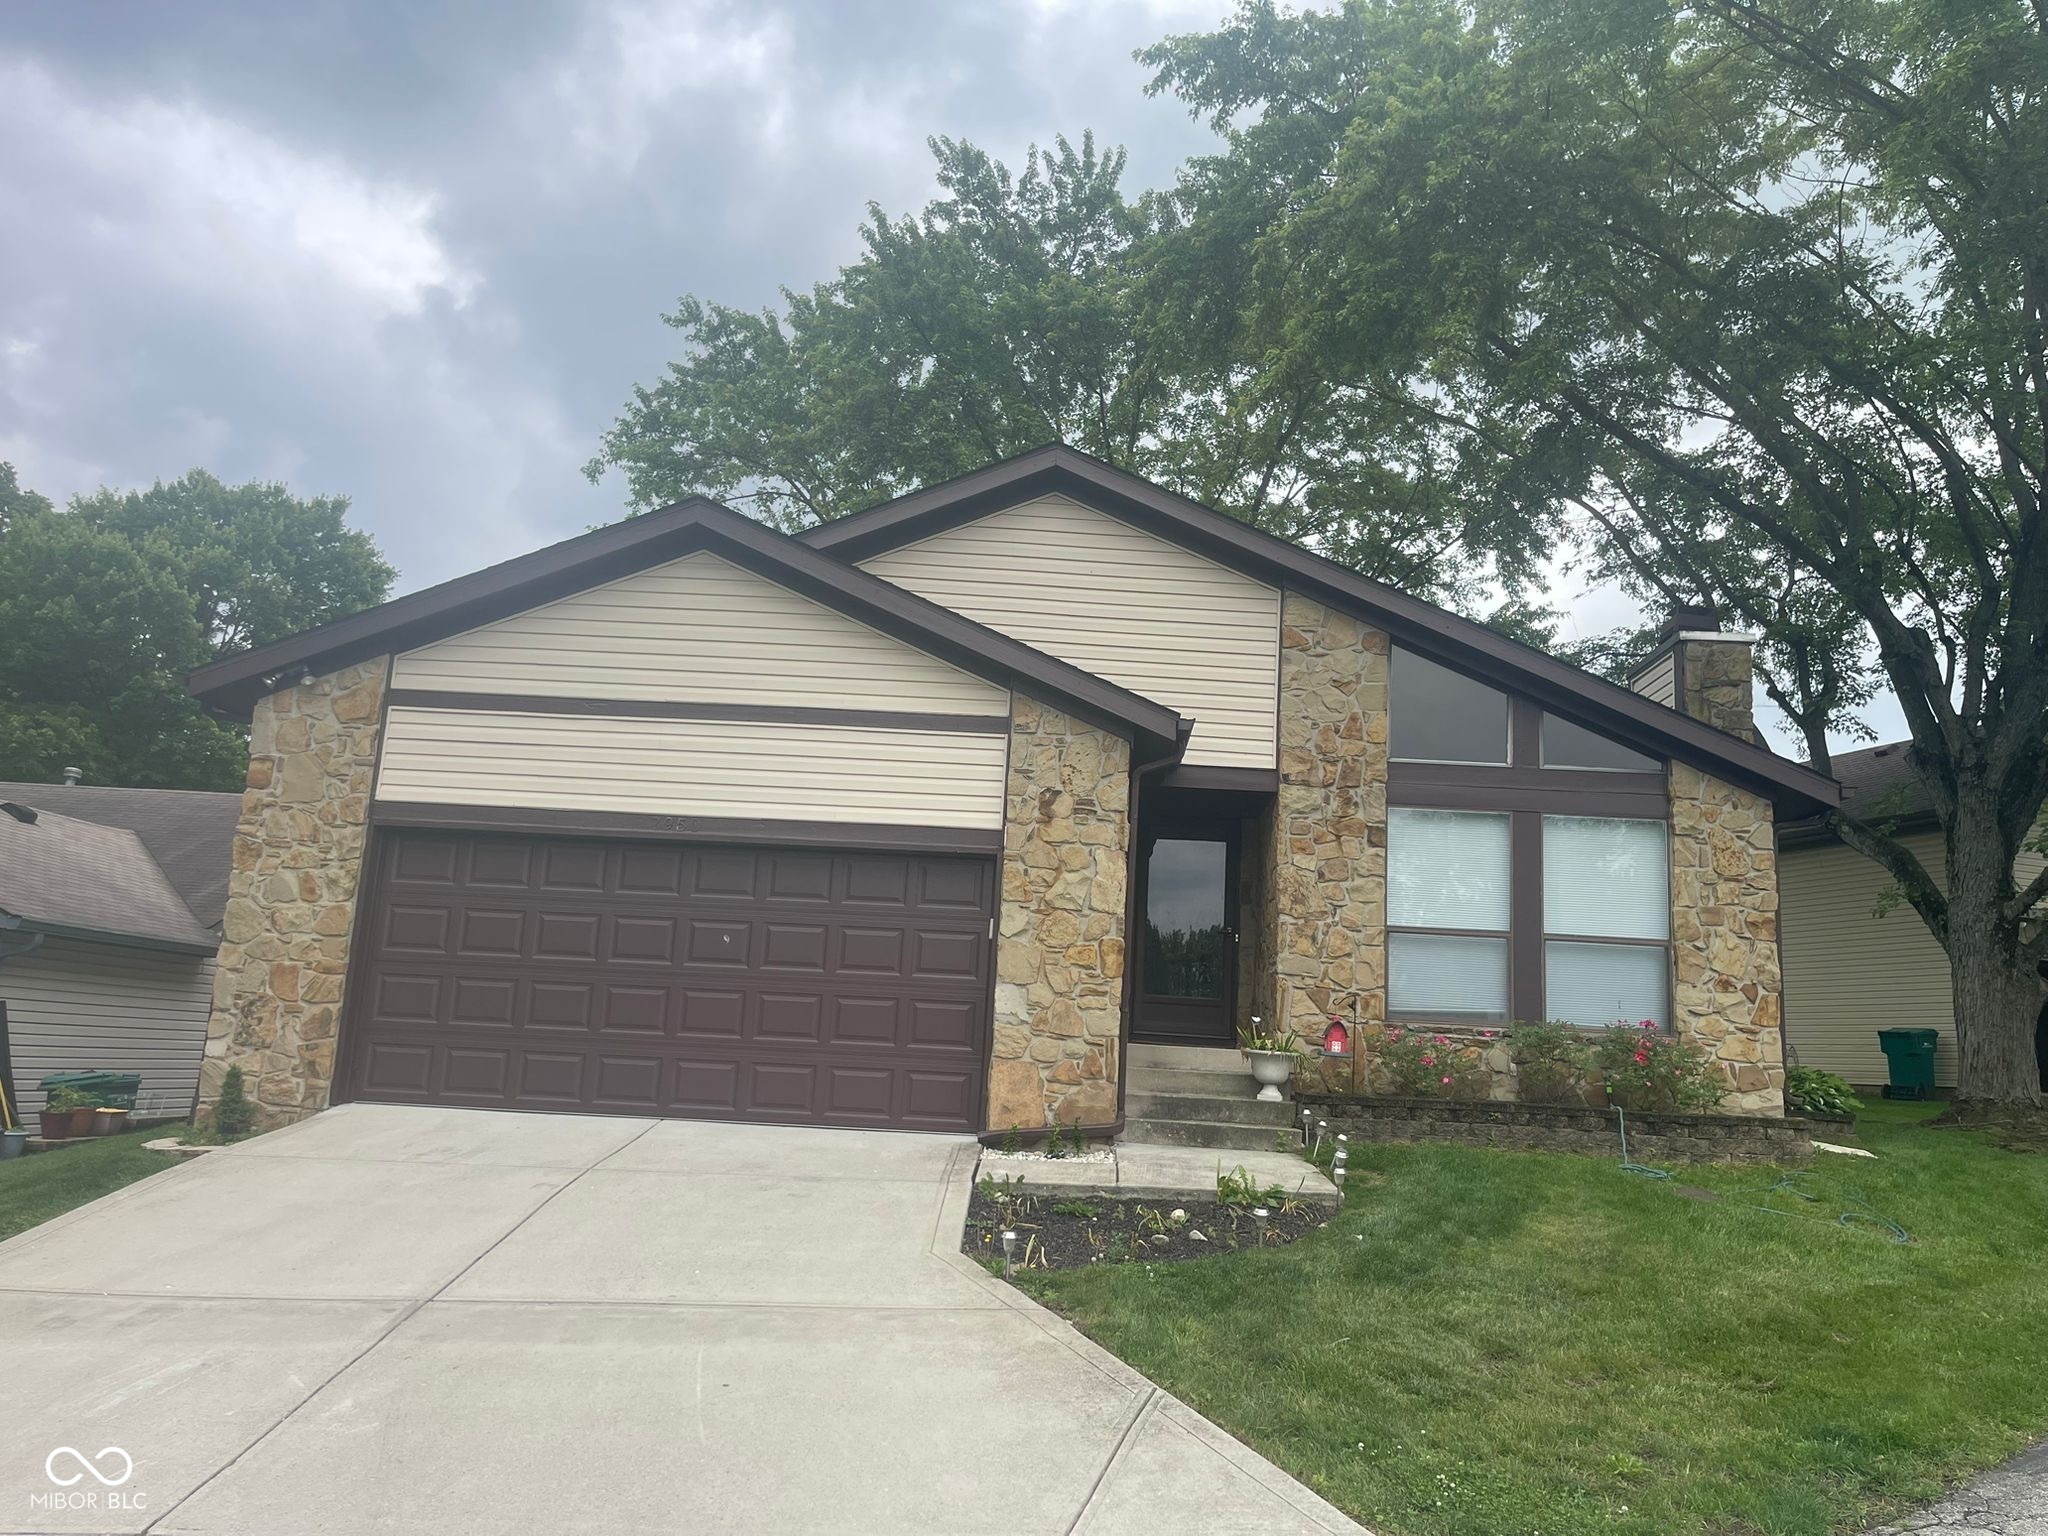
Active
$234,000
3
bds
|
3
ba
|
1,740
sqft
|
built
1977
3202 Acacia Dr, Indianapolis, IN 46214
$155
Cash flow
3.5%
Cash-on-Cash Return
7.1%
Cap rate
0.9%
Rent to Value Ratio
Active
$950,000
4
bds
|
0
ba
|
0
sqft
|
built
1967
6795 W 21st St, Indianapolis, IN 46214
$-1,939
Cash flow
-10.6%
Cash-on-Cash Return
3.8%
Cap rate
0.5%
Rent to Value Ratio
Pending
$244,900
4
bds
|
3
ba
|
1,607
sqft
|
built
2014
1139 Topp Creek Dr, Indianapolis, IN 46214
$-159
Cash flow
-3.4%
Cash-on-Cash Return
5.5%
Cap rate
0.7%
Rent to Value Ratio
Active
$185,000
2
bds
|
3
ba
|
1,325
sqft
|
built
1990
3213 Oceanline East Dr, Indianapolis, IN 46214
$41
Cash flow
1.2%
Cash-on-Cash Return
6.6%
Cap rate
1.0%
Rent to Value Ratio
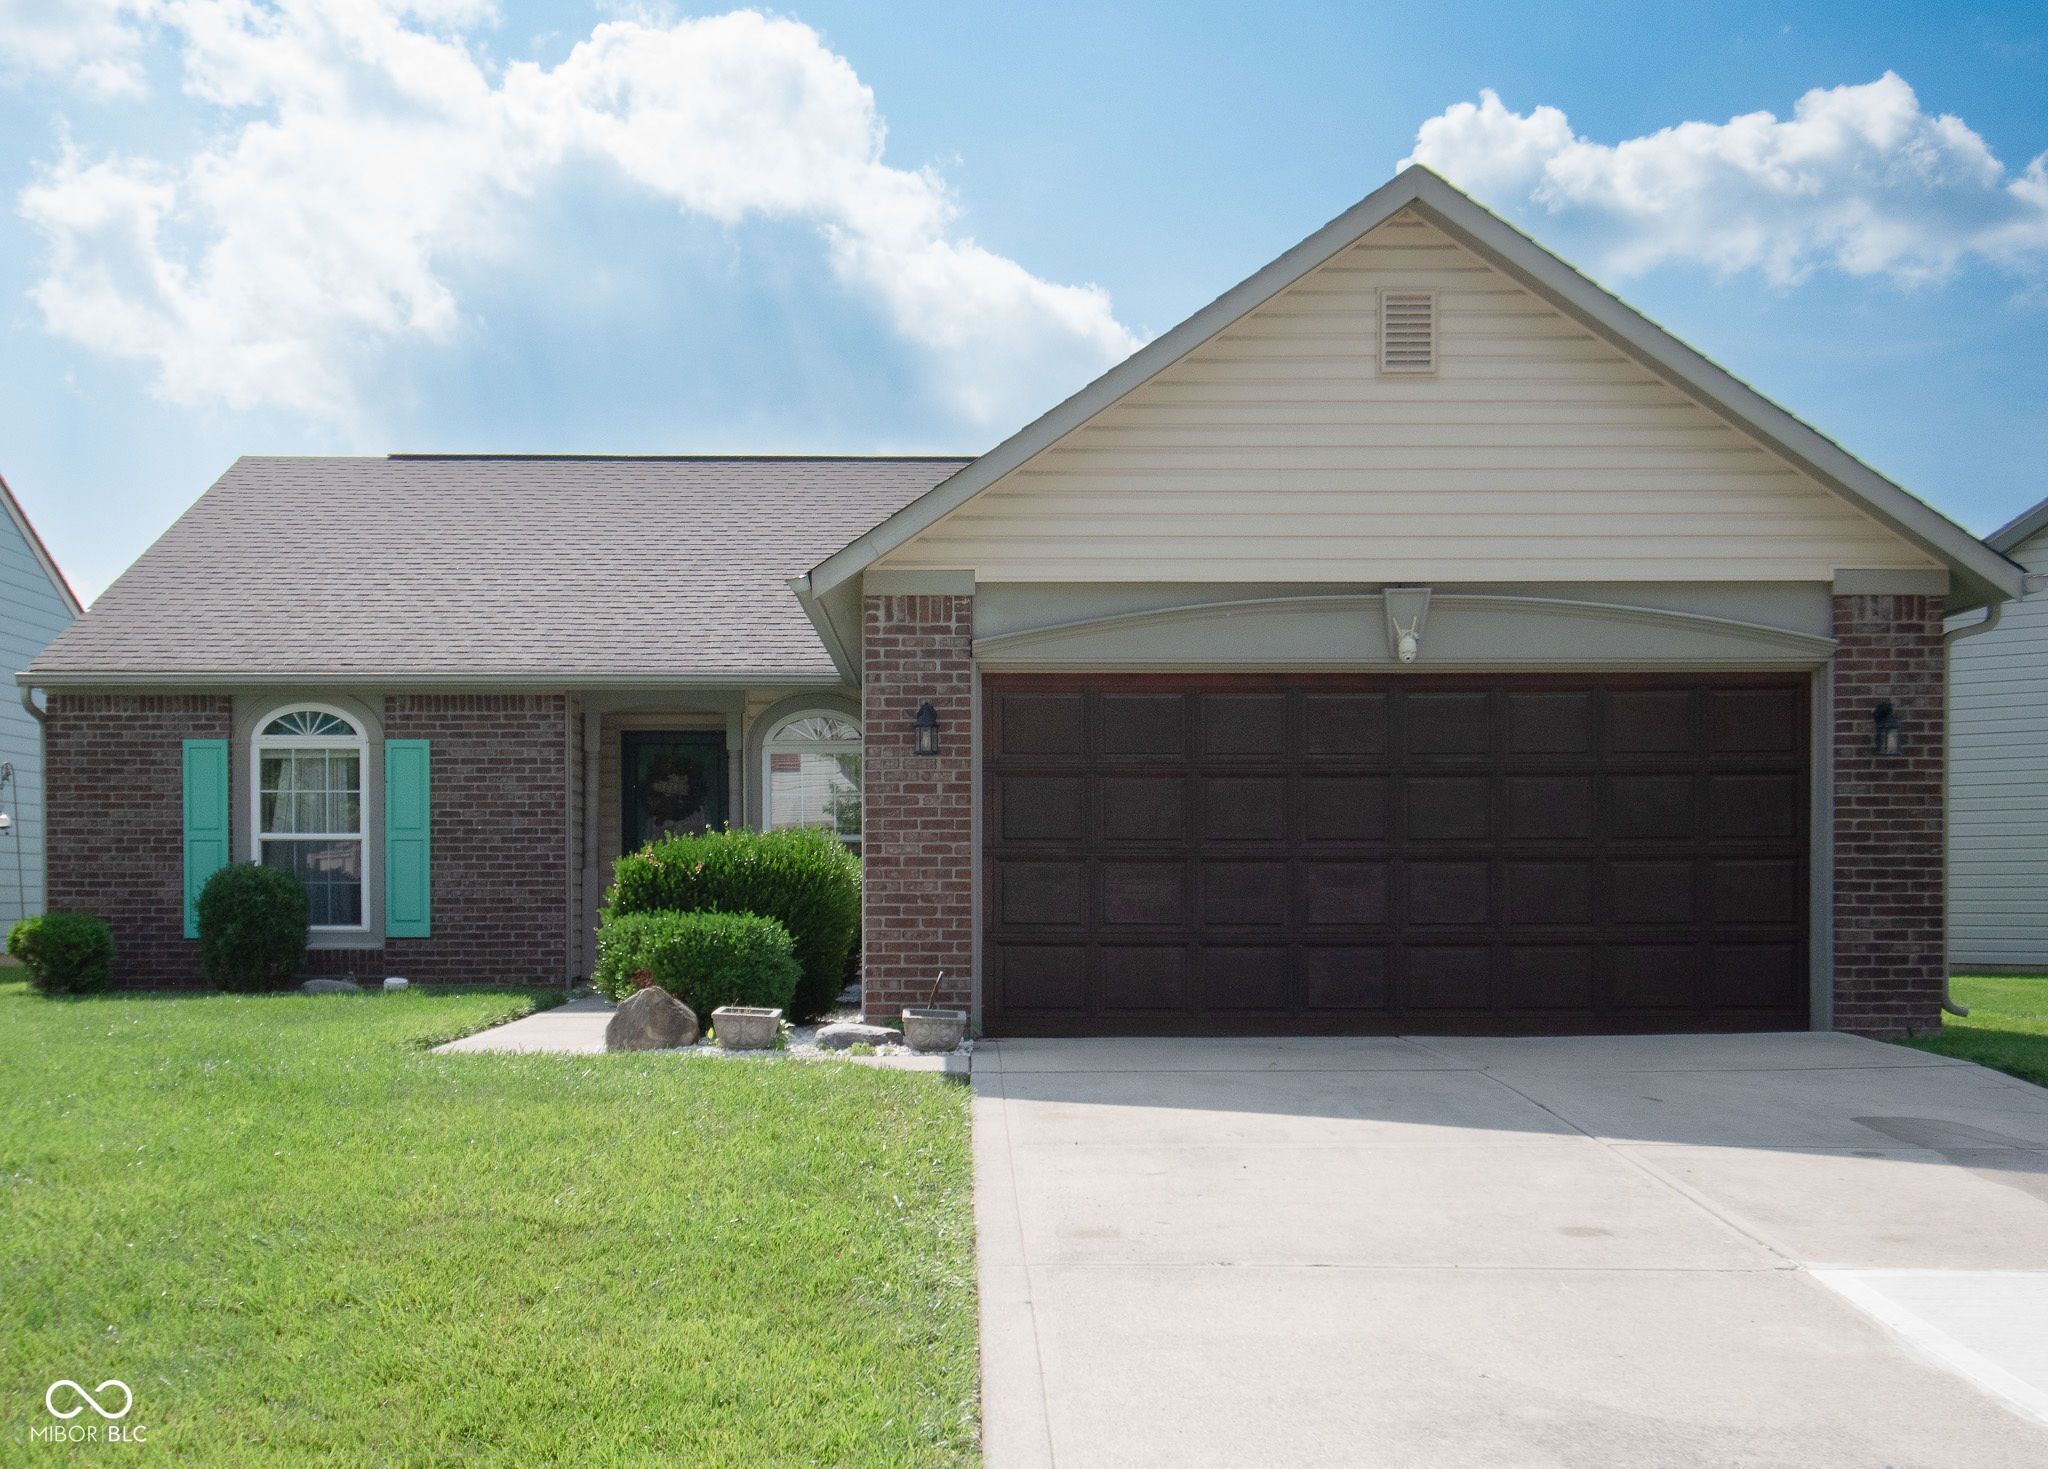
Active
$225,000
3
bds
|
2
ba
|
1,710
sqft
|
built
1968
530 Westmore Dr, Indianapolis, IN 46214
$202
Cash flow
4.7%
Cash-on-Cash Return
7.4%
Cap rate
0.9%
Rent to Value Ratio
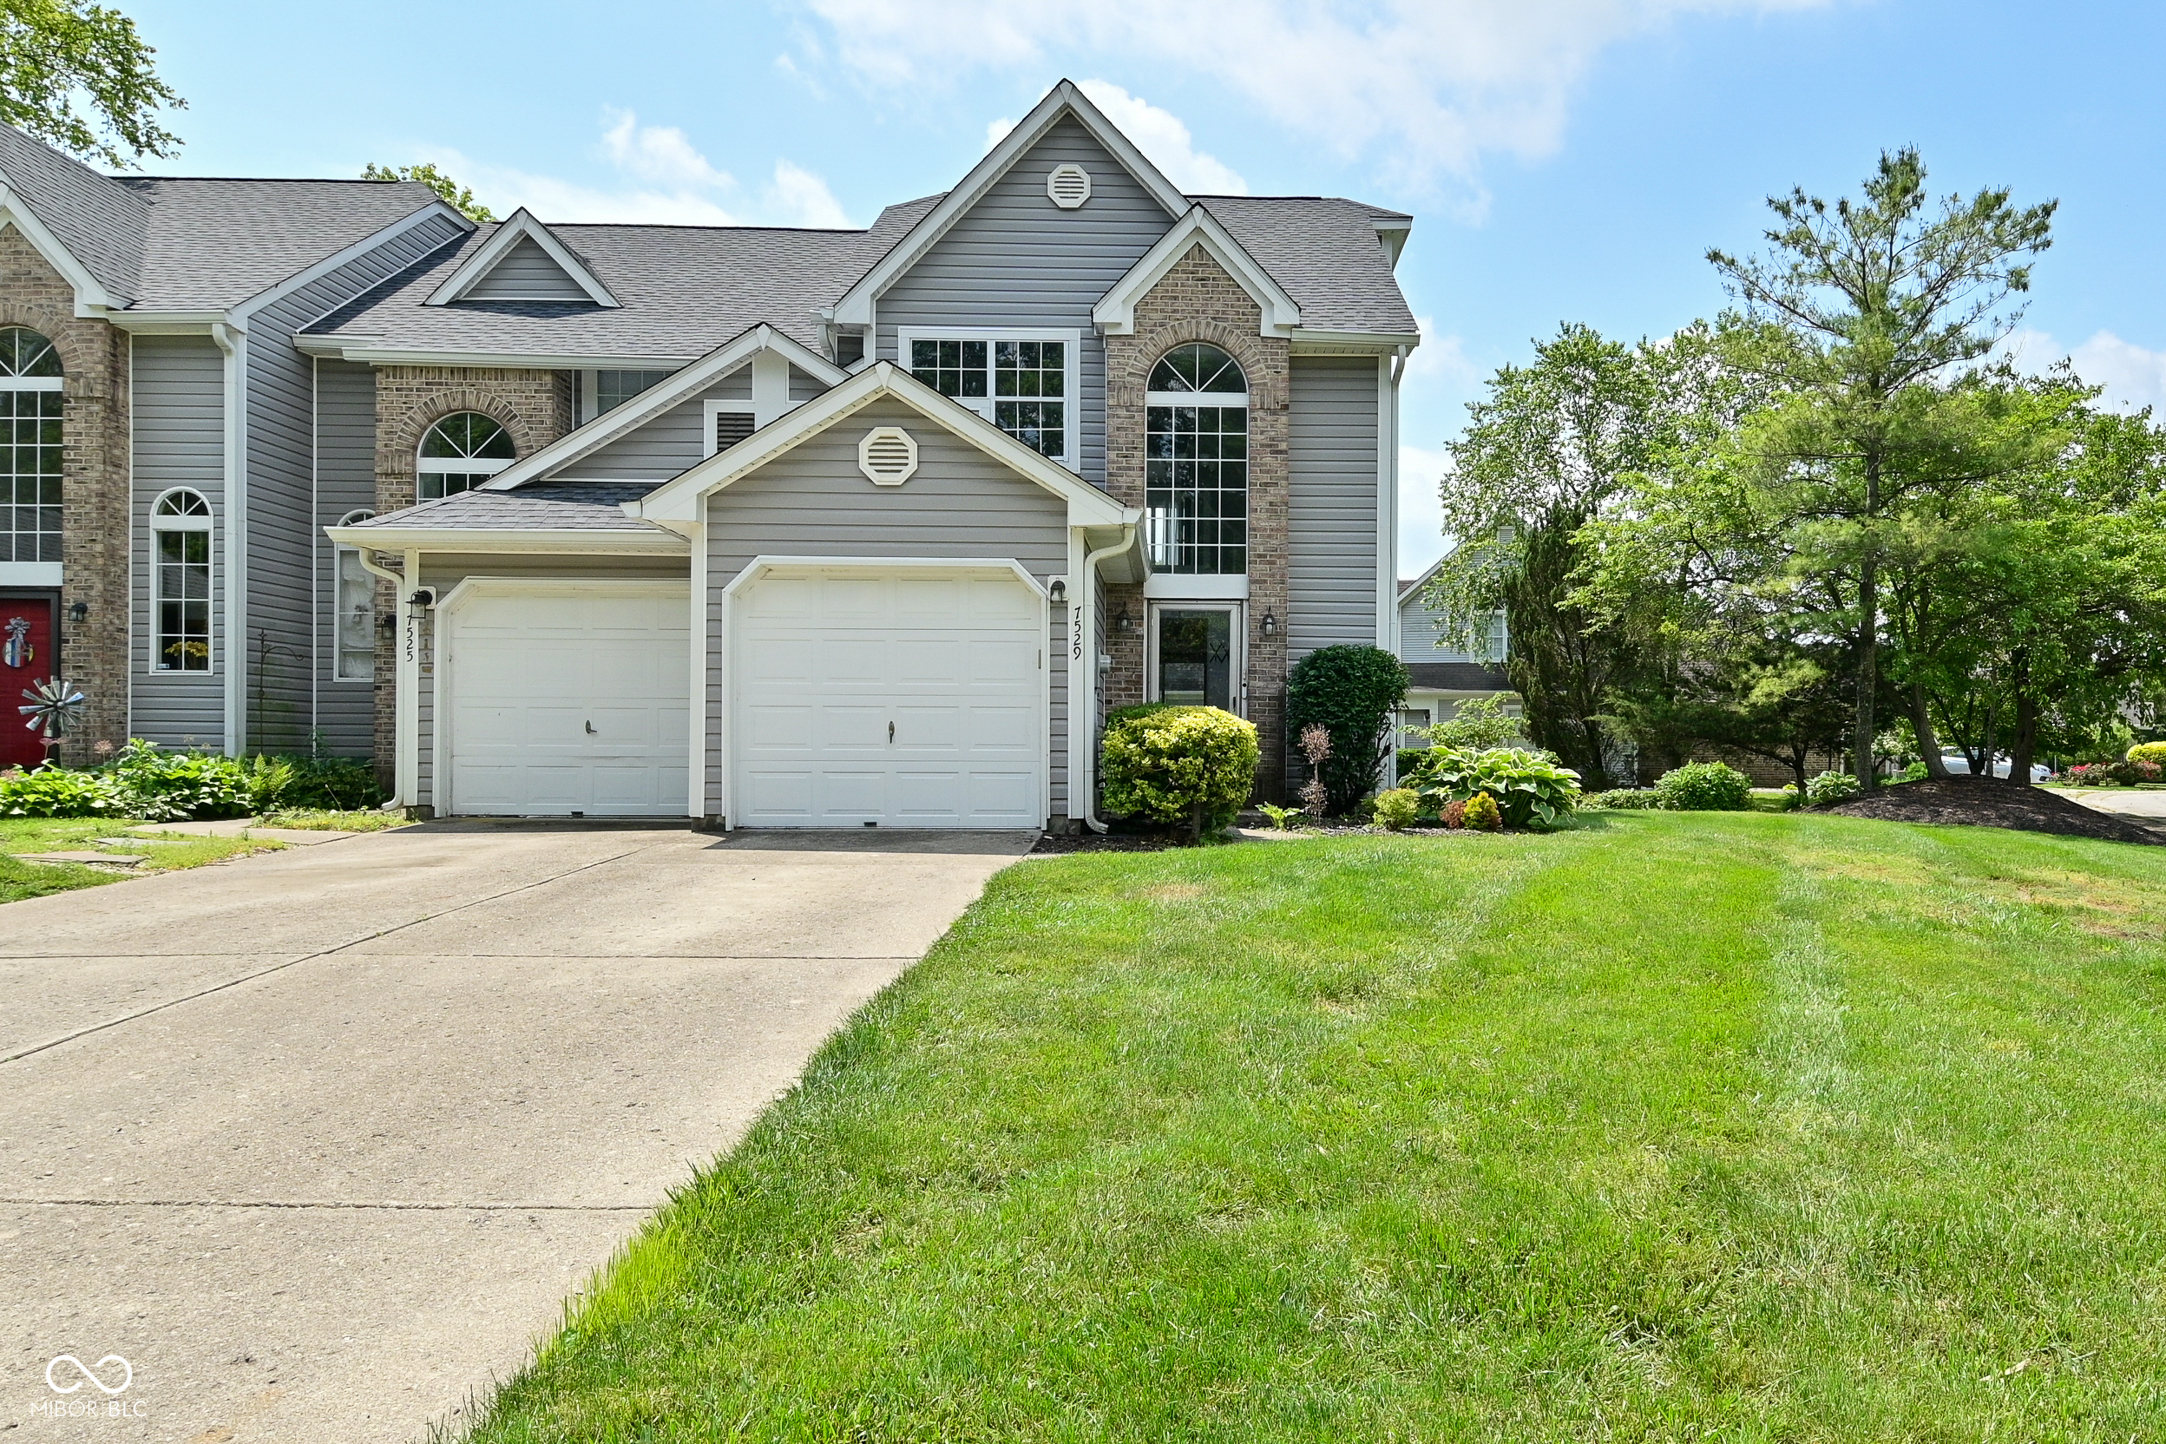
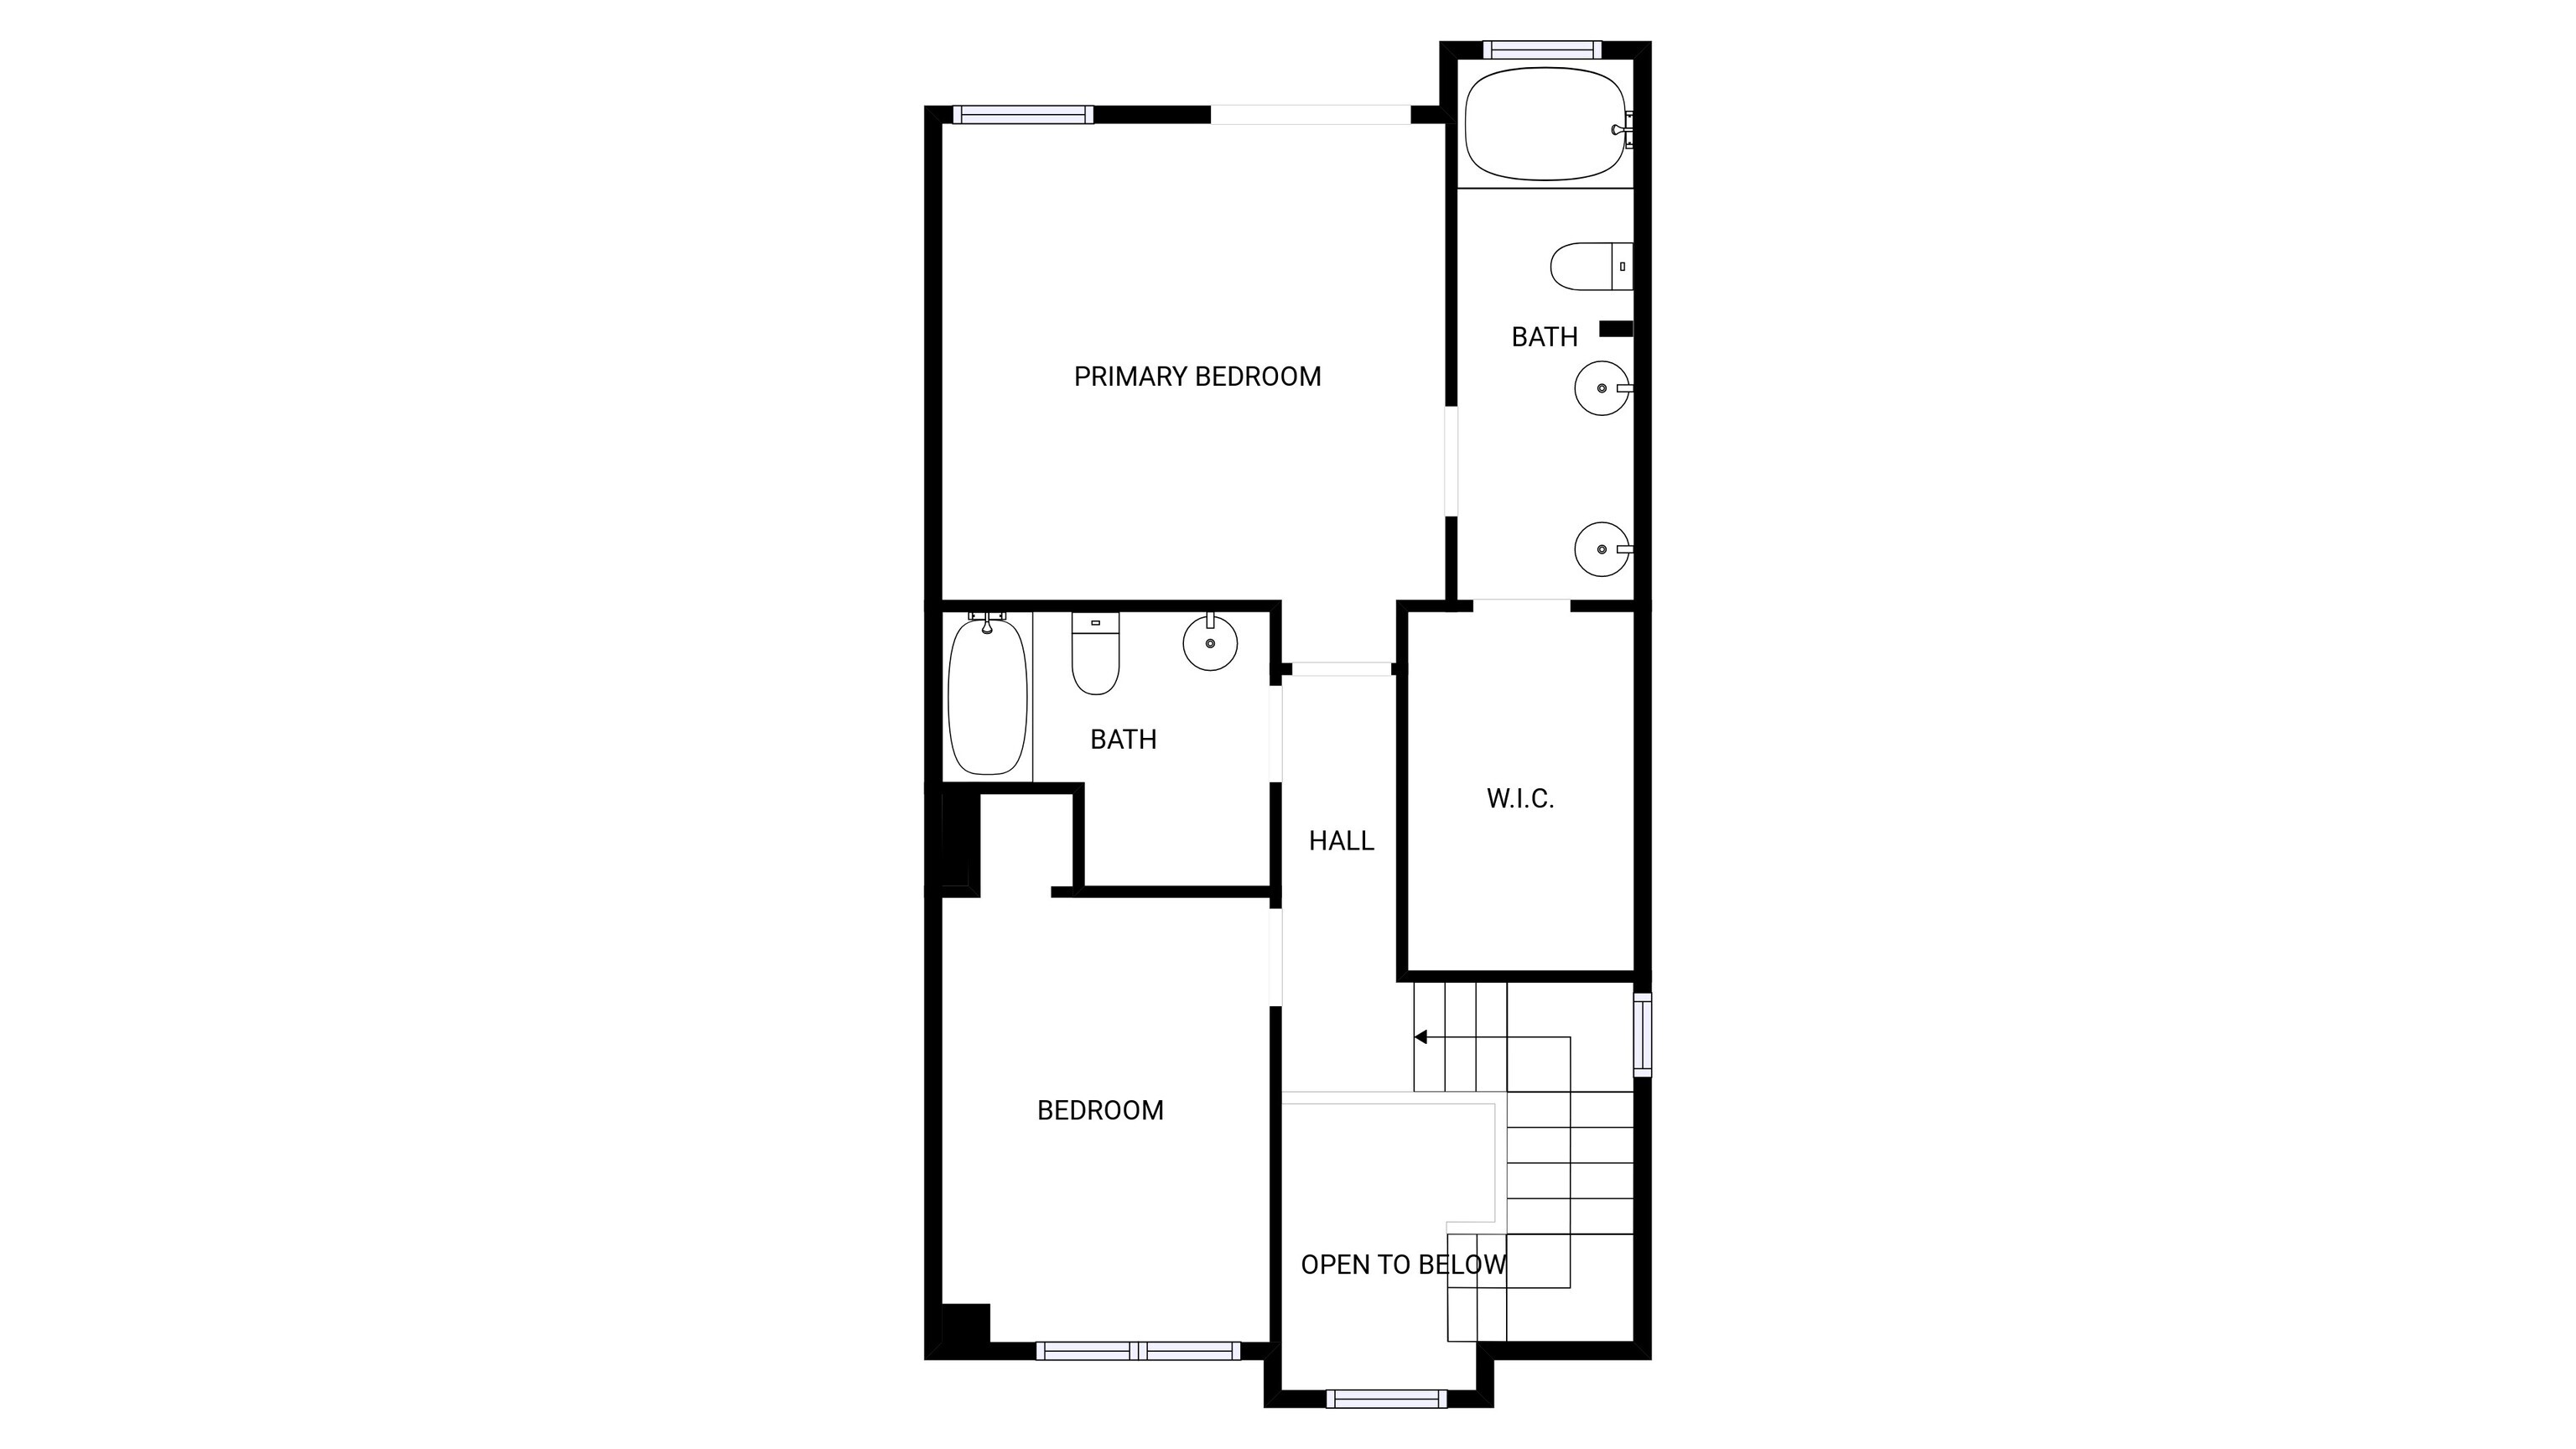
Active
$225,000
2
bds
|
3
ba
|
1,286
sqft
|
built
1991
7529 Oceanline Dr, Indianapolis, IN 46214
$-146
Cash flow
-3.4%
Cash-on-Cash Return
5.5%
Cap rate
0.8%
Rent to Value Ratio
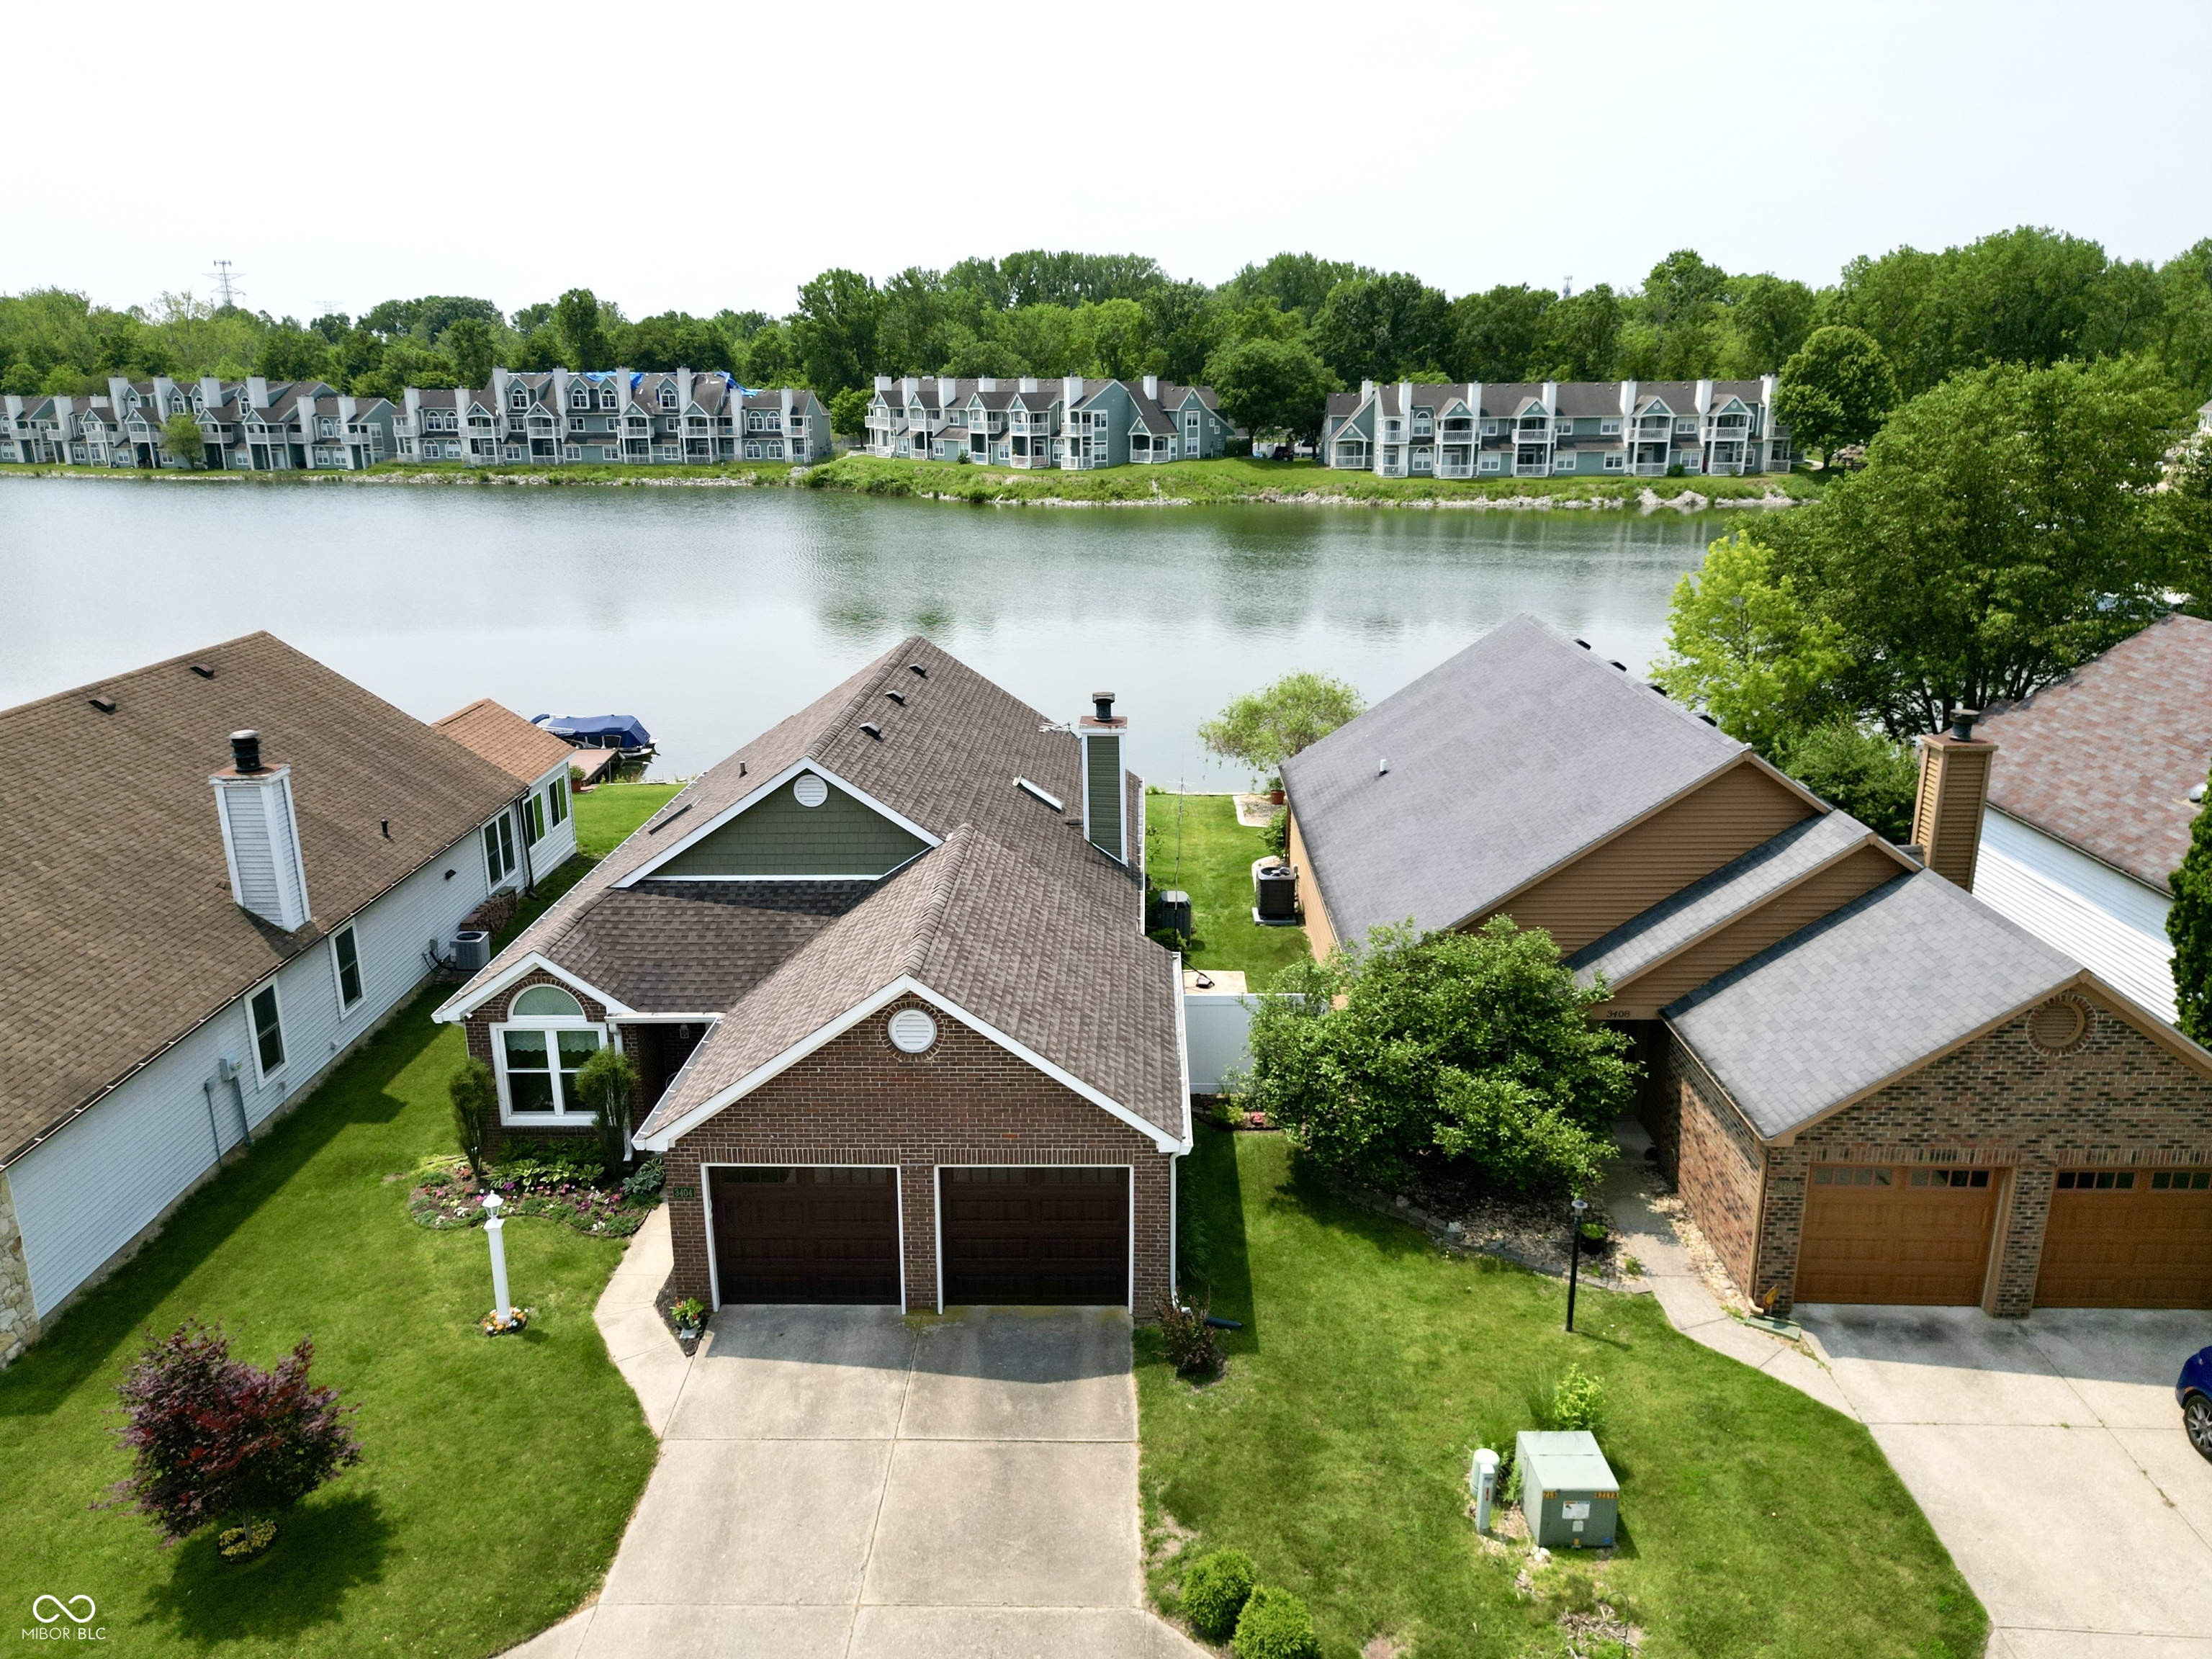
Active
$345,000
3
bds
|
2
ba
|
1,314
sqft
|
built
1988
3404 Maritime Dr, Indianapolis, IN 46214
$-600
Cash flow
-9.1%
Cash-on-Cash Return
4.2%
Cap rate
0.5%
Rent to Value Ratio
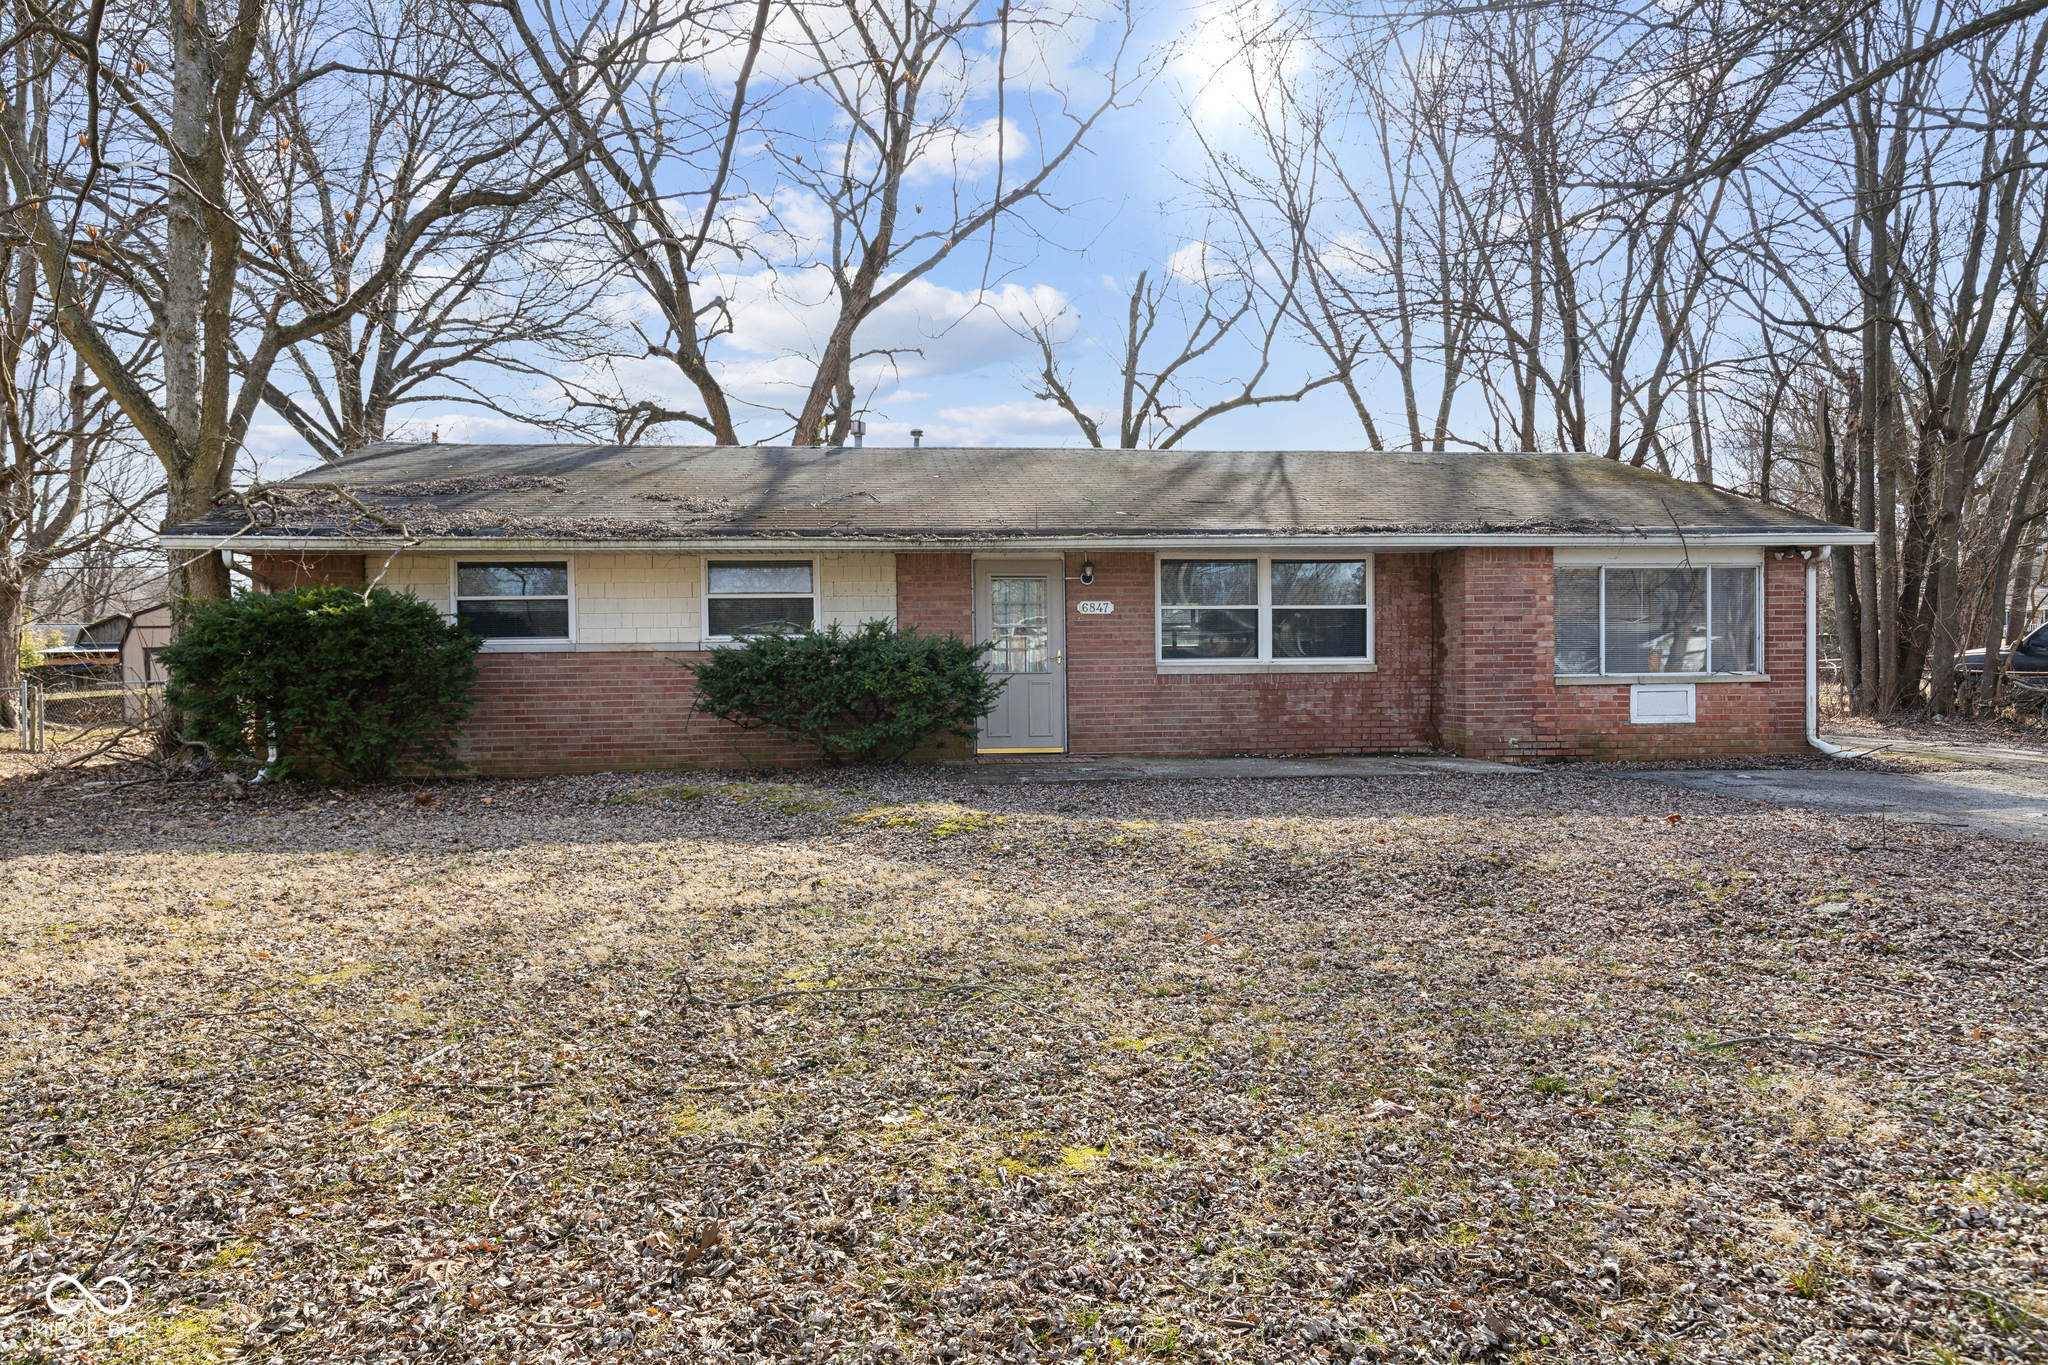
Pending
$200,000
4
bds
|
2
ba
|
1,563
sqft
|
built
1958
6847 W 15th St, Indianapolis, IN 46214
$57
Cash flow
1.5%
Cash-on-Cash Return
6.6%
Cap rate
0.8%
Rent to Value Ratio
Active
$260,000
3
bds
|
2
ba
|
1,900
sqft
|
built
1968
7629 Walton Dr, Indianapolis, IN 46214
$18
Cash flow
0.4%
Cash-on-Cash Return
6.4%
Cap rate
0.8%
Rent to Value Ratio
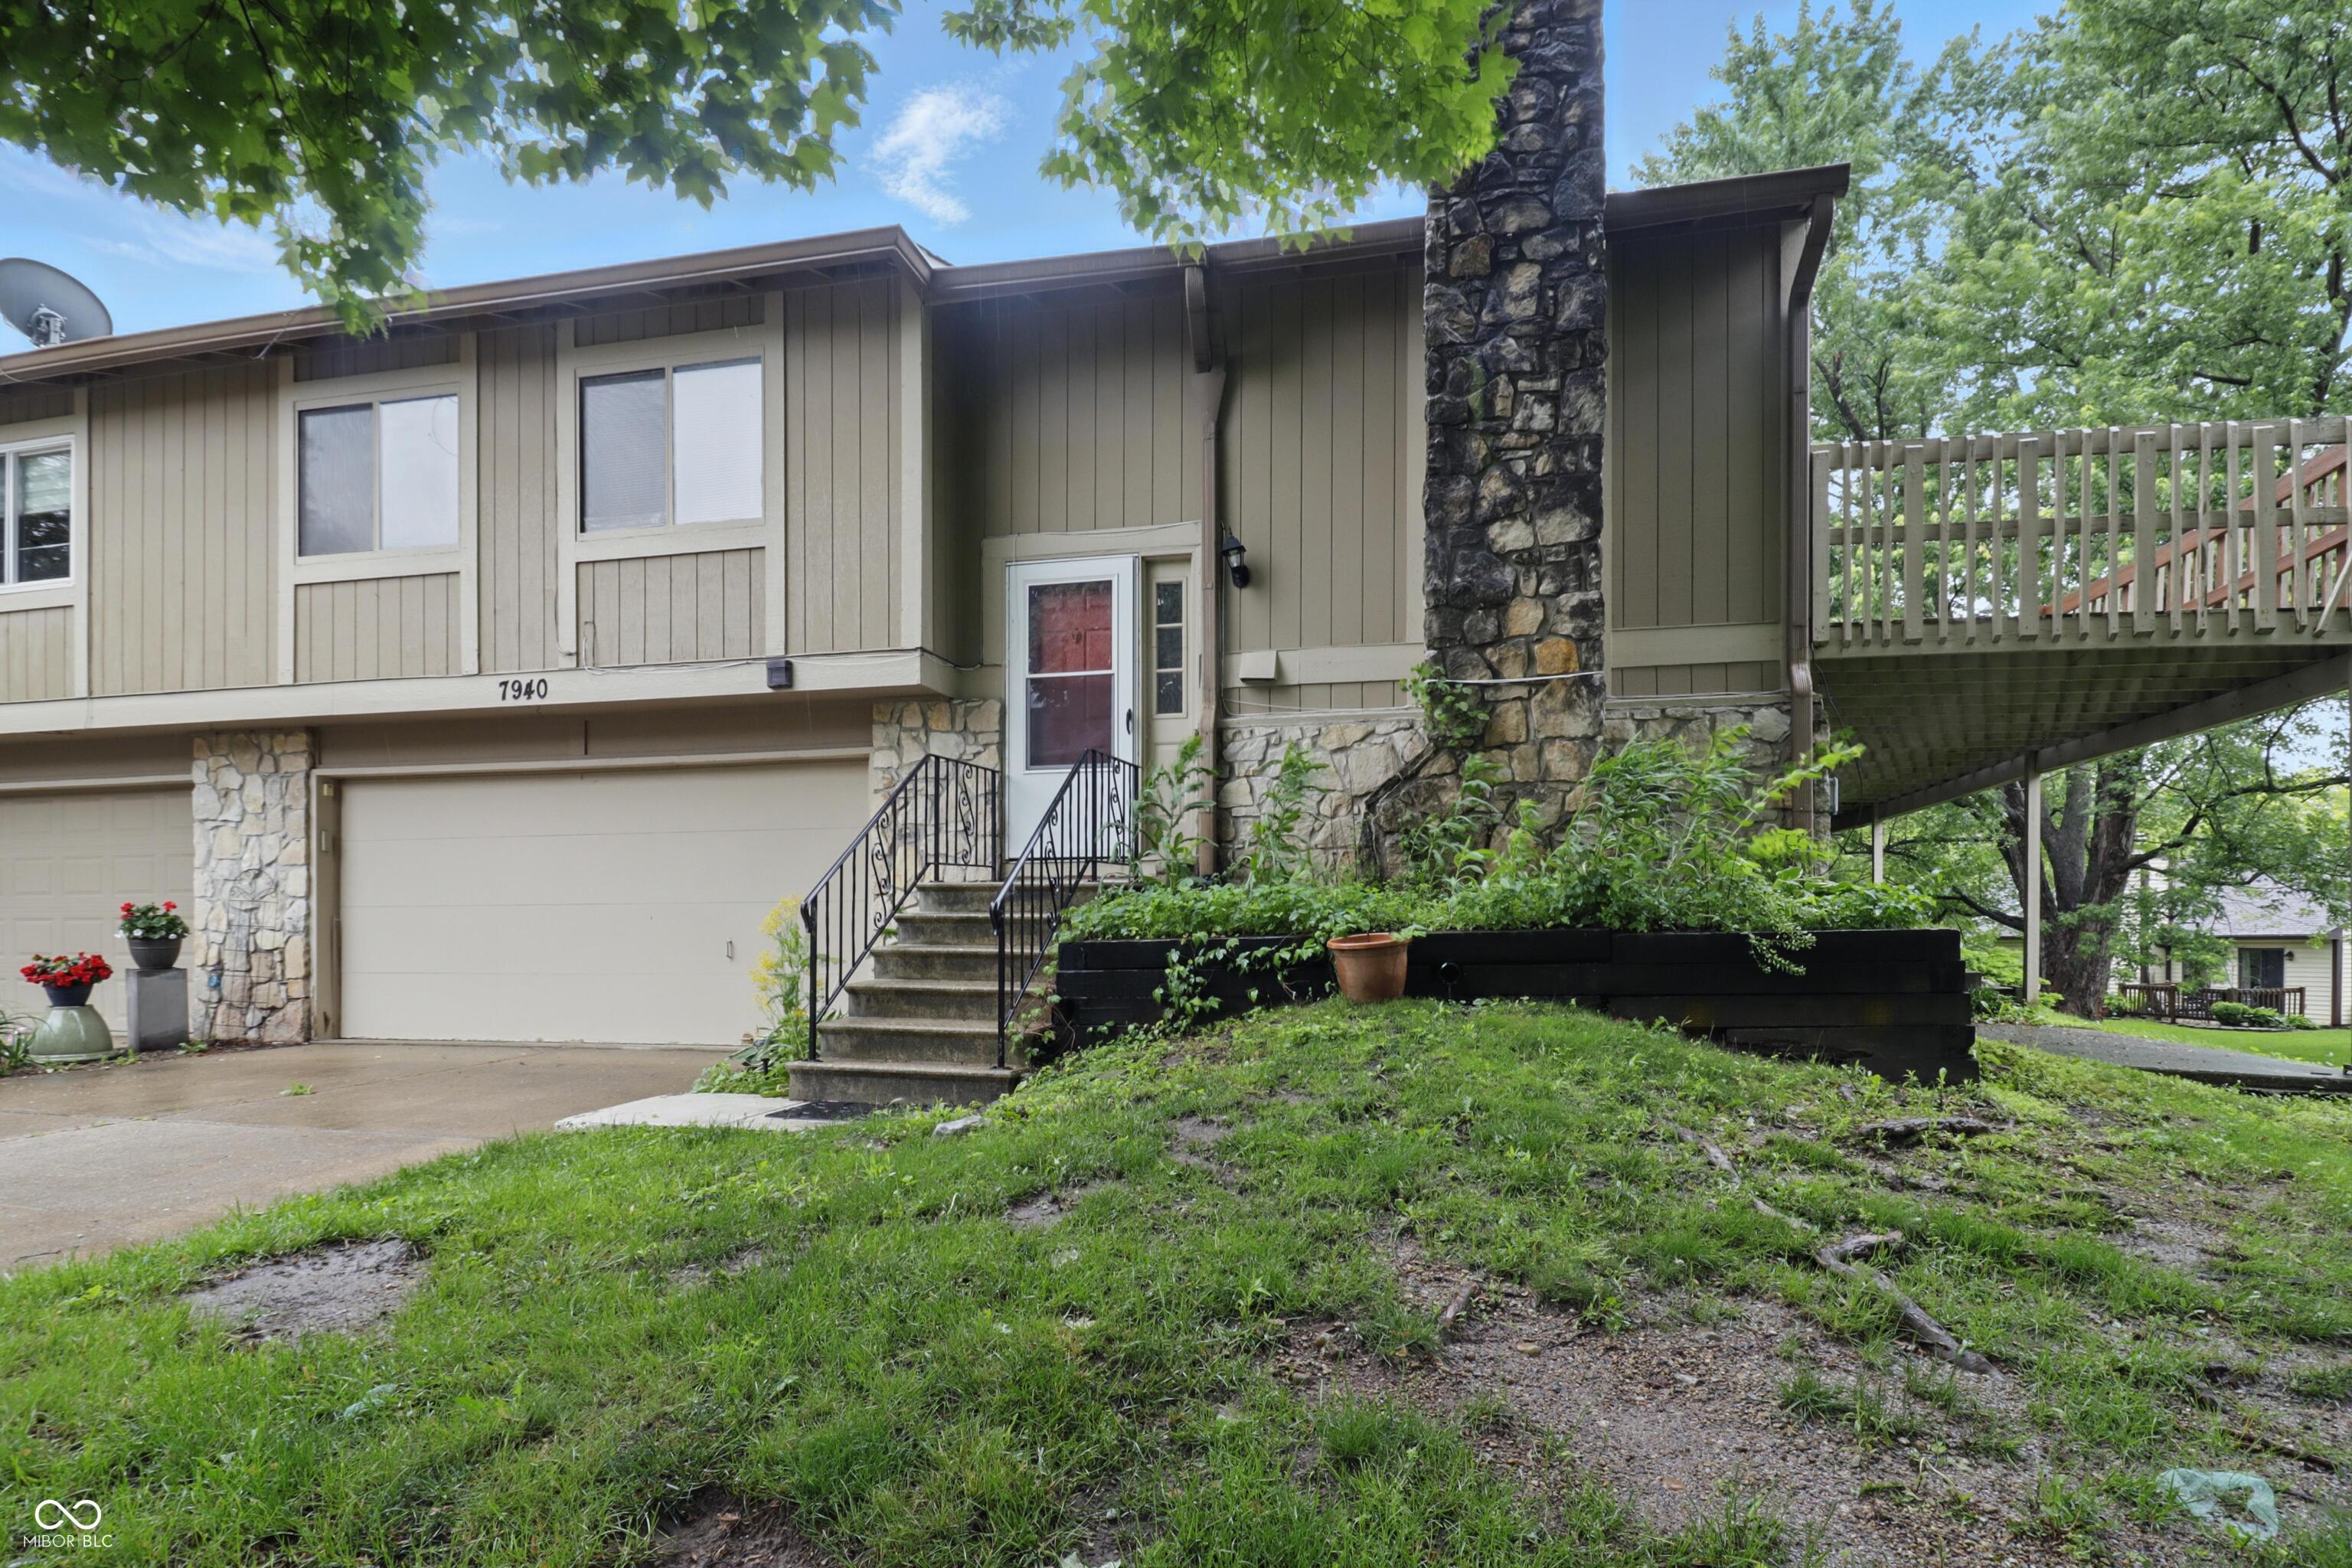
Pending
$182,500
2
bds
|
2
ba
|
2,016
sqft
|
built
1981
7940 Sunfield Ct, Indianapolis, IN 46214
$58
Cash flow
1.7%
Cash-on-Cash Return
6.7%
Cap rate
1.0%
Rent to Value Ratio
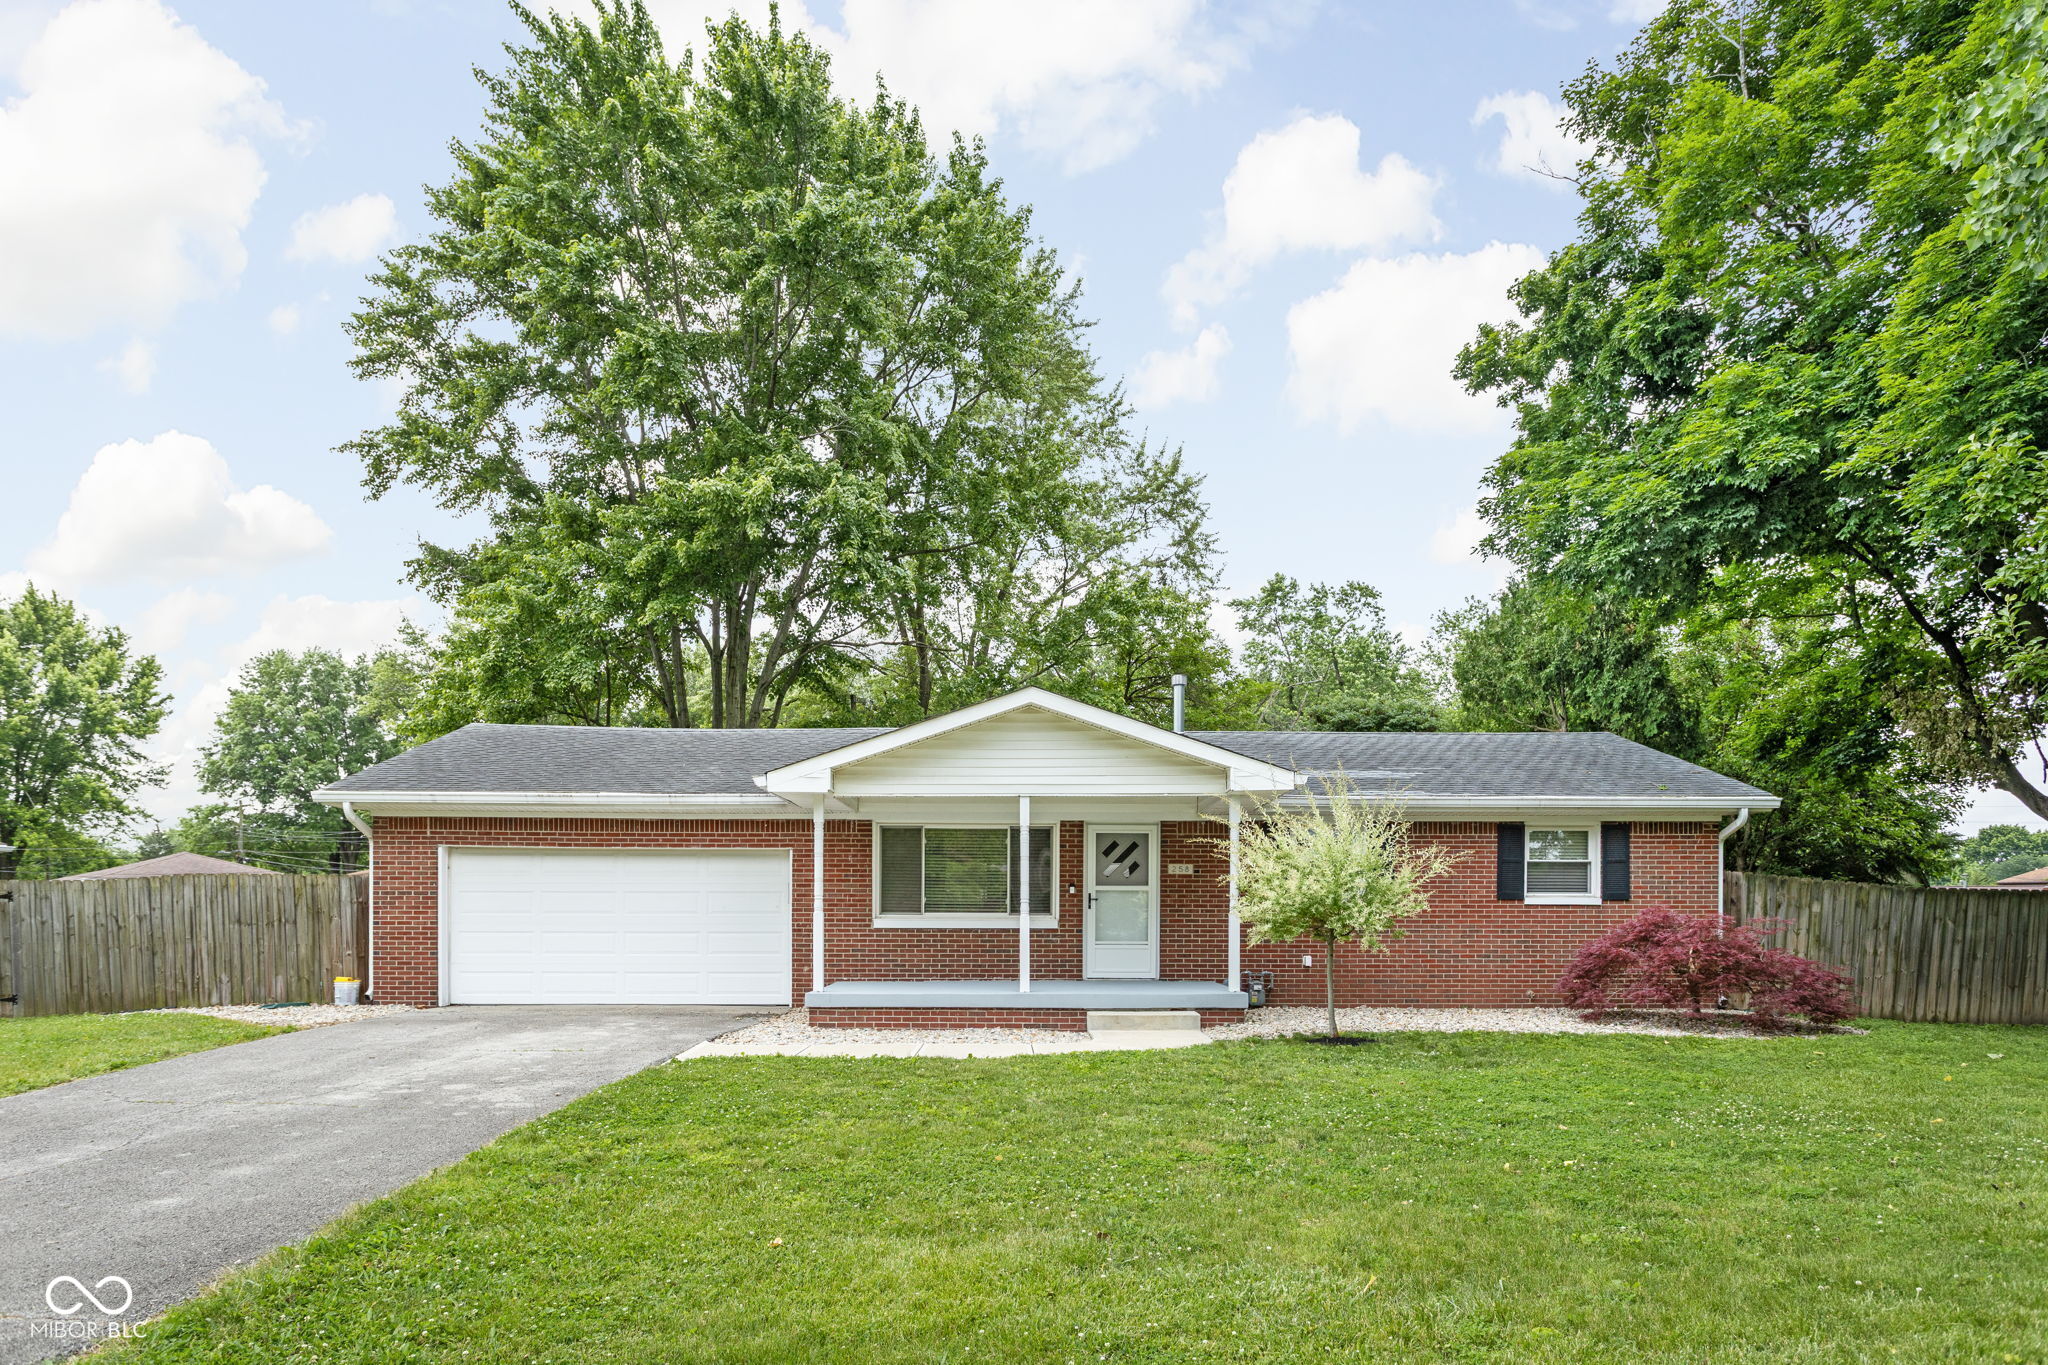
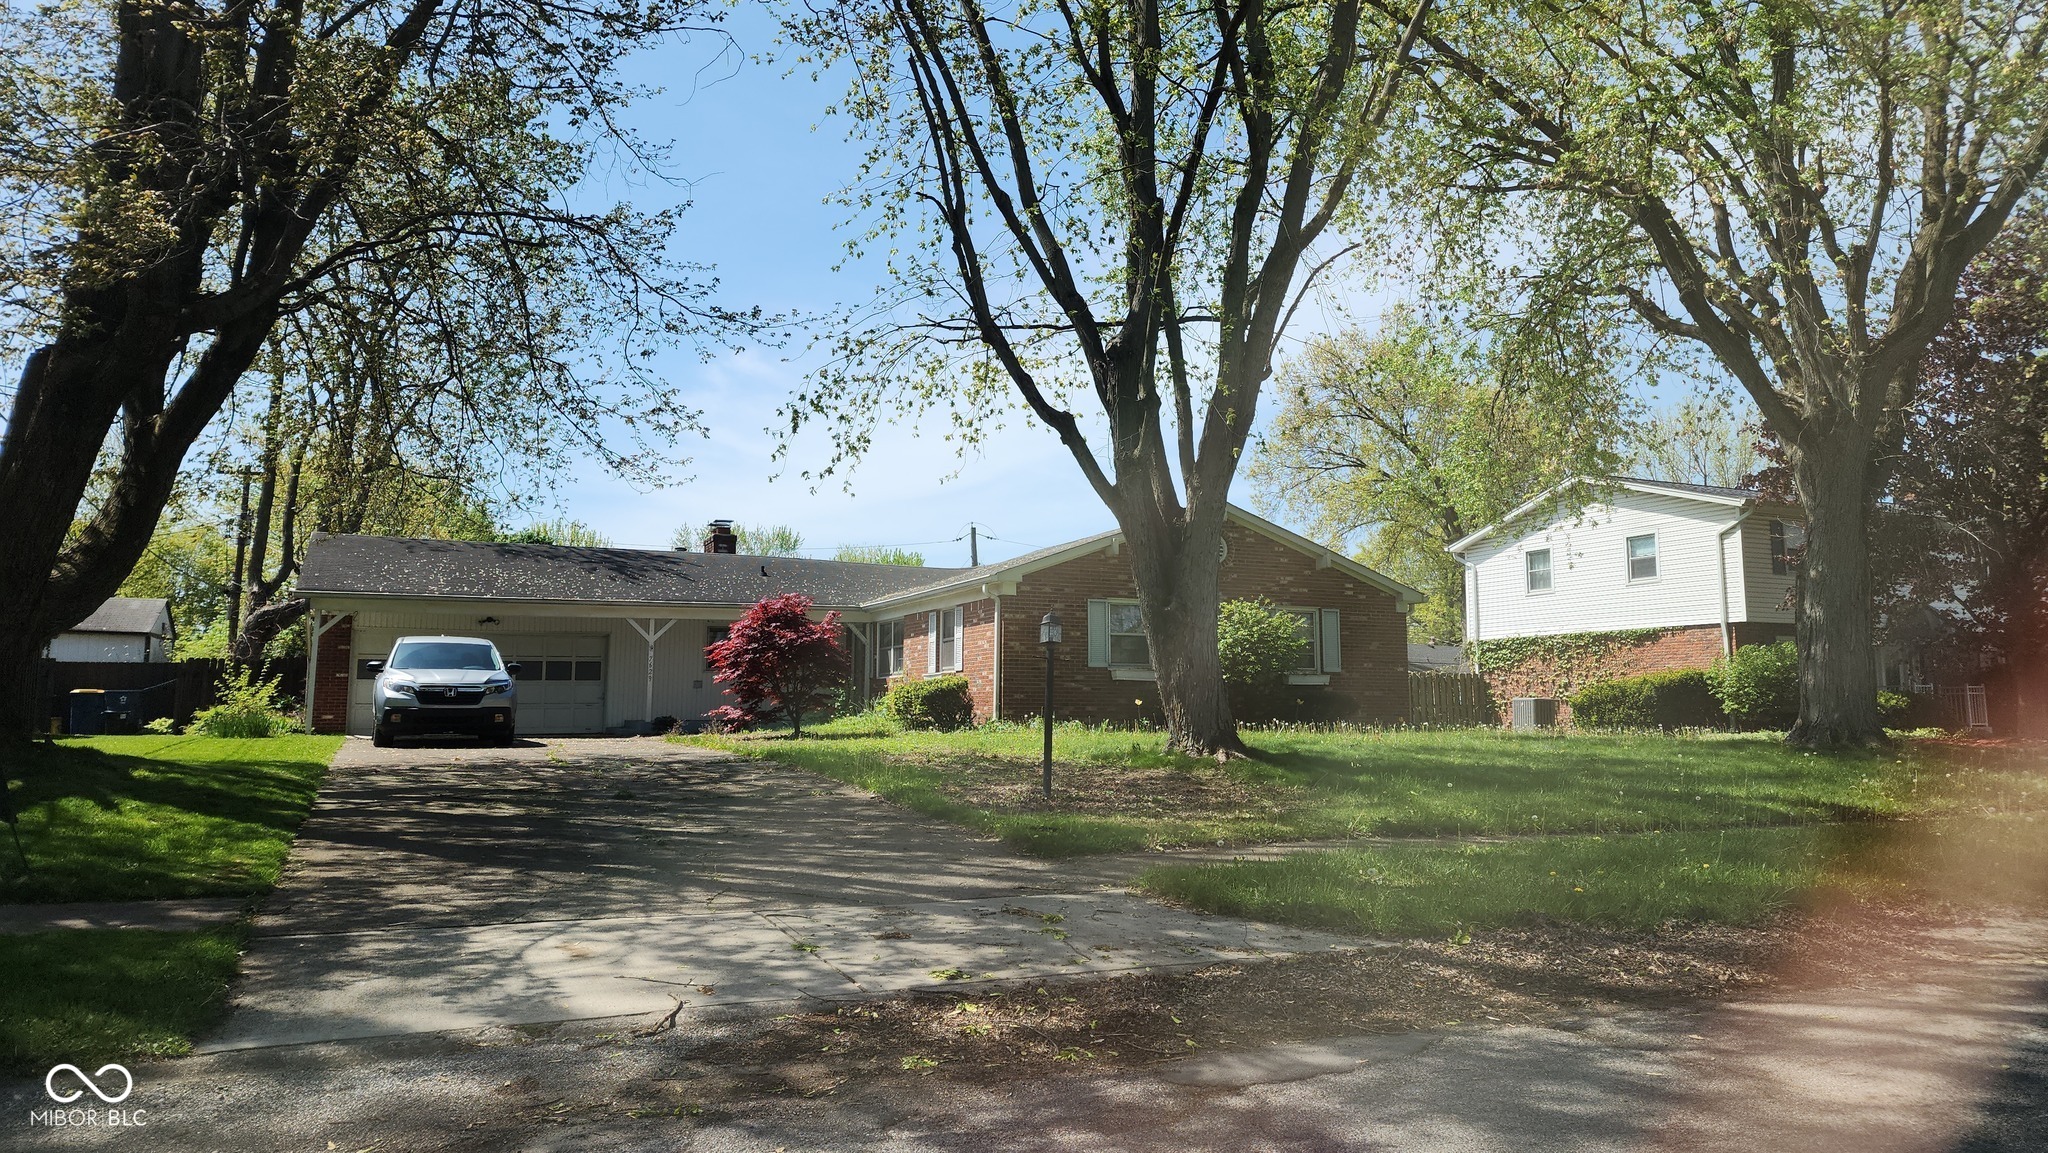
Active
$245,000
3
bds
|
1
ba
|
1,038
sqft
|
built
1959
258 N Green Springs Rd, Indianapolis, IN 46214
$-41
Cash flow
-0.9%
Cash-on-Cash Return
6.1%
Cap rate
0.7%
Rent to Value Ratio
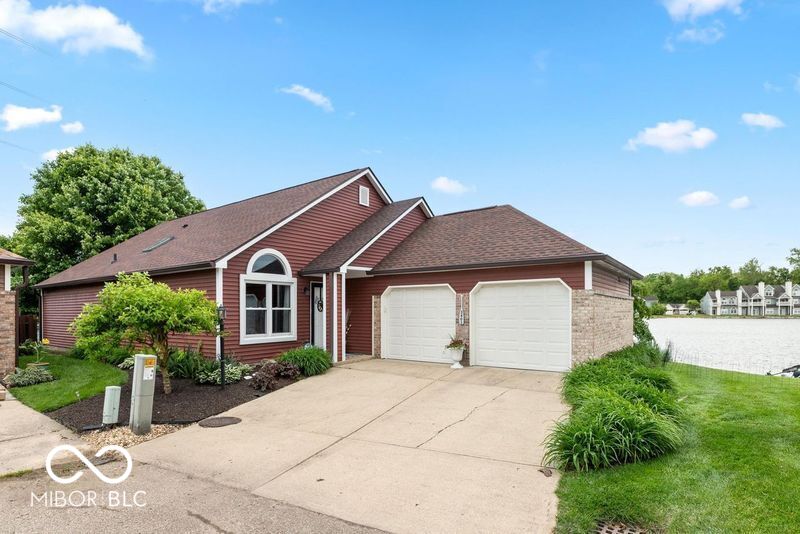
Active
$419,000
2
bds
|
2
ba
|
1,416
sqft
|
built
1990
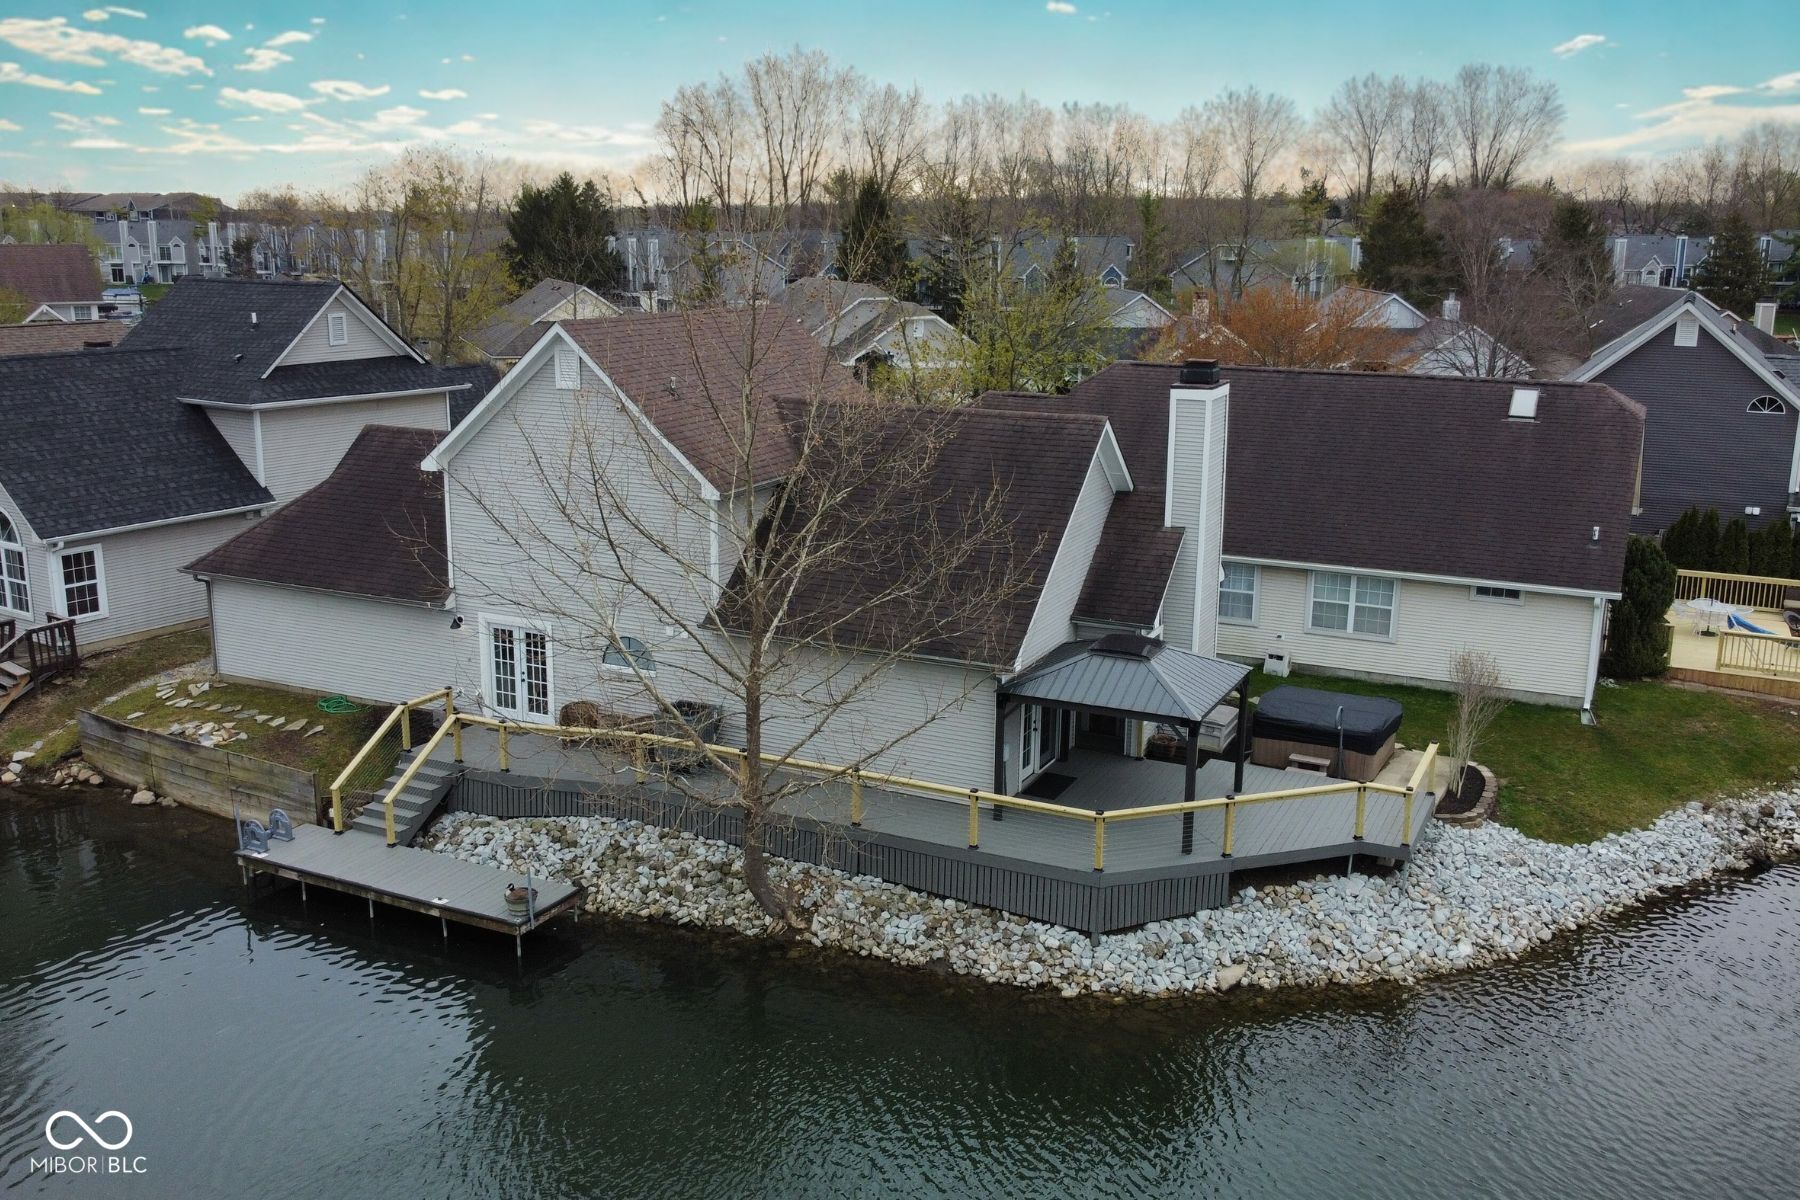
3403 Island Way, Indianapolis, IN 46214
$-986
Cash flow
-12.3%
Cash-on-Cash Return
3.5%
Cap rate
0.4%
Rent to Value Ratio
Active
$239,900
3
bds
|
2
ba
|
1,984
sqft
|
built
1969
1619 Crest Ct, Indianapolis, IN 46214
$-14
Cash flow
-0.3%
Cash-on-Cash Return
6.2%
Cap rate
0.8%
Rent to Value Ratio
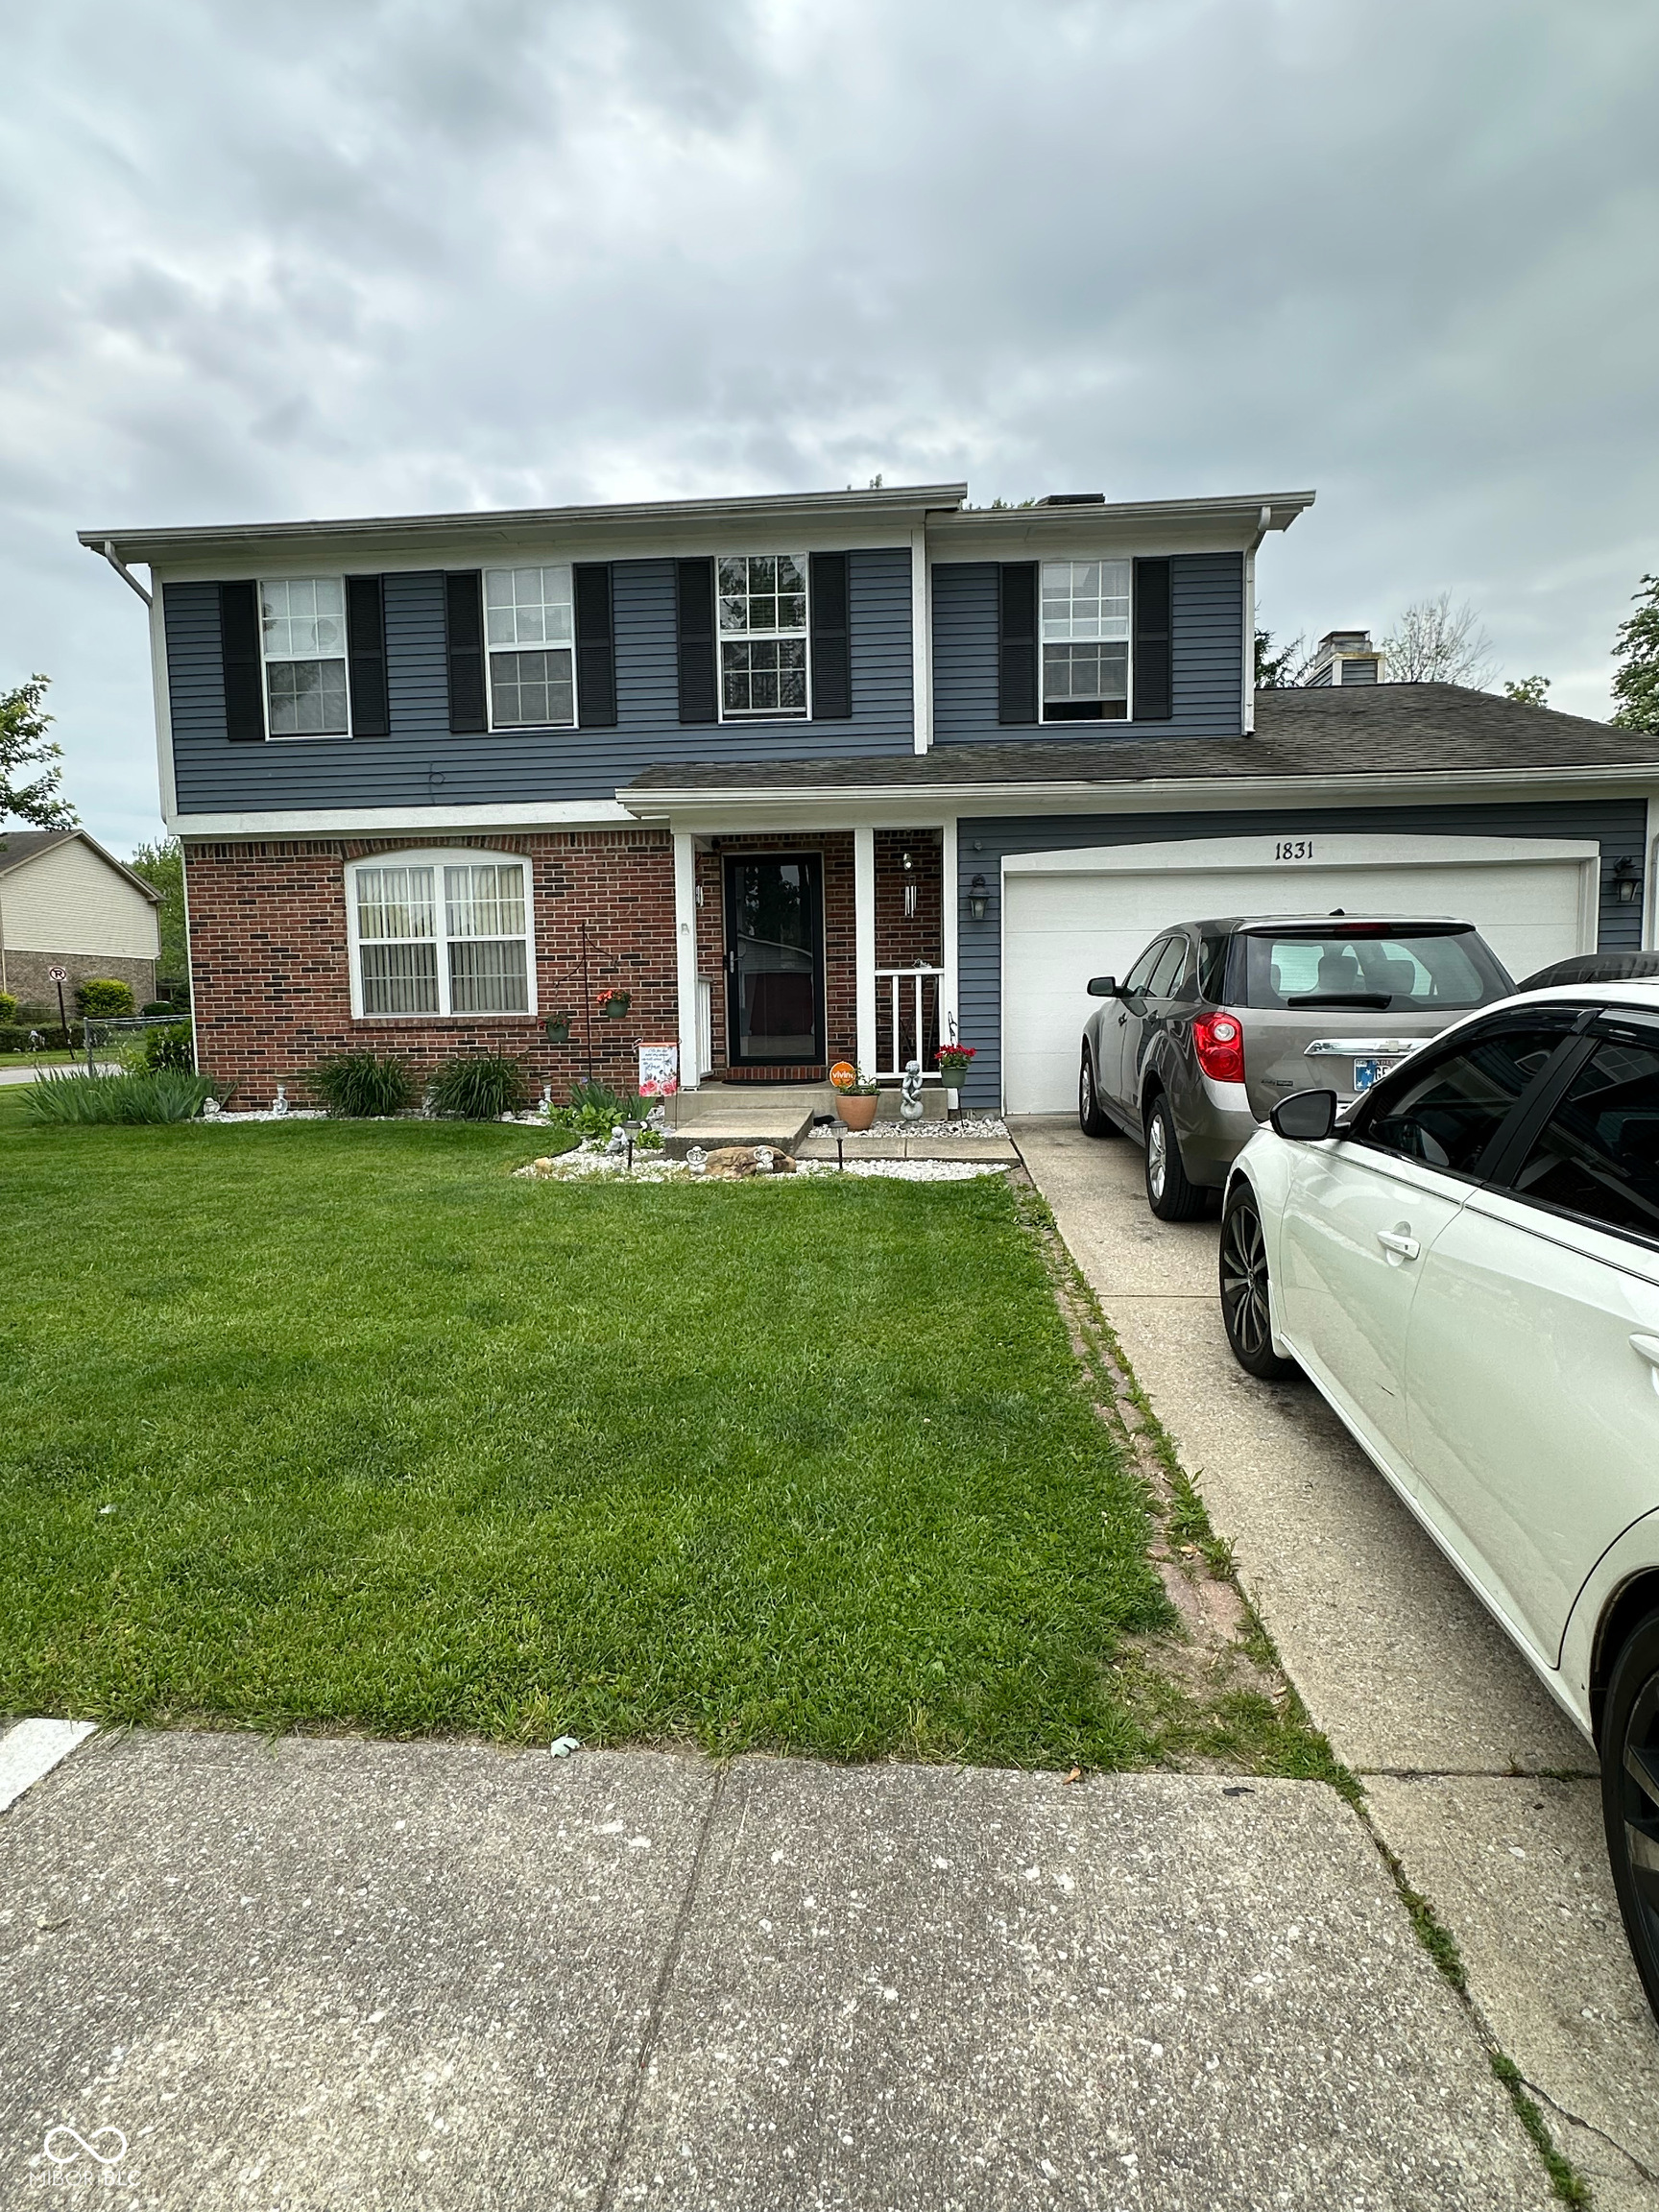
Active
$289,900
4
bds
|
4
ba
|
1,738
sqft
|
built
1990
1831 Beckenbauer Ln, Indianapolis, IN 46214
$-138
Cash flow
-2.5%
Cash-on-Cash Return
5.7%
Cap rate
0.7%
Rent to Value Ratio
Active
$295,000
4
bds
|
3
ba
|
2,024
sqft
|
built
1965
6801 Shalimar Ct, Indianapolis, IN 46214
$-165
Cash flow
-2.9%
Cash-on-Cash Return
5.6%
Cap rate
0.7%
Rent to Value Ratio