46217 Investment Properties for Sale
Browse homes for sale and investment properties in 46217. Refine your search by price, property type, or more.
Best cash flowing properties in 46217
Active
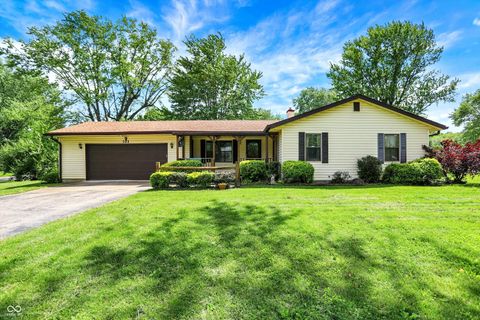
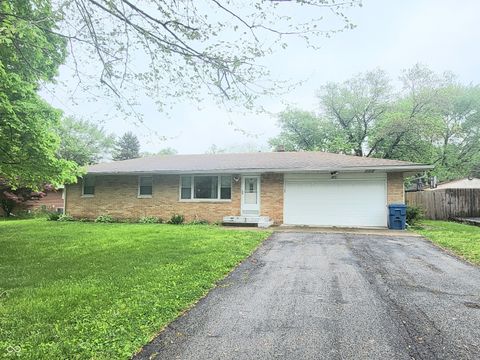
$269,900
4
bds
|
2
ba
|
1,732
sqft
|
built
1974
8231 Trevellian Way, Indianapolis, IN 46217
$-33
Cash flow
-0.6%
Cash-on-Cash Return
6.1%
Cap rate
0.7%
Rent to Value Ratio
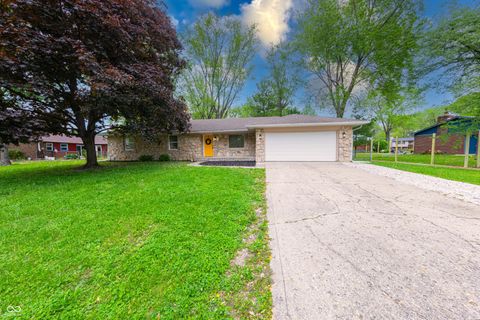
Active
$220,000
3
bds
|
1
ba
|
1,168
sqft
|
built
1955
101 Heiny Rd, Indianapolis, IN 46217
$-114
Cash flow
-2.7%
Cash-on-Cash Return
5.6%
Cap rate
0.7%
Rent to Value Ratio
65 out of 67 properties for sale in 46217
Limited Results Shown
Create a free account, or log in to reveal all property listings and enjoy the complete experience.
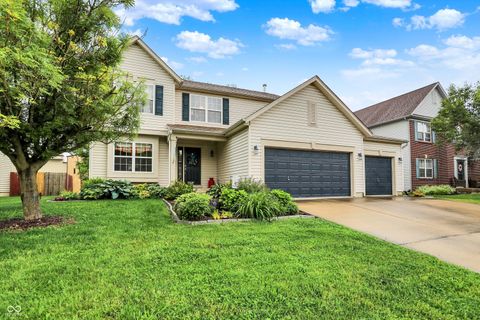
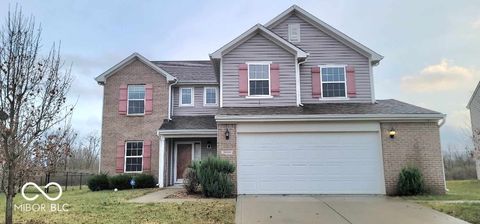
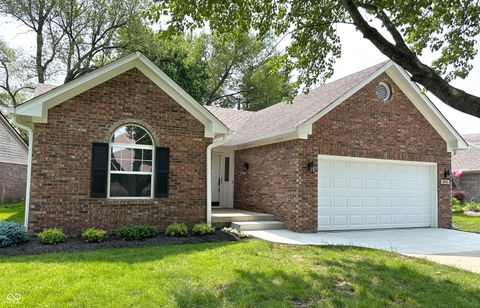
Active
$325,000
4
bds
|
3
ba
|
2,178
sqft
|
built
2001
2623 Senators Way, Indianapolis, IN 46217
$-479
Cash flow
-7.7%
Cash-on-Cash Return
4.5%
Cap rate
0.6%
Rent to Value Ratio
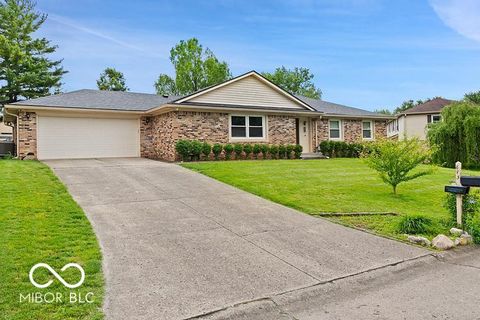
Active
$220,000
3
bds
|
1
ba
|
1,168
sqft
|
built
1955
101 Heiny Rd, Indianapolis, IN 46217
$-114
Cash flow
-2.7%
Cash-on-Cash Return
5.6%
Cap rate
0.7%
Rent to Value Ratio
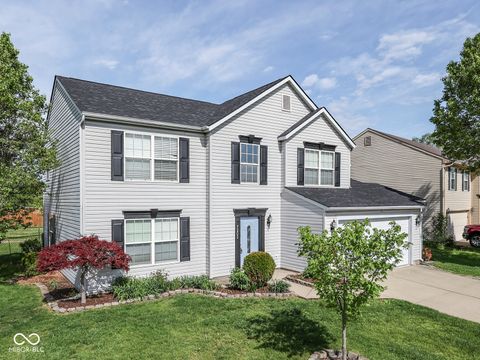
Active
$310,000
3
bds
|
2
ba
|
1,806
sqft
|
built
1974
813 Boulder Rd, Indianapolis, IN 46217
$-334
Cash flow
-5.6%
Cash-on-Cash Return
5.0%
Cap rate
0.6%
Rent to Value Ratio
Active
$320,000
4
bds
|
3
ba
|
2,099
sqft
|
built
2016
3801 Boundary Bay Dr, Indianapolis, IN 46217
$-329
Cash flow
-5.4%
Cash-on-Cash Return
5.0%
Cap rate
0.6%
Rent to Value Ratio
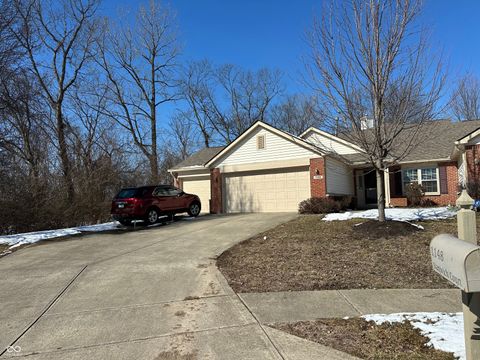
Active
$235,000
3
bds
|
3
ba
|
1,977
sqft
|
built
2001
1148 Nanwich Ct, Indianapolis, IN 46217
$-265
Cash flow
-5.9%
Cash-on-Cash Return
4.9%
Cap rate
0.8%
Rent to Value Ratio
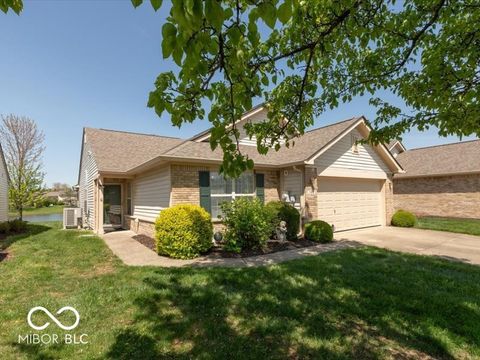
Active
$239,900
2
bds
|
2
ba
|
1,614
sqft
|
built
2001
1108 Nanwich Ct, Indianapolis, IN 46217
$-330
Cash flow
-7.2%
Cash-on-Cash Return
4.6%
Cap rate
0.7%
Rent to Value Ratio
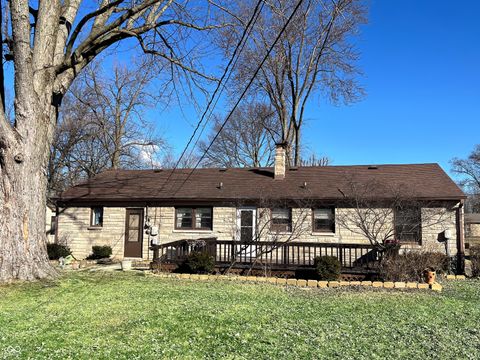
Active
$259,999
3
bds
|
2
ba
|
1,740
sqft
|
built
1954
327 Maxwell Rd, Indianapolis, IN 46217
$-184
Cash flow
-3.7%
Cash-on-Cash Return
5.4%
Cap rate
0.7%
Rent to Value Ratio
Active
$249,900
3
bds
|
2
ba
|
1,201
sqft
|
built
1959
7109 Chandler Dr, Indianapolis, IN 46217
$-270
Cash flow
-5.6%
Cash-on-Cash Return
5.0%
Cap rate
0.6%
Rent to Value Ratio
Active
$299,000
4
bds
|
2
ba
|
1,610
sqft
|
built
1975
444 Buffalo Dr, Indianapolis, IN 46217
$-319
Cash flow
-5.6%
Cash-on-Cash Return
5.0%
Cap rate
0.6%
Rent to Value Ratio

Active
$369,000
3
bds
|
4
ba
|
3,326
sqft
|
built
1956
614 Debra Ln, Indianapolis, IN 46217
$-822
Cash flow
-11.6%
Cash-on-Cash Return
3.6%
Cap rate
0.4%
Rent to Value Ratio
Active
$299,900
3
bds
|
2
ba
|
1,311
sqft
|
built
1993
6845 Arjay Dr, Indianapolis, IN 46217
$-529
Cash flow
-9.2%
Cash-on-Cash Return
4.1%
Cap rate
0.5%
Rent to Value Ratio
Active
$314,900
4
bds
|
3
ba
|
2,289
sqft
|
built
1999
7202 Red Lake Ct, Indianapolis, IN 46217
$-573
Cash flow
-9.5%
Cash-on-Cash Return
4.1%
Cap rate
0.5%
Rent to Value Ratio
Active
$330,000
4
bds
|
3
ba
|
2,151
sqft
|
built
1976
8835 Winding Ridge Rd, Indianapolis, IN 46217
$-205
Cash flow
-3.2%
Cash-on-Cash Return
5.5%
Cap rate
0.7%
Rent to Value Ratio
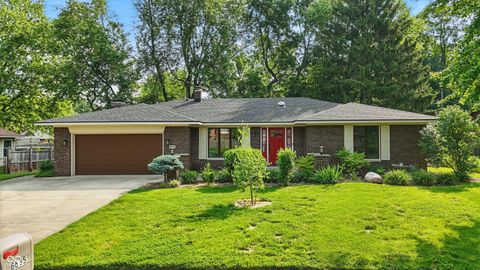
Active
$294,900
4
bds
|
3
ba
|
2,132
sqft
|
built
1991
8506 Friendship Ln, Indianapolis, IN 46217
$-298
Cash flow
-5.3%
Cash-on-Cash Return
5.1%
Cap rate
0.6%
Rent to Value Ratio
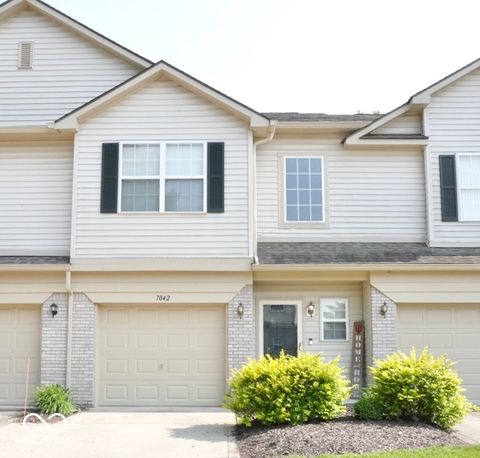
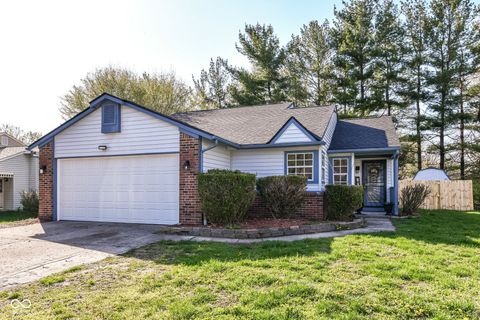
Active
$199,500
2
bds
|
3
ba
|
1,304
sqft
|
built
2001
7042 Gavin Dr, Indianapolis, IN 46217
$-233
Cash flow
-6.1%
Cash-on-Cash Return
4.9%
Cap rate
0.8%
Rent to Value Ratio
Active
$449,000
3
bds
|
2
ba
|
1,977
sqft
|
built
1978
8635 Bishops Ln, Indianapolis, IN 46217
$-1,102
Cash flow
-12.8%
Cash-on-Cash Return
3.3%
Cap rate
0.4%
Rent to Value Ratio

Active
$260,000
3
bds
|
2
ba
|
1,304
sqft
|
built
2003
7307 Barnwell Pl, Indianapolis, IN 46217
$-204
Cash flow
-4.1%
Cash-on-Cash Return
5.3%
Cap rate
0.7%
Rent to Value Ratio
Active
$267,500
2
bds
|
2
ba
|
1,594
sqft
|
built
2002
7357 Lake Lakota Dr, Indianapolis, IN 46217
$-470
Cash flow
-9.2%
Cash-on-Cash Return
4.2%
Cap rate
0.7%
Rent to Value Ratio

Active
$256,750
3
bds
|
2
ba
|
1,368
sqft
|
built
2016
914 Baden Manor Dr, Indianapolis, IN 46217
$-197
Cash flow
-4.0%
Cash-on-Cash Return
5.3%
Cap rate
0.7%
Rent to Value Ratio

Active
$899,900
4
bds
|
5
ba
|
5,292
sqft
|
built
2018
7648 Killarney Dr, Indianapolis, IN 46217
$-2,795
Cash flow
-16.2%
Cash-on-Cash Return
2.5%
Cap rate
0.3%
Rent to Value Ratio

Active
$485,000
6
bds
|
5
ba
|
3,608
sqft
|
built
1973
660 Sun Valley Ct, Indianapolis, IN 46217
$-1,152
Cash flow
-12.4%
Cash-on-Cash Return
3.4%
Cap rate
0.4%
Rent to Value Ratio

Pending
$239,900
3
bds
|
3
ba
|
1,548
sqft
|
built
1999
621 Meadows Edge Ln, Indianapolis, IN 46217
$-166
Cash flow
-3.6%
Cash-on-Cash Return
5.4%
Cap rate
0.7%
Rent to Value Ratio

Pending
$535,000
6
bds
|
5
ba
|
5,621
sqft
|
built
2008
2912 Tuscarora Ln, Indianapolis, IN 46217
$-135
Cash flow
-1.3%
Cash-on-Cash Return
6.0%
Cap rate
0.7%
Rent to Value Ratio

Active
$359,900
4
bds
|
2
ba
|
2,544
sqft
|
built
2014
3311 Stoddard Pl, Indianapolis, IN 46217
$-409
Cash flow
-5.9%
Cash-on-Cash Return
4.9%
Cap rate
0.6%
Rent to Value Ratio
Active
$269,900
4
bds
|
2
ba
|
1,732
sqft
|
built
1974
8231 Trevellian Way, Indianapolis, IN 46217
$-33
Cash flow
-0.6%
Cash-on-Cash Return
6.1%
Cap rate
0.7%
Rent to Value Ratio