46217 Investment Properties for Sale
Browse homes for sale and investment properties in 46217. Refine your search by price, property type, or more.
Best cash flowing properties in 46217
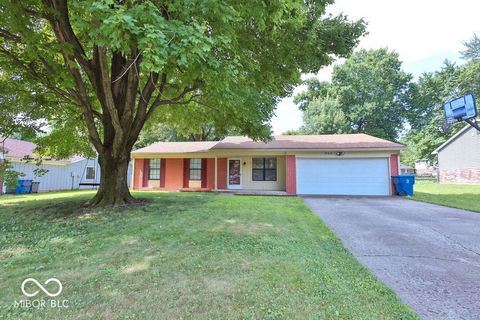
Active
$150,000
3
bds
|
1
ba
|
1,248
sqft
|
built
1964
6349 S Harding St, Indianapolis, IN 46217
$267
Cash flow
9.3%
Cash-on-Cash Return
8.3%
Cap rate
1.0%
Rent to Value Ratio

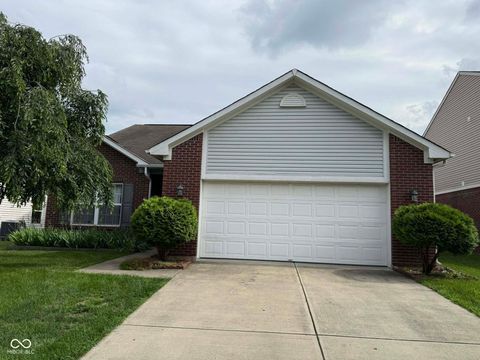
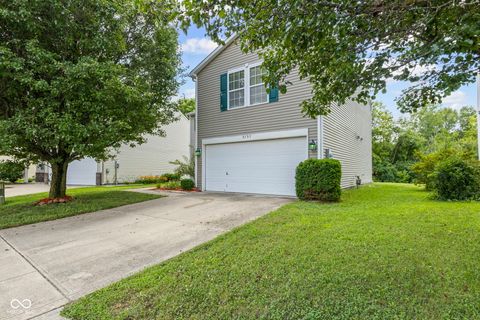
Active
$209,900
3
bds
|
3
ba
|
1,368
sqft
|
built
2001
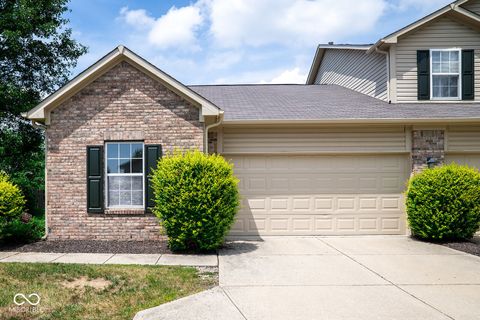
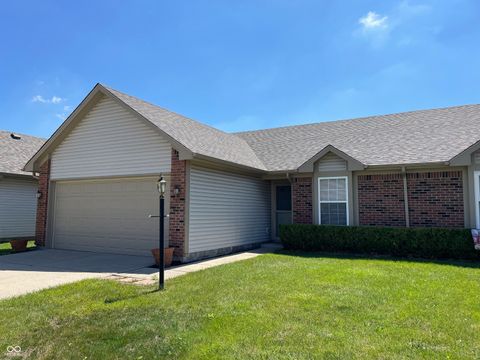
6534 Redland Way, Indianapolis, IN 46217
$10
Cash flow
0.2%
Cash-on-Cash Return
6.2%
Cap rate
0.8%
Rent to Value Ratio
66 out of 69 properties for sale in 46217
Limited Results Shown
Create a free account, or log in to reveal all property listings and enjoy the complete experience.
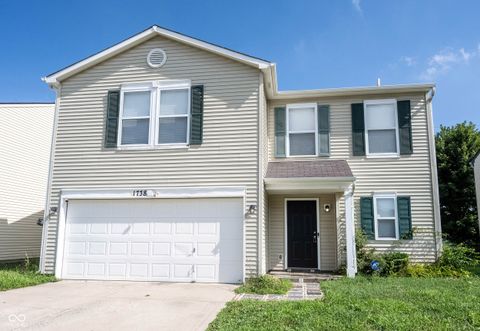
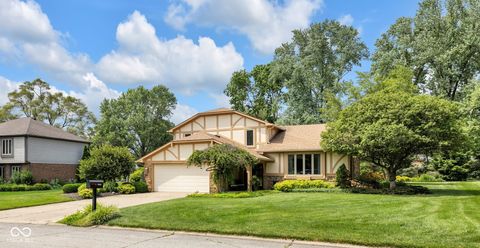
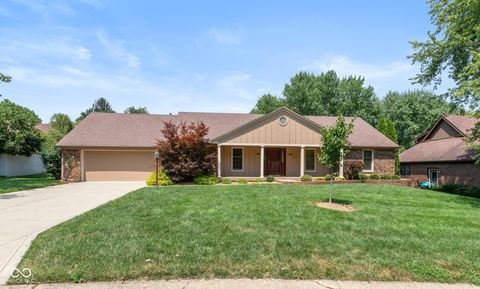
Active
$270,000
4
bds
|
3
ba
|
2,154
sqft
|
built
2002
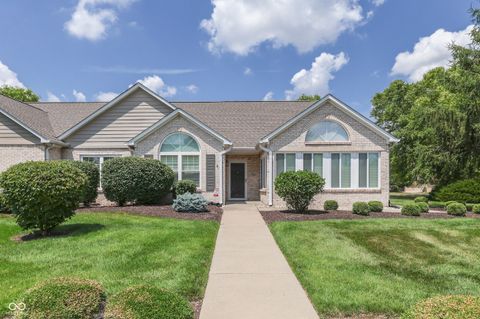
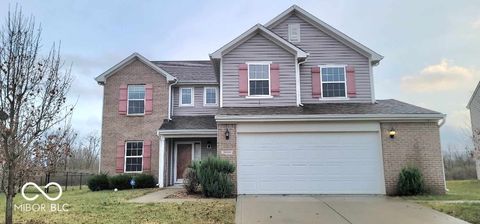
1738 Sonesta Way, Indianapolis, IN 46217
$-162
Cash flow
-3.1%
Cash-on-Cash Return
5.4%
Cap rate
0.7%
Rent to Value Ratio
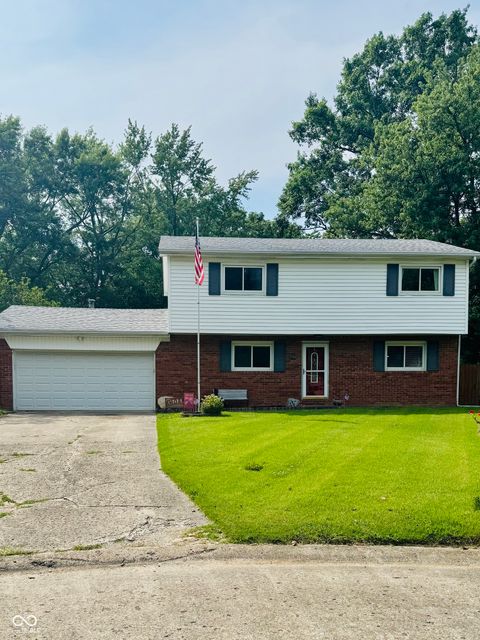
Active
$425,000
4
bds
|
3
ba
|
2,602
sqft
|
built
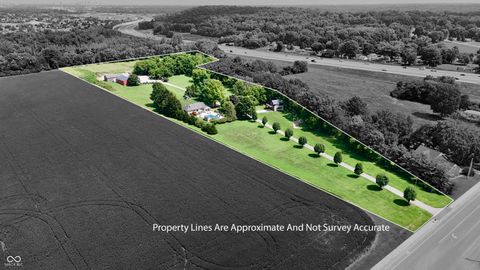
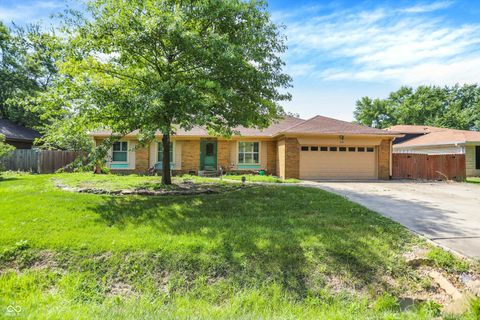
1975
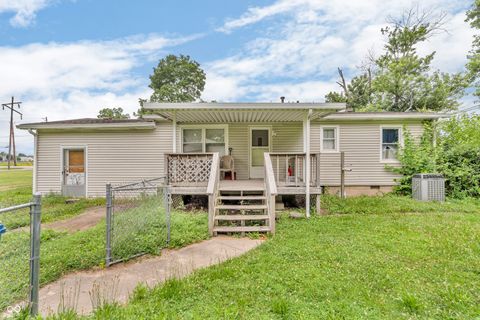
1637 Towe String Rd, Indianapolis, IN 46217
$-797
Cash flow
-9.8%
Cash-on-Cash Return
3.9%
Cap rate
0.5%
Rent to Value Ratio
Active
$259,900
4
bds
|
2
ba
|
1,956
sqft
|
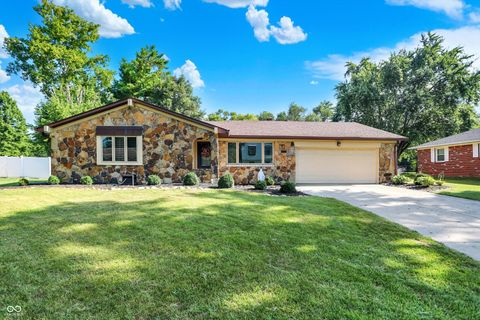
built
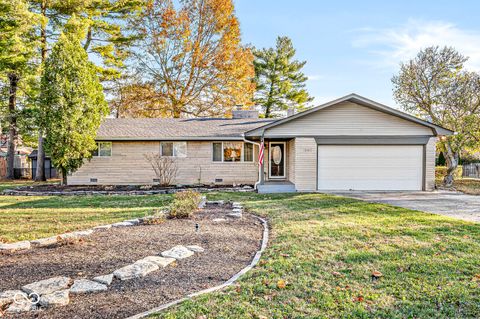
1982
7834 Burr Oak Ct, Indianapolis, IN 46217
$-227
Cash flow
-4.6%
Cash-on-Cash Return
5.1%
Cap rate
0.6%
Rent to Value Ratio
Active
$275,000
3
bds
|
2
ba
|
1,480
sqft
|
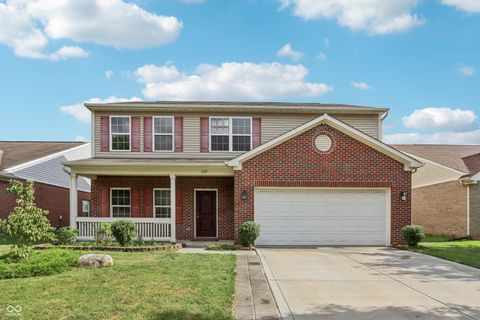
built
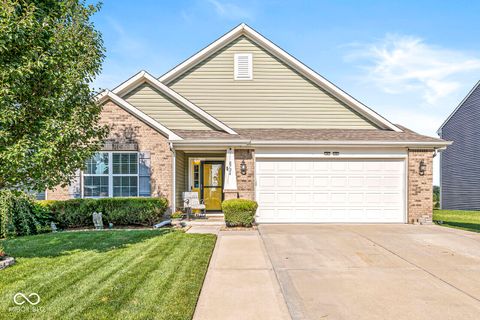
2011
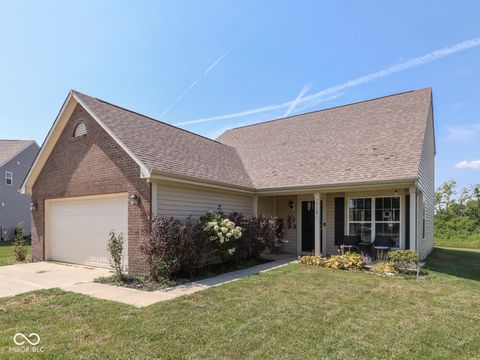
621 Appleseed Dr, Indianapolis, IN 46217
$-198
Cash flow
-3.8%
Cash-on-Cash Return
5.3%
Cap rate
0.7%
Rent to Value Ratio
Active
$415,000
4
bds
|
3
ba
|
2,492
sqft
|
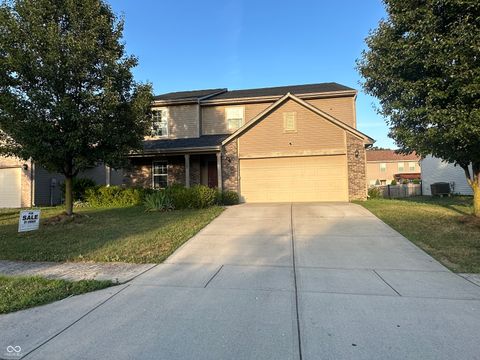
built
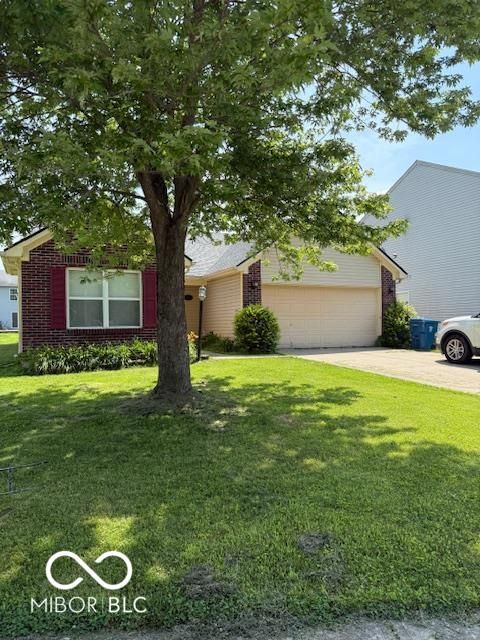
1977
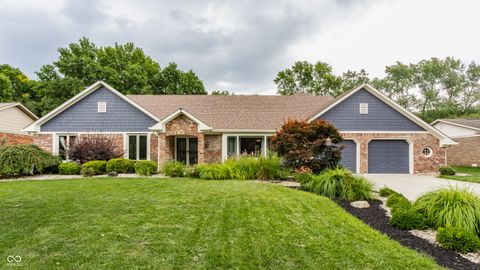
8525 Winding Ridge Rd, Indianapolis, IN 46217
$-202
Cash flow
-2.5%
Cash-on-Cash Return
5.6%
Cap rate
0.7%
Rent to Value Ratio

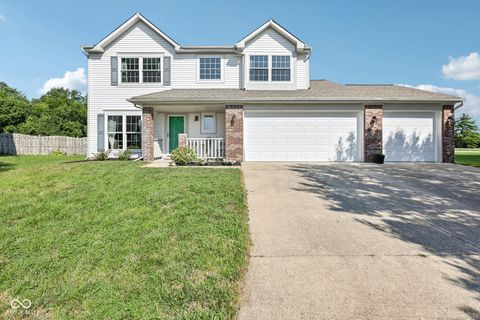
Active
$299,000
4
bds
|
3
ba
|
2,036
sqft
|
built
2000
6608 Sonesta Dr, Indianapolis, IN 46217
$-194
Cash flow
-3.4%
Cash-on-Cash Return
5.4%
Cap rate
0.7%
Rent to Value Ratio
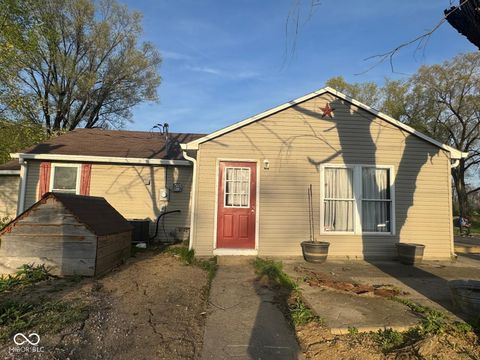
Active
$269,900
3
bds
|
1
ba
|
1,384
sqft
|
built
1925
2931 Byrkit St, Indianapolis, IN 46217
$-417
Cash flow
-8.1%
Cash-on-Cash Return
4.3%
Cap rate
0.5%
Rent to Value Ratio
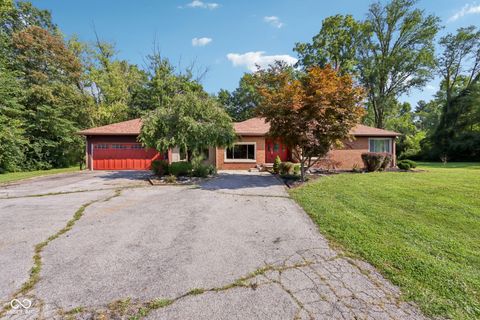
Active
$340,000
3
bds
|
2
ba
|
1,594
sqft
|
built
1942
400 W Southport Rd, Indianapolis, IN 46217
$-362
Cash flow
-5.6%
Cash-on-Cash Return
4.9%
Cap rate
0.6%
Rent to Value Ratio
Active
$199,000
2
bds
|
2
ba
|
1,118
sqft
|
built
2005
7226 Wyatt Ln, Indianapolis, IN 46217
$-348
Cash flow
-9.1%
Cash-on-Cash Return
4.0%
Cap rate
0.7%
Rent to Value Ratio
Active
$259,900
3
bds
|
2
ba
|
1,699
sqft
|
built
2000
7304 Lake Lakota Pl, Indianapolis, IN 46217
$-488
Cash flow
-9.8%
Cash-on-Cash Return
3.9%
Cap rate
0.7%
Rent to Value Ratio
Active
$300,000
3
bds
|
3
ba
|
2,072
sqft
|
built
2001
3175 Delaway Ln, Indianapolis, IN 46217
$-290
Cash flow
-5.0%
Cash-on-Cash Return
5.0%
Cap rate
0.7%
Rent to Value Ratio
Active
$290,000
3
bds
|
3
ba
|
2,340
sqft
|
built
2000
6656 Sonesta Dr, Indianapolis, IN 46217
$-265
Cash flow
-4.8%
Cash-on-Cash Return
5.1%
Cap rate
0.6%
Rent to Value Ratio
Active
$1,450,000
5
bds
|
4
ba
|
3,382
sqft
|
built
1984
2780 Wicker Rd, Indianapolis, IN 46217
$-5,427
Cash flow
-19.5%
Cash-on-Cash Return
1.7%
Cap rate
0.2%
Rent to Value Ratio
Active
$299,900
3
bds
|
2
ba
|
1,588
sqft
|
built
1966
8201 Linda Leigh Ln, Indianapolis, IN 46217
$-156
Cash flow
-2.7%
Cash-on-Cash Return
5.5%
Cap rate
0.7%
Rent to Value Ratio
Active
$329,900
3
bds
|
2
ba
|
1,804
sqft
|
built
2017
8724 Stoddard Ln, Indianapolis, IN 46217
$-368
Cash flow
-5.8%
Cash-on-Cash Return
4.8%
Cap rate
0.6%
Rent to Value Ratio

Active
$194,900
2
bds
|
3
ba
|
1,386
sqft
|
built
2000
7042 Tyler Ln, Indianapolis, IN 46217
$-189
Cash flow
-5.1%
Cash-on-Cash Return
5.0%
Cap rate
0.8%
Rent to Value Ratio
Active
$229,500
3
bds
|
2
ba
|
1,455
sqft
|
built
2001
8113 Maple Stream Ln, Indianapolis, IN 46217
$-90
Cash flow
-2.0%
Cash-on-Cash Return
5.7%
Cap rate
0.7%
Rent to Value Ratio
Active
$280,000
3
bds
|
3
ba
|
1,711
sqft
|
built
1970
639 W Banta Rd, Indianapolis, IN 46217
$-221
Cash flow
-4.1%
Cash-on-Cash Return
5.2%
Cap rate
0.6%
Rent to Value Ratio
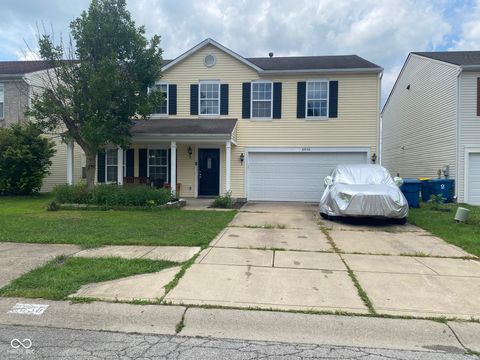
Active
$329,900
4
bds
|
2
ba
|
1,704
sqft
|
built
1973
830 Yosemite Dr, Indianapolis, IN 46217
$-477
Cash flow
-7.5%
Cash-on-Cash Return
4.4%
Cap rate
0.5%
Rent to Value Ratio
Active
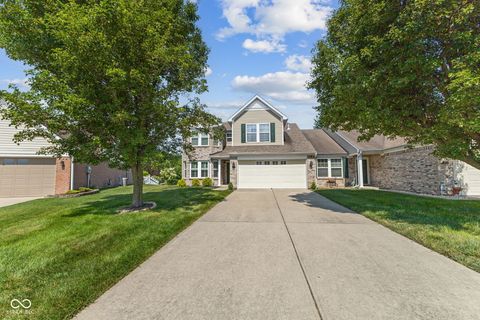
$330,000
4
bds
|
3
ba
|
2,391
sqft
|
built
2012
627 Appleseed Dr, Indianapolis, IN 46217
$-341
Cash flow
-5.4%
Cash-on-Cash Return
4.9%
Cap rate
0.6%
Rent to Value Ratio
Active
$380,000
5
bds
|
4
ba
|
3,266
sqft
|
built
2013
7527 Jenison Dr, Indianapolis, IN 46217
$-462
Cash flow
-6.3%
Cash-on-Cash Return
4.7%
Cap rate
0.6%
Rent to Value Ratio
Active
$259,900
2
bds
|
3
ba
|
1,666
sqft
|
built
2004
7412 Lattice Dr, Indianapolis, IN 46217
$-16
Cash flow
-0.3%
Cash-on-Cash Return
6.1%
Cap rate
0.8%
Rent to Value Ratio
Active
$330,000
4
bds
|
3
ba
|
2,151
sqft
|
built
1976
8835 Winding Ridge Rd, Indianapolis, IN 46217
$-172
Cash flow
-2.7%
Cash-on-Cash Return
5.5%
Cap rate
0.7%
Rent to Value Ratio
Active
$284,500
4
bds
|
3
ba
|
2,132
sqft
|
built
1991
8506 Friendship Ln, Indianapolis, IN 46217
$-215
Cash flow
-3.9%
Cash-on-Cash Return
5.2%
Cap rate
0.6%
Rent to Value Ratio
Active
$399,500
3
bds
|
2
ba
|
2,395
sqft
|
built
1990
361 Country Woods Dr, Indianapolis, IN 46217
$-480
Cash flow
-6.3%
Cash-on-Cash Return
4.7%
Cap rate
0.6%
Rent to Value Ratio
Active
$275,000
3
bds
|
3
ba
|
1,684
sqft
|
built
2017
7518 Boundary Bay Ct, Indianapolis, IN 46217
$-200
Cash flow
-3.8%
Cash-on-Cash Return
5.3%
Cap rate
0.7%
Rent to Value Ratio
Active
$445,000
4
bds
|
2
ba
|
2,408
sqft
|
built
1977
8901 Rocky Ridge Rd, Indianapolis, IN 46217
$-900
Cash flow
-10.6%
Cash-on-Cash Return
3.7%
Cap rate
0.4%
Rent to Value Ratio
Active
$309,999
4
bds
|
3
ba
|
2,099
sqft
|
built
2016
3801 Boundary Bay Dr, Indianapolis, IN 46217
$-246
Cash flow
-4.1%
Cash-on-Cash Return
5.2%
Cap rate
0.6%
Rent to Value Ratio
Active
$224,900
2
bds
|
2
ba
|
1,113
sqft
|
built
1999
7259 Registry Dr, Indianapolis, IN 46217
$-166
Cash flow
-3.9%
Cash-on-Cash Return
5.3%
Cap rate
0.7%
Rent to Value Ratio
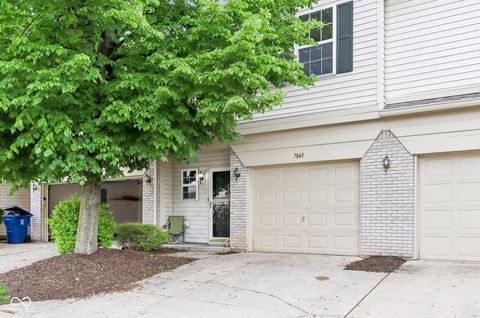
Active
$195,000
2
bds
|
3
ba
|
1,304
sqft
|
built
2001
7045 Gavin Dr, Indianapolis, IN 46217
$-328
Cash flow
-8.8%
Cash-on-Cash Return
4.1%
Cap rate
0.7%
Rent to Value Ratio
Active
$339,900
4
bds
|
3
ba
|
2,408
sqft
|
built
2019
7303 Beal Ln, Indianapolis, IN 46217
$-251
Cash flow
-3.9%
Cash-on-Cash Return
5.3%
Cap rate
0.6%
Rent to Value Ratio
Active
$345,000
4
bds
|
3
ba
|
2,862
sqft
|
built
1985
8160 Bold Forbes Ct, Indianapolis, IN 46217
$-249
Cash flow
-3.8%
Cash-on-Cash Return
5.3%
Cap rate
0.6%
Rent to Value Ratio
Active
$314,499
3
bds
|
3
ba
|
1,825
sqft
|
built
1988
8448 Seattle Slew Ln, Indianapolis, IN 46217
$-231
Cash flow
-3.8%
Cash-on-Cash Return
5.3%
Cap rate
0.6%
Rent to Value Ratio
Active
$239,000
3
bds
|
3
ba
|
2,132
sqft
|
built
2003
3137 Everbloom Way, Indianapolis, IN 46217
$-7
Cash flow
-0.2%
Cash-on-Cash Return
6.1%
Cap rate
0.8%
Rent to Value Ratio
Active
$440,000
4
bds
|
3
ba
|
3,445
sqft
|
built
1978
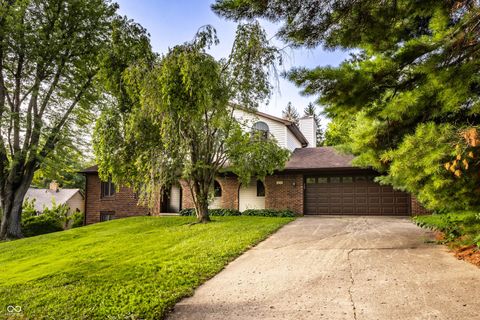
1722 Friendship Dr, Indianapolis, IN 46217
$-529
Cash flow
-6.3%
Cash-on-Cash Return
4.7%
Cap rate
0.6%
Rent to Value Ratio
Active
$232,900
3
bds
|
2
ba
|
1,268
sqft
|
built
1979
923 Bogalusa Ct, Indianapolis, IN 46217
$-89
Cash flow
-2.0%
Cash-on-Cash Return
5.7%
Cap rate
0.7%
Rent to Value Ratio
Active
$329,900
4
bds
|
3
ba
|
2,074
sqft
|
built
1975
8422 Kankakee Ct, Indianapolis, IN 46217
$-448
Cash flow
-7.1%
Cash-on-Cash Return
4.5%
Cap rate
0.5%
Rent to Value Ratio
Active
$274,900
3
bds
|
2
ba
|
1,664
sqft
|
built
1953
302 Maxwell Rd, Indianapolis, IN 46217
$-442
Cash flow
-8.4%
Cash-on-Cash Return
4.2%
Cap rate
0.5%
Rent to Value Ratio